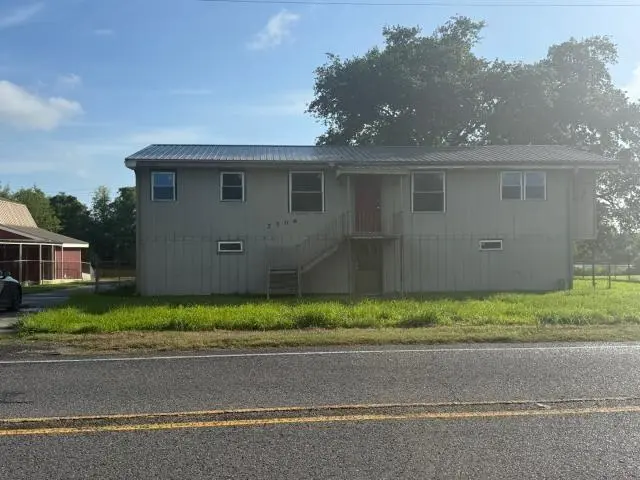
7706 Highway 308 Hwy · Lockport, LA
Flood risk 7/10 · Major
- FEMA flood zone
- X
- Chance of flooding over 30 yrs
- 0.94%
- Est. flood insurance / yr
- $507 – $1,088
Fire risk 1/10 · Minimal
- Est. fire insurance / yr
- $1,269 – $2,357
Heat risk 9/10 · Severe
- Hot days now (above 107°F)
- 7 days/yr
- Hot days in 30 yrs
- 21 days/yr
Wind risk 9/10 · Severe
- Chance of severe wind over 30 yrs
- 99.0%
Air-quality risk 2/10 · Minimal
- Unhealthy air days now
- 1 days/yr
- Unhealthy air days in 30 yrs
- 1 days/yr
Risk factors via First Street. Map © Google.
Why this score? — see what drove the B+ grade
The composite is a weighted blend of 9 inputs, each scored 0–100. Each bar is that input's sub-score; the figure is the points it added to the 100-point composite (weight × sub-score).
- Cash flow +30.0/30.0
- ARV discount +15.0/15.0
- DSCR +10.0/10.0
- 1% rule +9.7/10.0
- Schools +3.4/10.0
- Livability +3.2/5.0
- Rent growth +2.5/5.0
- Condition / age +2.5/5.0
- Appreciation +0.0/10.0
$84,900
🖨 Deal sheet 📄 Offer letter ✓ Due diligence
Listing remarks MLS
Great waterfront property located on Highway 308. This home is a clean slate ready for all you design ideas to come to life. Finest fishing around and near major highway for easy commute to the city. Come on by and take a look.
Key facts
- Waterfront property
- 2 acre lot
- Parking
Tags
Property features AI
Finance
- HOA & community: No association
Exterior
- Parking: Driveway
- Utilities: No public sewer available; No public water available
- Home design: 2-story property; Raised foundation; Property listed in poor condition
- Construction: Wood siding construction; Metal roof
- Exterior features: Outside city limits; Rectangular lot; Lot dimensions approximately 94 x 115 x 93 x 125
Interior
- Interior features: Six total rooms
Neighborhood map
What this means for you Summary
Snapshot
- This is a 3-bed/?-bath single-family listed at $85k.
Deal economics
- At list price, monthly cash flow is $278 ($3k/yr) — positive.
- The deal already cash-flows at list — no discount required.
- Meets the 1% rule at list price ($1k rent vs $85k).
- Recommended offer: $84k (1.5% below list) — sets the bar for market timing.
Location & tenants
- Location reads 64/100 on livability (#168 in LA) — a middle-class / working-renter tenant base. Strengths: cost of living A+, housing A+, health & safety A+; Watch: employment D, amenities F, commute F.
- Lafourche Parish (other): math 31% / reading 49% proficiency, ranked #22 of 98 in LA (top 22%) — families likely to look elsewhere, expect single-tenant / working-renter base with shorter leases.
- Market conditions: 56 active listings in the ZIP; 1 comparable units currently listed for rent nearby; 319 units permitted in Lafourche Parish in 2024 (0 in 5+ unit buildings).
Forward outlook
- Local home prices are declining (-3.0%/yr); year-one equity from $587 of loan paydown is wiped out by about $3k of value loss. Plan a longer hold.
- At projected returns (-3.0% appreciation + 3.0% rent growth), your $24k cash investment doubles in ~9 years — after that, you're playing with house money.
Negotiation context
- It's been on market 18 days — a 2% lower offer ($84k) is reasonable based on typical stale-listing flexibility.
- 9 sale attempts since 14y ago with the ask held roughly flat each time — persistent listings suggest the price (not the market) is what's stuck; bring a comps-based counter.
Risks & watch-outs
- Watch-outs: flood insurance adds $66/mo.
- Climate carrying-cost: major flood risk; severe wind risk, 99% chance of damaging wind over 30y; extreme-heat days projected 7→21/yr by 2055 (HVAC capex compounding) — expect insurance premiums to compound above CPI over the hold.
Questions for the listing agent
- Built in 1969 — when were the roof, HVAC, electrical panel, plumbing, and water heater last replaced?
- What's the actual annual flood-insurance premium (NFIP or private), and is the property in a SFHA with mandatory coverage?
- Is there a deadline driving the sale (1031 exchange, divorce, estate, relocation)? That informs how much negotiation room exists.
- Schools are A-rated — typically a magnet for longer-tenancy family renters. What's the average tenant stay here, and is there a school-zone premium baked into asking?
- What's the average days-on-market for RENTAL listings here right now (not sales)? A rising rental-DOM trend means longer vacancies and softer asking-rent achievability than the comps imply.
- What's the recent tenant-quality profile in this submarket — average credit score on applications, eviction rate, late-payment / NSF rate, and stable-employment percentage? A property-management company in the area should have these aggregated.
- How much new for-sale + rental construction is in the pipeline within 1–3 miles? Heavy new supply typically softens prices + rents 12–24 months out; constrained supply supports both.
Investment metrics
- 1% rule
- 1.47% ✓
- Cap rate
- 11.17%
- Cash-on-cash
- 17.41%
- DSCR
- 1.77
- GRM
- 5.7
CMA / ARV
- ARV (on-the-fly)
- $168,980
- Comps found
- 5
Show comp detail 5 sales within ~0.75 mi
| Address | Dist | Beds/Ba | Sqft | Sold | Price | $/sf | Match |
|---|---|---|---|---|---|---|---|
| 104 Jennifer St | 0.32mi | 3/2.0 | 1,381 (-3%) | 19mo | $225,000 | $163 | 64 |
| 7484 Highway 308 | 0.37mi | 2/1.0 (-1) | 1,369 (-4%) | 10mo | $135,000 | $99 | 63 |
| 321 Karen Dr | 0.69mi | 3/1.5 | 1,400 (-1%) | 4mo | $225,000 | $161 | 62 |
| 310 Lark Dr | 0.68mi | 2/1.0 (-1) | 1,376 (-3%) | 3mo | $75,000 | $55 | 56 |
| 309 Lark Dr | 0.66mi | 3/2.0 | 1,561 (+10%) | 12mo | $185,000 | $119 | 43 |
Match score weights: distance 35% · size 25% · config 20% · recency 20%. Top-matched comps best support the ARV.
Projected returns pro-forma
-3.0% appreciation · 3.0% rent growth · sell at horizon
- IRR
- 4.4%
- Equity multiple
- 1.17×
- Total profit
- $4,067
- Equity at exit
- $12,659
- IRR
- 14.0%
- Equity multiple
- 2.13×
- Total profit
- $26,755
- Equity at exit
- $7,341
Cash invested: $23,772 (down + closing). Projections, not guarantees.
Landlord ↔ Tenant lean methodology
- Overall (STATE)
- 90 Strongly Landlord-Friendly
- State Louisiana
- 90 Strongly Landlord-Friendly · R+12
- County
- — inherits STATE
- City
- — inherits STATE
ZIP-level market 70374
- Active inventory
- 56
- Price-to-rent
- 5.7×
Monthly cashflow live
- Estimated rent
- $1,250 medium interval (Pro) →
- Mortgage (P&I)
- −$445
- Tax from tax record
- −$162 /mo · $1,945/yr
- Insurance
- −$35
- Flood insurance flood zone
- −$66 /mo · $798/yr
- HOA
- −$0
- Vacancy / Maint / Mgmt
- −$262
- Net cashflow
- $278
Break-even live
UW: 25.0% down · 7.5% · 30yr · 1.5% tax · 5.0% vac · 8.0% maint · 8.0% mgmt
Financing live
Cash to close
- Down payment
- $21,225
- Closing costs
- $2,547
- Reserves months
- —
- Total cash needed
- —
Loan-product check · same deal, 3 products live
Conventional
25% down · 7.5% · 30yr
- Down + closing
- —
- Monthly P&I
- —
- Monthly cashflow
- —
- DSCR
- —
- Eligible?
- —
Personal DTI + credit; lowest rate.
DSCR
20% down · 8.5% · 30yr
- Down + closing
- —
- Monthly P&I
- —
- Monthly cashflow
- —
- DSCR
- —
- Eligible?
- —
No personal income docs; deal must DSCR.
Hard money
10% down · 12.0% · 12mo
- Down + closing
- —
- Monthly P&I
- —
- Monthly cashflow
- —
- DSCR
- —
- Eligible?
- —
Short-term bridge; refi at stabilization.
Rent comps 1 comps
| Address | Beds | Baths | Sqft | Rent | $/sqft | DOM | Units | Dist |
|---|---|---|---|---|---|---|---|---|
| 200 McCloud Rd Lockport, LA | 3.0 | 1.0 | 910 | $1,250 | $1.37 | 43d | 1 | 1.38mi |
Listing history 15 events
-
2026-06-19days on market $84,900 Active 18 DOM
-
2026-06-18days on market $84,900 Active 17 DOM
-
2026-06-17days on market $84,900 Active 16 DOM
-
2026-06-16days on market $84,900 Active 15 DOM
-
2026-06-15days on market $84,900 Active 14 DOM
-
2026-06-14days on market $84,900 Active 12 DOM
-
2026-06-13days on market $84,900 Active 11 DOM
-
2026-06-10days on market $84,900 Active 9 DOM
-
2026-06-09days on market $84,900 Active 8 DOM
-
2026-06-08days on market $84,900 Active 7 DOM
-
2026-06-07days on market $84,900 Active 6 DOM
-
2026-06-05days on market $84,900 Active 3 DOM
-
2026-06-03days on market $84,900 Active 2 DOM
-
2026-06-02remarks 227-char remark
-
2026-06-02$84,900 Active 1 DOM
ⓘ Source: listings_history table (triggers on properties + properties_extension) + one-shot
backfill from property_details.listing_events for pre-trigger history.
Tax reassessment forecast LA · Resets to sale price
- Current annual tax
- $1,945 · $162/mo
- Projected year-2 tax
- $1,945 · $162/mo
- Expected delta
- $0/yr ($0/mo · 0.0%)
ⓘ Screening estimate from a state-policy table — verify with the county assessor before closing.
Climate risk First Street
- Flood 7/10 Severe FEMA zone X · 94% chance over 30 yrs
- Wildfire 1/10 Low
- Heat 9/10 Extreme 7 d/yr ≥107°F today · 21 d/yr by 30 yrs out
- Wind 9/10 Extreme 99% chance of damaging wind over 30 yrs
- Air quality 2/10 Low 1 unhealthy d/yr today · 1 by 30 yrs out
Nearby sold comps map
Loading sold comps map…
Walkable amenities ~0.75 mi
Loading nearby amenities…
Taxation est. · year 1
- Rental income
- $15,000
- − Mortgage interest
- −$4,756
- − Property taxes
- −$1,945
- − Insurance
- −$1,222
- − Repairs & maintenance
- −$1,200
- − Management
- −$1,200
- − Depreciation
- −$2,470
- Taxable income
- $2,208
- Est. tax owed @ 24.0%
- −$530
- After-tax cash flow
- $2,811/yr
For passive investors: Depreciation is non-cash, so a rental often shows a tax loss while cash-flowing — sheltering income. Rental losses are passive: they offset passive income freely, and up to $25,000/yr can offset ordinary (W-2) income if you actively participate and your MAGI is under $100k (phasing out to $0 by $150k); unused losses carry forward. On sale, claimed depreciation is recaptured at up to 25%, and gains may owe capital-gains tax (a 1031 exchange can defer both). Figures are a year-1 estimate at your 24.0% rate — not tax advice; consult a CPA.
Schools (NCES district)
- District
- Lafourche Parish
- NCES district ID
- 2200900
- Math proficiency
- 31% ▼ -43.00%
- Reading proficiency
- 49% ▼ -32.00%
- Median HH income
- $49,703
- Composite
- 34.4/100
- National rank
- #5205
- State rank
- #22 of 98 in LA
Livability — Lockport
- Score
- 64/100
- State rank
- #168
- US rank
- #14113
Category grades
Schools grade is shown separately in the Schools card above.
Census & demographics
- Population (ZIP)
- 6,506
Population outlook (Lafourche County) Hauer SSP2
- Today (2025)
- 102,122 people
- By 2030
- 103,361 · +1.2%
- By 2040
- 104,401 · +2.2%
- By 2050
- 102,795 · +0.7%
- By 2075
- 95,599 · -6.4%
- By 2100
- 82,303 · -19.4%
Race, ethnicity, and origin ACS 2023
- Neighborhood character
- Predominantly White (80%)
- Race & ethnicity
- White 80% Hispanic / Latino 11% Two or more races 8% Black 2% Native American 2%
- Hispanic origin (detail)
- Mexican 1%
- Common ancestry
- Lithuanian 18%
- Foreign-born
- 6% · Canada
- Languages at home
- 84% English-only · Spanish 9% French/Haitian/Cajun 6% Korean 1%
Political lean MEDSL · Lafourche
- 2024 margin
- Solid R (+62.1) · D 18.4% · R 80.4% · Other 1.2%
- 2008→2024 swing
- -16.1pp toward R · 2008: -46.0pp · 2024: -62.1pp
- All cycles
- 2024: R+62.1 2020: R+60.3 2016: R+56.5 2012: R+48.5 2008: R+46.0
Not yet ingested
- Civics
- —
Market trends
- HPI YoY
- ▼ -74.36%
- Current HPI
- 99.1459
- Rent YoY
- —
- Metro
- —
- State GDP YoY
- ▲ 3.29%
- F500 in state
- 10
Industry mix (Fortune 500 HQ in LA)
| Industry | F500 HQs | Revenue |
|---|---|---|
| Telecommunications | 2 | $23B |
|
||
| Utilities | 1 | $12B |
|
||
| Wholesale / Distribution | 1 | $5B |
|
||
| Advertising | 1 | $2B |
|
||
Price history
-50.1% since first listed12 events — show timeline
- 2026-05-29 Listed $84,900 GSREIN
- 2026-05-29 Listed $84,900 AcadianaMLS
- 2025-07-08 Listed $145,000 GBRMLS
- 2025-07-07 Listed $145,000 AcadianaMLS
- 2023-03-02 Delisted — GBRMLS
- 2022-08-19 Listed $147,900 AcadianaMLS
- 2022-08-19 Listed $147,900 GBRMLS
- 2015-11-09 Sold (MLS) — GBRMLS
- 2015-07-08 Listed $179,000 GBRMLS
- 2015-07-08 Listed $179,000 AcadianaMLS
- 2013-01-23 Sold (Public Records) $170,000 Public Records
- 2012-05-29 Listed $170,000 AcadianaMLS
Property tax history
+0.1%/yrLatest (2024): $1,945 · +3.0% YoY. Source: county tax records.
Cash-flow waterfall
monthlySold comps — $/sqft
last 12 mo · ≤1 miLoading sold comps…