 Multi-family
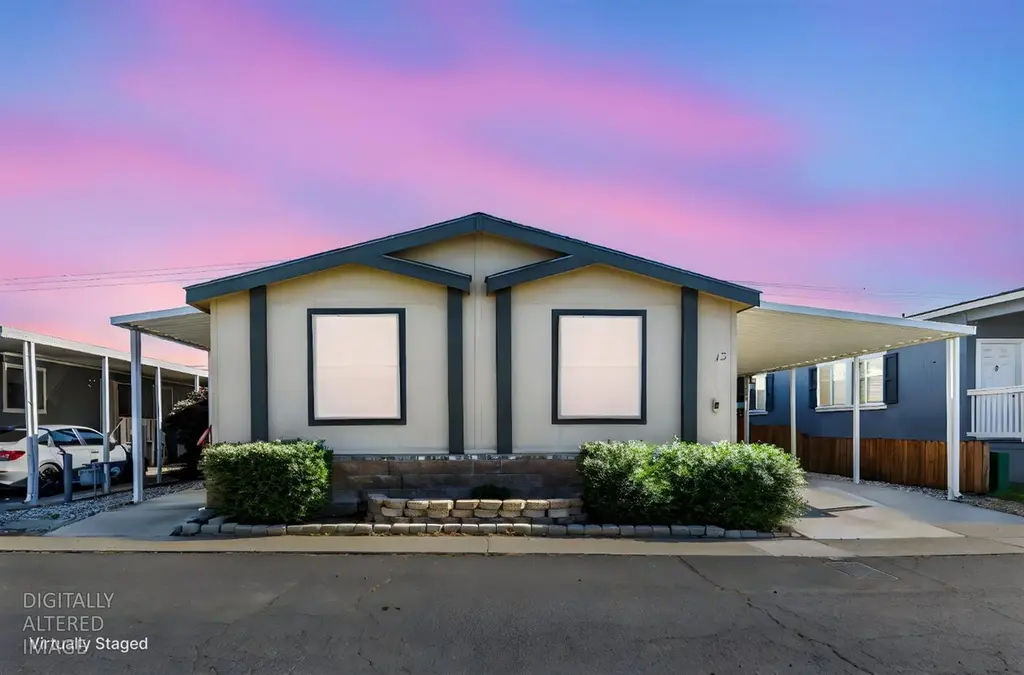
5130 County Road 99w #13 · Dunnigan, CA
Flood risk 6/10 · Moderate
- FEMA flood zone
- X (unshaded)
- Chance of flooding over 30 yrs
- 0.97%
- Est. flood insurance / yr
- $507 – $1,088
Fire risk 6/10 · Moderate
- Est. fire insurance / yr
- $659 – $1,223
Heat risk 7/10 · Major
- Hot days now (above 105°F)
- 6 days/yr
- Hot days in 30 yrs
- 13 days/yr
Wind risk 1/10 · Minimal
- Chance of severe wind over 30 yrs
- —
Air-quality risk 10/10 · Severe
- Unhealthy air days now
- 31 days/yr
- Unhealthy air days in 30 yrs
- 32 days/yr
Risk factors via First Street. Map © Google.
Why this score? — see what drove the B- grade
The composite is a weighted blend of 9 inputs, each scored 0–100. Each bar is that input's sub-score; the figure is the points it added to the 100-point composite (weight × sub-score).
- Cash flow +30.0/30.0
- DSCR +10.0/10.0
- 1% rule +8.5/10.0
- Appreciation +5.2/10.0
- Condition / age +3.8/5.0
- Schools +3.5/10.0
- Livability +2.9/5.0
- Rent growth +2.5/5.0
- ARV discount +1.6/15.0
$214,900
🖨 Deal sheet 📄 Offer letter ✓ Due diligence
Multi-family units
County records classify this as Multi-Family (2-4 Unit). Listing-text estimate: 1 unit. estimate disagrees with records
Listing remarks
Welcome home to this beautifully maintained 3 bedroom 2 bath double wide mobile home offering a bright and open floor plan designed for comfortable living. A skylight in the kitchen fills the space with natural light, enhancing the open concept layout that seamlessly connects with living room, dining area and kitchen. This home features generous sized bedrooms including a large primary suite complete with dual vanities, a relaxing sunken tub and a separate shower stall, creating a true retreat! Laminate flooring flows throughout the home, adding both style and durability. Enjoy the convenience of an indoor laundry room with built in cabinetry for added storage and organization. Energy effic
Key facts
- 2 parking spots
- Built 2001
- Listed 55 days
Property features AI
Finance
- Other: Located at 5130 County Road 99W #13, Dunnigan, CA 95937; Directions: From I-5 North, exit County Road 8, turn right and follow to CR 99W, turn left onto CR 99W, turn left into Country Fair Estates. Take the first right into the park; home will be on the right.
- HOA & community: No homeowners association; Not a senior community; Not a land-lease home
Exterior
- Parking: Attached covered parking; Guest parking available
- Utilities: Individual gas meter; 220-volt outlet in laundry; Public water; Public sewer
- Home design: Manufactured home located in a park; Double-wide; Built in 2001; Facing direction not specified; Single-level entry
- Construction: Wood skirting; Composition roof; Manufactured by Fleetwood Homes of CA
- Exterior features: Carport awning; Porch; Garden and landscaped backyard; Regular-shaped lot; Shed(s) / storage area
Interior
- Kitchen: Free-standing gas range; Dishwasher; Microwave; Skylight in kitchen
- Bedrooms: 3 bedrooms
- Flooring: Laminate flooring
- Bathrooms: 2 full bathrooms; Tubs with shower over
- Heating & cooling: Central heating; Central air conditioning; Ceiling fans
- Interior features: Cathedral/vaulted living area with great room layout; Porch with steps; Window screens; Storage shed on property; Pets allowed
- Laundry & utility: Indoor laundry room with hookups; Gas hook-up for laundry
Neighborhood map
What this means for you Summary
Snapshot
- This is a 3-bed/2.0-bath multifamily listed at $215k. Condition is rated good.
Deal economics
- At list price, monthly cash flow is $814 ($10k/yr) — positive.
- The deal already cash-flows at list — no discount required.
- Meets the 1% rule at list price ($3k rent vs $215k).
- Recommended offer: $208k (3.0% below list) — sets the bar for market timing.
Location & tenants
- Location reads 58/100 on livability (#704 in CA) — a working-class tenant base; expect higher turnover. Strengths: housing A+, crime B+; Watch: employment D, schools F, amenities F.
- Pierce Joint Unified (town): math 32% / reading 42% proficiency, ranked #807 of 1,400 in CA (top 58%) — families likely to look elsewhere, expect single-tenant / working-renter base with shorter leases.
- Market conditions: 9 active listings in the ZIP; 721 units permitted in Yolo County in 2024 (260 in 5+ unit buildings).
Forward outlook
- In year one you build about $2k of equity ($1k loan paydown + $1k appreciation (0.5% local appreciation)).
- Yolo County population projected at +31% by 2050 — long-run rental-demand tailwind backs the buy-and-hold thesis.
- At projected returns (0.5% appreciation + 3.0% rent growth), your $60k cash investment doubles in ~5 years — after that, you're playing with house money.
Negotiation context
- It's been on market 56 days — a 3% lower offer ($208k) is reasonable based on typical stale-listing flexibility.
Risks & watch-outs
- Climate carrying-cost: major flood risk; major wildfire risk; extreme-heat days projected 6→13/yr by 2055 (HVAC capex compounding) — expect insurance premiums to compound above CPI over the hold.
Questions for the listing agent
- It's been on market 56 days. Have you received any prior offers? Is the seller open to a 3% concession, seller financing, or rate buy-down credit?
- Is there a deadline driving the sale (1031 exchange, divorce, estate, relocation)? That informs how much negotiation room exists.
- Schools are F-rated, which usually means shorter tenancies and higher turnover. Who's the typical renter profile here, and what's been the actual vacancy rate?
- What's the average days-on-market for RENTAL listings here right now (not sales)? A rising rental-DOM trend means longer vacancies and softer asking-rent achievability than the comps imply.
- What's the recent tenant-quality profile in this submarket — average credit score on applications, eviction rate, late-payment / NSF rate, and stable-employment percentage? A property-management company in the area should have these aggregated.
- How much new apartment / multifamily construction is in the pipeline within 1–3 miles? Heavy new supply (>2% of stock underway) typically softens rents 12–24 months out; light construction supports rent growth.
Investment metrics
- 1% rule
- 1.35% ✓
- Cap rate
- 10.84%
- Cash-on-cash
- 16.23%
- DSCR
- 1.72
- GRM
- 6.2
CMA / ARV
- ARV (median comp)
- $190,000
- List price
- $214,900
- Delta
- 13.11%
- Verdict
- OVERPRICED
- Comps
- 3 within 1.0 mi
Projected returns pro-forma
0.47% appreciation · 3.0% rent growth · sell at horizon
- IRR
- 16.9%
- Equity multiple
- 1.84×
- Total profit
- $50,386
- Equity at exit
- $67,506
- IRR
- 20.8%
- Equity multiple
- 3.40×
- Total profit
- $144,519
- Equity at exit
- $85,340
Cash invested: $60,172 (down + closing). Projections, not guarantees.
Landlord ↔ Tenant lean methodology
- Overall (STATE)
- 18 Strongly Tenant-Friendly
- State California
- 18 Strongly Tenant-Friendly · D+13
- County
- — inherits STATE
- City
- — inherits STATE
ZIP-level market 95937
- Home prices YoY
- 0.3%
- Active inventory
- 9
- Price-to-rent
- 12.3×
Monthly cashflow live
- Estimated rent
- $2,910 medium interval (Pro) →
- Mortgage (P&I)
- −$1,127
- Tax est. 1.5%
- −$269 /mo · $3,224/yr
- Insurance
- −$90
- HOA
- −$0
- Vacancy / Maint / Mgmt
- −$611
- Net cashflow
- $814
Break-even live
2-unit breakdown (identical units grouped — click to expand)
| Units | Beds | Baths | Est. rent |
|---|---|---|---|
| 2× units | 3 | 2 | $2,910 |
| #1 | 3 | 2 | $1,455 |
| #2 | 3 | 2 | $1,455 |
| Total (2 units) | $2,910 | ||
UW: 25.0% down · 7.5% · 30yr · 1.5% tax · 5.0% vac · 8.0% maint · 8.0% mgmt
Financing live
Cash to close
- Down payment
- $53,725
- Closing costs
- $6,447
- Reserves months
- —
- Total cash needed
- —
Loan-product check · same deal, 3 products live
Conventional
25% down · 7.5% · 30yr
- Down + closing
- —
- Monthly P&I
- —
- Monthly cashflow
- —
- DSCR
- —
- Eligible?
- —
Personal DTI + credit; lowest rate.
DSCR
20% down · 8.5% · 30yr
- Down + closing
- —
- Monthly P&I
- —
- Monthly cashflow
- —
- DSCR
- —
- Eligible?
- —
No personal income docs; deal must DSCR.
Hard money
10% down · 12.0% · 12mo
- Down + closing
- —
- Monthly P&I
- —
- Monthly cashflow
- —
- DSCR
- —
- Eligible?
- —
Short-term bridge; refi at stabilization.
Listing history 16 events
-
2026-06-19days on market $214,900 Active 56 DOM
-
2026-06-18days on market $214,900 Active 55 DOM
-
2026-06-17days on market $214,900 Active 54 DOM
-
2026-06-16days on market $214,900 Active 53 DOM
-
2026-06-15days on market $214,900 Active 52 DOM
-
2026-06-14days on market $214,900 Active 50 DOM
-
2026-06-12days on market $214,900 Active 49 DOM
-
2026-06-09days on market $214,900 Active 46 DOM
-
2026-06-08days on market $214,900 Active 45 DOM
-
2026-06-07days on market $214,900 Active 44 DOM
-
2026-06-07days on market $214,900 Active 43 DOM
-
2026-06-04days on market $214,900 Active 40 DOM
-
2026-06-02days on market $214,900 Active 39 DOM
-
2026-06-01days on market $214,900 Active 38 DOM
-
2026-05-31days on market $214,900 Active 37 DOM
-
2026-05-31days on market $214,900 Active 36 DOM
ⓘ Source: listings_history table (triggers on properties + properties_extension) + one-shot
backfill from property_details.listing_events for pre-trigger history.
Climate risk First Street
- Flood 6/10 Major FEMA zone X (unshaded) · 97% chance over 30 yrs
- Wildfire 6/10 Major
- Heat 7/10 Severe 6 d/yr ≥105°F today · 13 d/yr by 30 yrs out
- Wind 1/10 Low
- Air quality 10/10 Extreme 31 unhealthy d/yr today · 32 by 30 yrs out
Nearby sold comps map
Loading sold comps map…
Walkable amenities ~0.75 mi
Loading nearby amenities…
Taxation est. · year 1
- Rental income
- $34,920
- − Mortgage interest
- −$12,038
- − Property taxes
- −$3,224
- − Insurance
- −$1,074
- − Repairs & maintenance
- −$2,794
- − Management
- −$2,794
- − Depreciation
- −$6,252
- Taxable income
- $6,745
- Est. tax owed @ 24.0%
- −$1,619
- After-tax cash flow
- $8,146/yr
For passive investors: Depreciation is non-cash, so a rental often shows a tax loss while cash-flowing — sheltering income. Rental losses are passive: they offset passive income freely, and up to $25,000/yr can offset ordinary (W-2) income if you actively participate and your MAGI is under $100k (phasing out to $0 by $150k); unused losses carry forward. On sale, claimed depreciation is recaptured at up to 25%, and gains may owe capital-gains tax (a 1031 exchange can defer both). Figures are a year-1 estimate at your 24.0% rate — not tax advice; consult a CPA.
Condition & rehab AI · 12 photos
This well-maintained mobile home is in good condition with a good condition score of 75. It has a good exterior, interior walls, and flooring. The kitchen and bathrooms are in good condition. The home is ready for cosmetic updates such as painting and kitchen and bathroom renovations to increase its value.
Value-add opportunities
- Both Painting the exterior and interior walls — Fresh paint can enhance the curb appeal and interior aesthetics.
- Both Updating the kitchen cabinets and countertops — Modernizing the kitchen can increase both resale and rental value.
- Both Upgrading the bathrooms with new fixtures and tile — Renovating bathrooms can significantly boost both resale and rental value.
- Both Adding smart home technology — Smart home features can increase both resale and rental value by making the home more attractive to potential buyers and renters.
Renovation cost estimate screening
Value-add ROI direction
- Both Painting the exterior and interior walls — Fresh paint can enhance the curb appeal and interior aesthetics. ↑
- Both Updating the kitchen cabinets and countertops — Modernizing the kitchen can increase both resale and rental value. ↑
- Both Upgrading the bathrooms with new fixtures and tile — Renovating bathrooms can significantly boost both resale and rental value. ↑
- Both Adding smart home technology — Smart home features can increase both resale and rental value by making the home more attractive to potential buyers and renters. ↑
ⓘ Cost ranges are severity-bucket heuristics (US national rule-of-thumb). Get contractor quotes + a written scope before underwriting a rehab budget.
Schools (NCES district)
- District
- Pierce Joint Unified
- NCES district ID
- 0630360
- Math proficiency
- 32% ▲ 2.00%
- Reading proficiency
- 42% ▲ 2.00%
- Median HH income
- $52,194
- Composite
- 34.75/100
- National rank
- #10034
- State rank
- #807 of 1400 in CA
Livability — Dunnigan
- Score
- 58/100
- State rank
- #704
- US rank
- #21231
Category grades
Schools grade is shown separately in the Schools card above.
Census & demographics
- Census place
- Dunnigan, CA
- Population (ZIP)
- 996
Population outlook (Yolo County) Hauer SSP2
- Today (2025)
- 242,183 people
- By 2030
- 257,662 · +6.4%
- By 2040
- 288,050 · +18.9%
- By 2050
- 318,202 · +31.4%
- By 2075
- 392,736 · +62.2%
- By 2100
- 438,150 · +80.9%
Race, ethnicity, and origin ACS 2023
- Neighborhood character
- Majority White (62%)
- Race & ethnicity
- White 62% Hispanic / Latino 26% Two or more races 18% Asian 5% Black 2% Native American 1%
- Hispanic origin (detail)
- Mexican 26%
- Common ancestry
- Slovak 11% Serbian 9% Irish 4%
- Foreign-born
- 14% · Canada
- Languages at home
- 63% English-only · Spanish 32% Other Asian/Pacific 6%
Political lean MEDSL · Yolo
- 2024 margin
- Solid D (+36.2) · D 66.3% · R 30.1% · Other 3.6%
- 2008→2024 swing
- 0.0pp no change · 2008: 36.2pp · 2024: 36.2pp
- All cycles
- 2024: D+36.2 2020: D+41.4 2016: D+42.0 2012: D+33.2 2008: D+36.2
Not yet ingested
- Civics
- —
Market trends
- HPI YoY
- ▲ 0.47%
- Current HPI
- 146.7633
- Rent YoY
- —
- Metro
- —
- State GDP YoY
- ▲ 3.21%
- F500 in state
- 116
Industry mix (Fortune 500 HQ in CA)
| Industry | F500 HQs | Revenue |
|---|---|---|
| Technology | 27 | $1,492B |
|
||
| Financial Services | 3 | $174B |
|
||
| Retail | 3 | $44B |
|
||
| Insurance | 3 | $26B |
|
||
| Media / Entertainment | 2 | $115B |
|
||
| Pharmaceuticals / Biotech | 2 | $62B |
|
||
Cash-flow waterfall
monthlySold comps — $/sqft
last 12 mo · ≤1 miLoading sold comps…