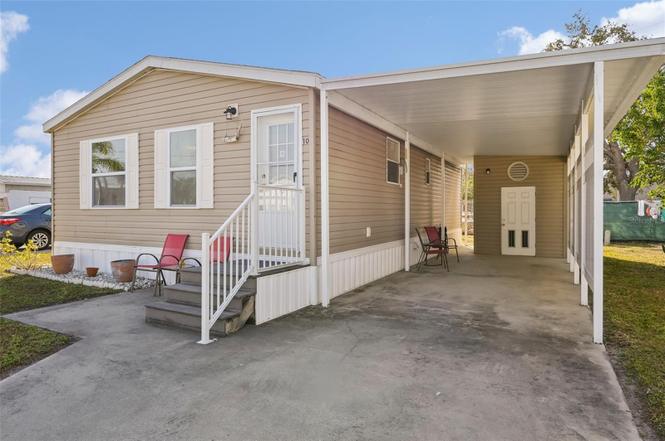
6904 Cortez Rd W #10 · Bradenton, FL
Flood risk 4/10 · Minor
- FEMA flood zone
- X (unshaded)
- Chance of flooding over 30 yrs
- 0.22%
- Est. flood insurance / yr
- $507 – $1,088
Fire risk 3/10 · Minor
- Est. fire insurance / yr
- $947 – $1,759
Heat risk 10/10 · Severe
- Hot days now (above 106°F)
- 7 days/yr
- Hot days in 30 yrs
- 29 days/yr
Wind risk 10/10 · Severe
- Chance of severe wind over 30 yrs
- 99.0%
Air-quality risk 3/10 · Minor
- Unhealthy air days now
- 2 days/yr
- Unhealthy air days in 30 yrs
- 2 days/yr
Risk factors via First Street. Map © Google.
Why this score? — see what drove the C+ grade
The composite is a weighted blend of 9 inputs, each scored 0–100. Each bar is that input's sub-score; the figure is the points it added to the 100-point composite (weight × sub-score).
- Cash flow +25.8/30.0
- DSCR +8.6/10.0
- 1% rule +7.6/10.0
- ARV discount +7.5/15.0
- Schools +4.4/10.0
- Livability +4.0/5.0
- Condition / age +2.5/5.0
- Rent growth +1.0/5.0
- Appreciation +0.0/10.0
$147,500
🖨 Deal sheet 📄 Offer letter ✓ Due diligence
Listing remarks
Welcome to Royal Garden Estates, your gateway to Anna Maria Island! NOT LOT RENT! This home is less than 5 MILES to the beach and NOT IN A FLOOD ZONE! This is the perfect opportunity to combine your love for the beach with a location with less worries! In addition to its proximity to the beach, the community is also adjacent to a large shopping plaza, including Winn Dixie, Starbucks, and First Watch! Oh, and the best part is that this home was built in 2010 and is the newest home in this park! The newer homes were built to higher standards, and are insurable! Just when you think it can’t get any better, you can’t live much cheaper, with a maintenance fee of ONLY $133 PER MONTH!
Key facts
- Mostly furnished
- Not in a flood zone
- Carport
Tags
Property features AI
Finance
- Other: Property zoning: RSMH6; Unit is offered furnished; Directions: Enter the community, take the first left; home will be on your left
- Financial info: Total annual fees $1,596; Total monthly fees $133; Property type: Residential — Manufactured Home
- HOA & community: Located in Sea Breeze MHP association; Monthly association fee of $133 (required); Senior community; Pets not allowed
Exterior
- Parking: Has a 1-space carport
- Utilities: Public water; Public sewer; Electricity connected; Sewer connected; Water connected
- Home design: Manufactured double-wide home; Single-story; Faces north; Located in a planned unit development
- Construction: Vinyl siding; Shingle roof; Built on a crawlspace
- Exterior features: Outdoor lighting; Asphalt paved road access
Interior
- Kitchen: Dishwasher; Microwave; Range; Refrigerator; Electric water heater
- Bedrooms: 2 bedrooms
- Flooring: Laminate; Crawlspace foundation (interior access noted)
- Bathrooms: 2 full bathrooms
- Heating & cooling: Central heating; Central air conditioning
- Interior features: Cathedral ceilings; Ceiling fans; Thermostat; Window treatments; 7 total rooms
- Laundry & utility: Washer; Dryer; Inside laundry in a laundry closet
Neighborhood map
What this means for you Summary
Snapshot
- This is a 2-bed/2.0-bath manufactured listed at $148k.
Deal economics
- At list price, monthly cash flow is $358 ($4k/yr) — positive.
- The deal already cash-flows at list — no discount required.
- Meets the 1% rule at list price ($2k rent vs $148k).
- Recommended offer: $130k (12.0% below list) — sets the bar for market timing.
- Cap rate 9.2% vs local median 3.6% in Bradenton — top-decile yield for the area; either an underpriced asset or a hidden risk that comps aren't pricing in. Stress-test before assuming the spread holds.
Location & tenants
- Location reads 81/100 on livability (#101 in FL, #1,528 nationally) — a professional / high-income tenant draw. Strengths: commute A+, cost of living A+, housing A+; Watch: employment D+, crime D, amenities F.
- Manatee (suburban): math 54% / reading 50% proficiency, ranked #26 of 73 in FL (top 36%) — acceptable for families but not a draw, mixed tenant base, ~2y average lease.
- Market conditions: Rents falling (-6.1%/yr); 549 active listings in the ZIP; 37 comparable units currently listed for rent nearby; rentals leasing fast (median 12d on market — plan ~1-2 weeks tenant-placement turnaround); 7,472 units permitted in Manatee County in 2024 (1,782 in 5+ unit buildings).
- This rent runs 35% of the median local income ($64k/yr) — at the standard rent-burdened threshold; future hikes will face affordability resistance.
Forward outlook
- Local home prices are declining (-3.0%/yr); year-one equity from $1k of loan paydown is wiped out by about $4k of value loss. Plan a longer hold.
- Manatee County population projected at +43% by 2050 — long-run rental-demand tailwind backs the buy-and-hold thesis.
Negotiation context
- It's been on market 157 days — a 12% lower offer ($130k) is reasonable based on typical stale-listing flexibility.
- 2 sale attempts; this cycle's ask has dropped $22k (13%) from the opening price — seller is motivated, your offer sets the floor, not the list.
- Current owner paid $55k; list at $148k implies a 168% gain — meaningful room to come down on a strong offer.
Risks & watch-outs
- Climate carrying-cost: severe wind risk, 99% chance of damaging wind over 30y; extreme-heat days projected 7→29/yr by 2055 (HVAC capex compounding) — expect insurance premiums to compound above CPI over the hold.
Questions for the listing agent
- It's been on market 157 days. Have you received any prior offers? Is the seller open to a 12% concession, seller financing, or rate buy-down credit?
- What does the HOA fee cover, when was the last increase, and are there any pending special assessments or reserve-fund shortfalls?
- Why hasn't it sold? Are there any deal-killer items the seller is aware of (foundation, flood, title, zoning, code violations)?
- Is there a deadline driving the sale (1031 exchange, divorce, estate, relocation)? That informs how much negotiation room exists.
- Crime grade is D in this area — have there been break-ins, vandalism, or insurance claims at this property in the last 3 years? What carrier currently insures it and at what premium?
- What's the average days-on-market for RENTAL listings here right now (not sales)? A rising rental-DOM trend means longer vacancies and softer asking-rent achievability than the comps imply.
- What's the recent tenant-quality profile in this submarket — average credit score on applications, eviction rate, late-payment / NSF rate, and stable-employment percentage? A property-management company in the area should have these aggregated.
- How much new for-sale + rental construction is in the pipeline within 1–3 miles? Heavy new supply typically softens prices + rents 12–24 months out; constrained supply supports both.
Investment metrics
- 1% rule
- 1.26% ✓
- Cap rate
- 9.20%
- Cash-on-cash
- 10.39%
- DSCR
- 1.46
- GRM
- 6.6
CMA / ARV
No comps found within radius.
Projected returns pro-forma
-3.0% appreciation · 0.0% rent growth · sell at horizon
- IRR
- -4.4%
- Equity multiple
- 0.84×
- Total profit
- $-6,499
- Equity at exit
- $21,993
- IRR
- 1.2%
- Equity multiple
- 1.07×
- Total profit
- $2,931
- Equity at exit
- $12,753
Cash invested: $41,300 (down + closing). Projections, not guarantees.
Landlord ↔ Tenant lean methodology
- Overall (STATE)
- 87 Strongly Landlord-Friendly
- State Florida
- 87 Strongly Landlord-Friendly · R+3
- County
- — inherits STATE
- City
- — inherits STATE
ZIP-level market 34210
- Rents YoY
- -6.1%
- Active inventory
- 549
- Price-to-rent
- 6.6×
Monthly cashflow live
- Estimated rent
- $1,861 high interval (Pro) →
- Mortgage (P&I)
- −$774
- Tax from tax record
- −$145 /mo · $1,739/yr
- Insurance
- −$61
- HOA
- −$133
- Vacancy / Maint / Mgmt
- −$391
- Net cashflow
- $358
Break-even live
UW: 25.0% down · 7.5% · 30yr · 1.5% tax · 5.0% vac · 8.0% maint · 8.0% mgmt
Financing live
Cash to close
- Down payment
- $36,875
- Closing costs
- $4,425
- Reserves months
- —
- Total cash needed
- —
Loan-product check · same deal, 3 products live
Conventional
25% down · 7.5% · 30yr
- Down + closing
- —
- Monthly P&I
- —
- Monthly cashflow
- —
- DSCR
- —
- Eligible?
- —
Personal DTI + credit; lowest rate.
DSCR
20% down · 8.5% · 30yr
- Down + closing
- —
- Monthly P&I
- —
- Monthly cashflow
- —
- DSCR
- —
- Eligible?
- —
No personal income docs; deal must DSCR.
Hard money
10% down · 12.0% · 12mo
- Down + closing
- —
- Monthly P&I
- —
- Monthly cashflow
- —
- DSCR
- —
- Eligible?
- —
Short-term bridge; refi at stabilization.
Rent comps 37 comps
| Address | Beds | Baths | Sqft | Rent | $/sqft | DOM | Units | Dist |
|---|---|---|---|---|---|---|---|---|
| 4501 71st St W Bradenton, FL | 1.0–2.0 | 1.0–2.0 | 850 | $1,680 | $1.98 | 2d | 28 | 0.20mi |
| 6711 45th Ave W Unit A Bradenton, FL | 2.0 | 2.0 | 1100 | $1,700 | $1.55 | 16d | 1 | 0.23mi |
| 4209 66th Street Cir W Bradenton, FL | 2.0 | 2.0 | 1044 | $2,900 | $2.78 | 23d | 1 | 0.30mi |
| 4161 66th Street Cir W Bradenton, FL | 2.0 | 2.0 | 1044 | $1,800 | $1.72 | 16d | 1 | 0.30mi |
| 4112 66th Street Cir W Bradenton, FL | 2.0 | 2.0 | 1100 | $1,960 | $1.78 | 19d | 1 | 0.36mi |
| 4005 78th St W Bradenton, FL | 3.0 | 2.0 | 1000 | $1,895 | $1.90 | 3d | 1 | 0.46mi |
| 4116 62nd St W Bradenton, FL | 2.0 | 2.0 | 840 | $1,650 | $1.96 | 3d | 1 | 0.50mi |
| 4601 66th St W Bradenton, FL | 3.0 | 1.0–2.0 | 917 | $2,065 | $2.25 | 2d | 24 | 0.50mi |
| 4325 80th St W Bradenton, FL | 3.0 | 1.5 | 1000 | $2,200 | $2.20 | 23d | 1 | 0.57mi |
| 4118 59th St W Bradenton, FL | 2.0 | 1.0 | 756 | $1,800 | $2.38 | 16d | 1 | 0.69mi |
| 5907 36th Ave Cir W #5907 Bradenton, FL | 2.0 | 2.0 | 937 | $2,800 | $2.99 | 23d | 1 | 0.71mi |
| 2903 63rd St W Bradenton, FL | 1.0 | 1.0 | 693 | $2,000 | $2.89 | 3d | 1 | 0.82mi |
| 2926 63rd St W Bradenton, FL | 2.0 | 2.0 | 946 | $2,100 | $2.22 | 3d | 1 | 0.82mi |
| 2724 72nd St W Unit 2010 Bradenton, FL | 2.0 | 2.0 | 942 | $1,950 | $2.07 | 3d | 1 | 0.86mi |
| 2727 75th St W Bradenton, FL | 1.0–2.0 | 1.5 | 835 | $1,700 | $2.04 | 3d | 4 | 0.90mi |
| 4880 51st St W Bradenton, FL | 1.0–4.0 | 1.0–3.0 | 1019 | $1,527 | $1.50 | 3d | 11 | 0.92mi |
| 5909 30th Ave W Bradenton, FL | 1.0–2.0 | 1.0–2.0 | 788 | $1,670 | $2.12 | 2d | 6 | 0.93mi |
| 4850 51st St W Bradenton, FL | 1.0–2.0 | 1.0–2.0 | 800 | $1,750 | $2.19 | 14d | 3 | 0.95mi |
| 4850 51st St W Bradenton, FL | 1.0–2.0 | 1.0–2.0 | 800 | $1,750 | $2.19 | 3d | 2 | 0.95mi |
| 4802 51st St W Bradenton, FL | 1.0–2.0 | 1.0–2.0 | 1007 | $1,950 | $1.94 | 16d | 15 | 1.07mi |
| 4802 51st St W Bradenton, FL | 1.0–2.0 | 1.0–2.0 | 1007 | $1,950 | $1.94 | 3d | 13 | 1.07mi |
| 5933 28th Ave W Bradenton, FL | 1.0–2.0 | 1.0–2.0 | 945 | $2,013 | $2.13 | 1d | 6 | 1.07mi |
| 4512 86th Street Ct W Unit A Bradenton, FL | 2.0 | 1.0 | 755 | $1,500 | $1.99 | 23d | 1 | 1.12mi |
| 6304 Pointe West Blvd Unit A309 Bradenton, FL | 2.0 | 2.0 | 1042 | $1,795 | $1.72 | 10d | 1 | 1.18mi |
| 6415 21st Ave W Bradenton, FL | 1.0–2.0 | 1.0–2.0 | 1150 | $1,896 | $1.65 | 3d | 5 | 1.22mi |
| 4210 Ironwood Cir Unit 103J Bradenton, FL | 1.0 | 1.0 | 750 | $1,800 | $2.40 | 23d | 1 | 1.23mi |
| 2107 Palma Sola Blvd #8 Bradenton, FL | 2.0 | 2.0 | 1056 | $1,850 | $1.75 | 16d | 1 | 1.30mi |
| 4040 Ironwood Cir Unit 404F Bradenton, FL | 2.0 | 2.0 | 1008 | $1,750 | $1.74 | 11d | 1 | 1.30mi |
| 4040 Ironwood Cir Unit 406F Bradenton, FL | 2.0 | 2.0 | 1008 | $1,675 | $1.66 | 16d | 1 | 1.30mi |
| 4460 Ironwood Cir Unit 406 Bradenton, FL | 1.0 | 1.0 | 750 | $1,600 | $2.13 | 21d | 1 | 1.33mi |
| 4460 Ironwood Cir Unit 406 Bradenton, FL | 1.0 | 1.0 | 750 | $1,600 | $2.13 | 2d | 1 | 1.33mi |
| 4460 Ironwood Cir Unit 501A Bradenton, FL | 1.0 | 1.5 | 840 | $2,595 | $3.09 | 23d | 1 | 1.33mi |
| 4550 47th St W Bradenton, FL | 1.0–3.0 | 1.0–2.0 | 930 | $1,800 | $1.94 | 1d | 27 | 1.37mi |
| 4480 Ironwood Cir Unit 309 Bradenton, FL | 1.0 | 1.0 | 600 | $1,800 | $3.00 | 23d | 1 | 1.38mi |
| 4240 Ironwood Cir #404 Bradenton, FL | 2.0 | 2.0 | 1008 | $2,495 | $2.48 | 23d | 1 | 1.38mi |
| 4480 Ironwood Cir Unit 213A Bradenton, FL | 1.0 | 1.0 | 600 | $1,425 | $2.38 | 14d | 1 | 1.38mi |
| 4801 47th Ave W Bradenton, FL | 1.0–3.0 | 1.0–2.0 | 1016 | $1,810 | $1.78 | 2d | 32 | 1.46mi |
HOA detail
- Monthly dues
- $133 · $1,596/yr
Listing history 22 events
-
2026-06-18days on market $147,500 Active 157 DOM
-
2026-06-17days on market $147,500 Active 156 DOM
-
2026-06-16days on market $147,500 Active 155 DOM
-
2026-06-15days on market $147,500 Active 154 DOM
-
2026-06-13days on market $147,500 Active 152 DOM
-
2026-06-13days on market $147,500 Active 151 DOM
-
2026-06-10days on market $147,500 Active 149 DOM
-
2026-06-09days on market $147,500 Active 148 DOM
-
2026-06-08days on market $147,500 Active 147 DOM
-
2026-06-08days on market $147,500 Active 146 DOM
-
2026-06-03days on market $147,500 Active 142 DOM
-
2026-06-02days on market $147,500 Active 141 DOM
-
2026-06-01days on market $147,500 Active 140 DOM
-
2026-05-31days on market $147,500 Active 139 DOM
-
2026-03-13price $147,500
-
2026-01-28price $159,900
-
2026-01-12$169,900 Active
-
2025-06-30historical
-
2025-02-06$169,900 Active
-
2015-02-23soldstatus $55,000
-
2014-02-10soldstatus $49,500
-
1990-05-18soldstatus $15,000
ⓘ Source: listings_history table (triggers on properties + properties_extension) + one-shot
backfill from property_details.listing_events for pre-trigger history.
Tax reassessment forecast FL · Resets to sale price
- Current annual tax
- $1,739 · $145/mo
- Projected year-2 tax
- $1,739 · $145/mo
- Expected delta
- $0/yr ($0/mo · 0.0%)
ⓘ Screening estimate from a state-policy table — verify with the county assessor before closing.
Climate risk First Street
- Flood 4/10 Moderate FEMA zone X (unshaded) · 22% chance over 30 yrs
- Wildfire 3/10 Moderate
- Heat 10/10 Extreme 7 d/yr ≥106°F today · 29 d/yr by 30 yrs out
- Wind 10/10 Extreme 99% chance of damaging wind over 30 yrs
- Air quality 3/10 Moderate 2 unhealthy d/yr today · 2 by 30 yrs out
Nearby sold comps map
Loading sold comps map…
Walkable amenities ~0.75 mi
Loading nearby amenities…
Taxation est. · year 1
- Rental income
- $22,336
- − Mortgage interest
- −$8,262
- − Property taxes
- −$1,739
- − Insurance
- −$738
- − Repairs & maintenance
- −$1,787
- − Management
- −$1,787
- − HOA
- −$1,596
- − Depreciation
- −$4,291
- Taxable income
- $2,136
- Est. tax owed @ 24.0%
- −$513
- After-tax cash flow
- $3,778/yr
For passive investors: Depreciation is non-cash, so a rental often shows a tax loss while cash-flowing — sheltering income. Rental losses are passive: they offset passive income freely, and up to $25,000/yr can offset ordinary (W-2) income if you actively participate and your MAGI is under $100k (phasing out to $0 by $150k); unused losses carry forward. On sale, claimed depreciation is recaptured at up to 25%, and gains may owe capital-gains tax (a 1031 exchange can defer both). Figures are a year-1 estimate at your 24.0% rate — not tax advice; consult a CPA.
Schools (NCES district)
- District
- Manatee
- NCES district ID
- 1201230
- Math proficiency
- 54% ▼ -6.00%
- Reading proficiency
- 50% ▼ -2.00%
- Median HH income
- $49,607
- Composite
- 44.43/100
- National rank
- #2806
- State rank
- #26 of 73 in FL
Livability — Bradenton
- Score
- 81/100
- State rank
- #101
- US rank
- #1528
Category grades
Schools grade is shown separately in the Schools card above.
Census & demographics
- County
- Manatee County · 416,364 people
- City population
- 227,091
- Metro
- North Port-Sarasota-Bradenton, FL
- Population (ZIP)
- 17,682
- Household income
- $64,244
- Rent vs Own
- Severe rent burden
- 895.0
Population outlook (Manatee County) Hauer SSP2
- Today (2025)
- 447,342 people
- By 2030
- 488,911 · +9.3%
- By 2040
- 567,934 · +27.0%
- By 2050
- 637,995 · +42.6%
- By 2075
- 781,970 · +74.8%
- By 2100
- 848,272 · +89.6%
Race, ethnicity, and origin ACS 2023
- Neighborhood character
- Predominantly White (68%)
- Race & ethnicity
- White 68% Hispanic / Latino 20% Black 8% Two or more races 7% Asian 2%
- Hispanic origin (detail)
- Mexican 4% Puerto Rican 3% Cuban 7%
- Common ancestry
- Hispanic 4% Romanian 3% Lithuanian 3%
- Foreign-born
- 17% · Canada, China, Jamaica
- Languages at home
- 76% English-only · Spanish 15% French/Haitian/Cajun 4% Other Indo-European 1%
Political lean MEDSL · Manatee
- 2024 margin
- Strong R (+23.5) · D 37.9% · R 61.4%
- 2008→2024 swing
- -16.5pp toward R · 2008: -7.0pp · 2024: -23.5pp
- All cycles
- 2024: R+23.5 2020: R+16.1 2016: R+17.1 2012: R+12.5 2008: R+7.0
Not yet ingested
- Civics
- —
Market trends
- HPI YoY
- ▼ -162.68%
- Current HPI
- 246.9247
- Rent YoY
- ▼ -6.08%
- Metro
- North Port-Sarasota-Bradenton, FL
- State GDP YoY
- ▲ 3.28%
- F500 in state
- 36
Industry mix (Fortune 500 HQ in FL)
| Industry | F500 HQs | Revenue |
|---|---|---|
| Industrial Technology | 2 | $29B |
|
||
| Insurance | 2 | $17B |
|
||
| Retail | 1 | $60B |
|
||
| Technology Distribution | 1 | $58B |
|
||
| Homebuilding | 1 | $35B |
|
||
| Technology Manufacturing | 1 | $35B |
|
||
Price history
+883.3% since first listed8 events — show timeline
- 2026-03-13 Price Changed $147,500 Stellar MLS as Distributed by MLS Grid
- 2026-01-28 Price Changed $159,900 Stellar MLS as Distributed by MLS Grid
- 2026-01-12 Listed $169,900 Stellar MLS as Distributed by MLS Grid
- 2025-06-30 Listing Removed — Stellar MLS as Distributed by MLS Grid
- 2025-02-06 Listed $169,900 Stellar MLS as Distributed by MLS Grid
- 2015-02-23 Sold (Public Records) $55,000 Public Records
- 2014-02-10 Sold (Public Records) $49,500 Public Records
- 1990-05-18 Sold (Public Records) $15,000 Public Records
Property tax history
+3.4%/yrLatest (2025): $1,739 · -2.0% YoY. Source: county tax records.
Cash-flow waterfall
monthlySold comps — $/sqft
last 12 mo · ≤1 miLoading sold comps…