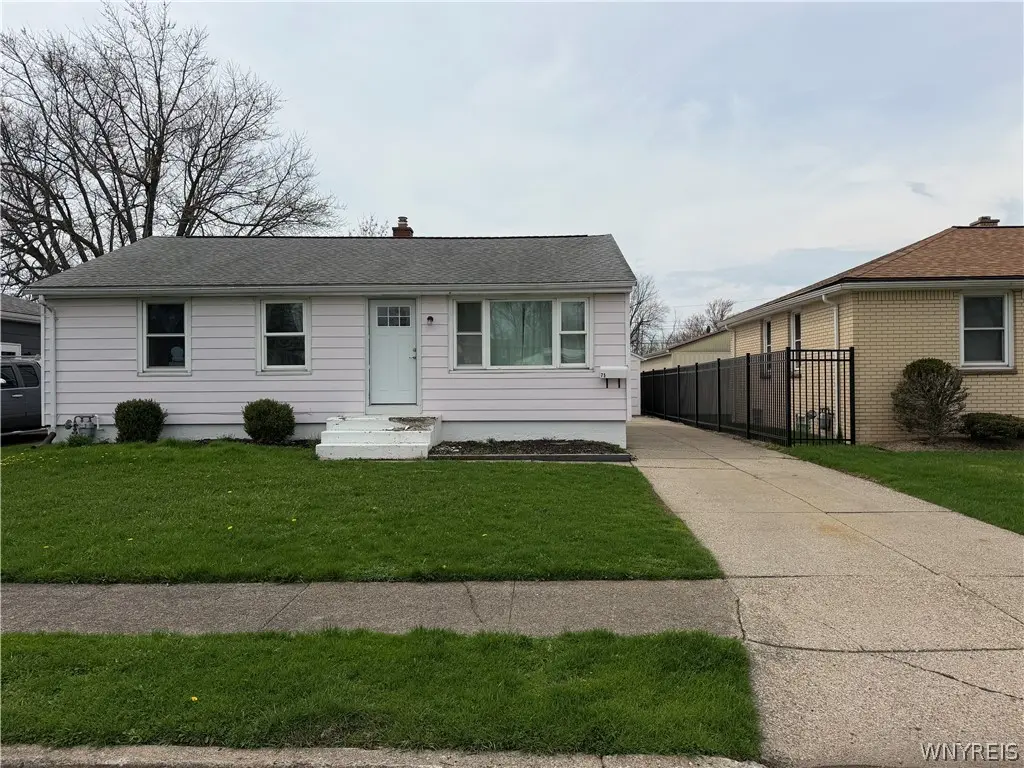
75 Saint Jude Dr · Lackawanna, NY
Flood risk 1/10 · Minimal
- FEMA flood zone
- X (unshaded)
- Chance of flooding over 30 yrs
- 0.0%
- Est. flood insurance / yr
- $473 – $860
Fire risk 1/10 · Minimal
- Est. fire insurance / yr
- $691 – $1,283
Heat risk 3/10 · Minor
- Hot days now (above 92°F)
- 7 days/yr
- Hot days in 30 yrs
- 16 days/yr
Wind risk 1/10 · Minimal
- Chance of severe wind over 30 yrs
- —
Air-quality risk 4/10 · Minor
- Unhealthy air days now
- 3 days/yr
- Unhealthy air days in 30 yrs
- 8 days/yr
Risk factors via First Street. Map © Google.
Why this score? — see what drove the D grade
The composite is a weighted blend of 9 inputs, each scored 0–100. Each bar is that input's sub-score; the figure is the points it added to the 100-point composite (weight × sub-score).
- ARV discount +15.0/15.0
- Cash flow +10.6/30.0
- Livability +3.8/5.0
- 1% rule +3.1/10.0
- DSCR +3.1/10.0
- Rent growth +2.5/5.0
- Condition / age +2.5/5.0
- Schools +2.0/10.0
- Appreciation +0.0/10.0
$189,900
🖨 Deal sheet (PDF) 📄 Offer letter ✓ Due diligence
Listing remarks
Perfect starter home! This 3-bedroom ranch features a solid foundation with a full, dry basement and a sump pump installed in 2025, complete with an annual inspection warranty for added peace of mind. Recent electrical updates provide modern convenience, while the spacious, fully fenced yard is perfect for outdoor enjoyment, pets, or entertaining. With just minor cosmetic updates needed, this home is a great opportunity to add your personal touch and build equity. Located in a highly sought-after area, it’s an ideal choice for first-time buyers or those looking to downsize. Open house for Sat & Sun 1-3 has been CANCELLED
Key facts
- Full dry basement
- Sump pump installed
- Fully fenced yard
Tags
Property features AI
Exterior
- Parking: Detached garage; Two garage spaces
- Utilities: Cable available; Public water connected; Sewer connected; Electric with circuit breakers and fuses
- Home design: Single-story home; Resale property; City street frontage; Rectangular residential lot (approx. 50 x 150)
- Construction: Aluminum and vinyl siding; Asphalt roof; Poured foundation; PEX plumbing; Existing (previously built)
- Exterior features: Concrete driveway; Partial fencing
Interior
- Kitchen: Eat-in kitchen; Solid surface counters
- Bedrooms: Three bedrooms on the main level
- Flooring: Hardwood; Laminate; Varies
- Bathrooms: One full bathroom on the main level
- Heating & cooling: Gas heating; Central air conditioning
- Interior features: Ceiling fan(s); Eat-in kitchen; Separate/formal living room; Solid surface counters; Natural woodwork; Main level primary; Full basement with sump pump
- Laundry & utility: Gas water heater
Neighborhood map
What this means for you Summary
Snapshot
- This is a 3-bed/1.0-bath single-family listed at $190k.
Deal economics
- At list price, monthly cash flow is $-94 ($-1k/yr) — negative.
- To cash-flow at today's rent, offer at most $173k (8.8% below list).
- To meet the 1% rule (rent ≥ 1% of price), the offer needs to be $155k (18.6% below list).
- Recommended offer: $155k (18.6% below list) — sets the bar for 1% rule.
Location & tenants
- Location reads 75/100 on livability (#254 in NY, #4,026 nationally) — a middle-class / working-renter tenant base. Strengths: commute A+, cost of living A+, housing A+; Watch: crime C-, employment D+, amenities F.
- Lackawanna City School District (suburban): math 19% / reading 29% proficiency, ranked #588 of 590 in NY (top 100%) — low school quality limits family demand, transient renter base, plan for 1-2y turnover; 71% free/reduced lunch — lower-income household profile, screen leases tightly.
- Zoned schools: Martin Road Elementary School (math 12% / reading 29%, grade F, #1,944 of 2,108 statewide, top 92%, 560 students, 86% FRL); Lackawanna Middle School (math 5% / reading 27%, grade F, #702 of 729 statewide, top 96%, 407 students, 80% FRL); Lackawanna High School (math 72%, 560 students, 71% FRL).
- Market conditions: 92 active listings in the ZIP; 3 comparable units currently listed for rent nearby; rentals leasing fast (median 4d on market — plan ~1-2 weeks tenant-placement turnaround); 1,244 units permitted in Erie County in 2024 (563 in 5+ unit buildings).
Forward outlook
- Local home prices are declining (-3.0%/yr); year-one equity from $1k of loan paydown is wiped out by about $6k of value loss. Plan a longer hold.
Negotiation context
- It's been on market 29 days — a 2% lower offer ($187k) is reasonable based on typical stale-listing flexibility.
- Current owner paid $80k; list at $190k implies a 137% gain — meaningful room to come down on a strong offer.
Risks & watch-outs
- Watch-outs: built in 1956 — expect roof / HVAC / electrical / plumbing capex.
Questions for the listing agent
- What do current leases actually rent for vs. the listed asking? Can we see a recent rent roll and the last 12 months of T-12 income?
- Built in 1956 — when were the roof, HVAC, electrical panel, plumbing, and water heater last replaced?
- Is there a deadline driving the sale (1031 exchange, divorce, estate, relocation)? That informs how much negotiation room exists.
- Schools are D-rated, which usually means shorter tenancies and higher turnover. Who's the typical renter profile here, and what's been the actual vacancy rate?
- The area grade is low — what's the realistic commute time and amenity access for the typical tenant pool here? Any planned neighborhood developments (good or bad) we should know about?
- What's the average days-on-market for RENTAL listings here right now (not sales)? A rising rental-DOM trend means longer vacancies and softer asking-rent achievability than the comps imply.
- What's the recent tenant-quality profile in this submarket — average credit score on applications, eviction rate, late-payment / NSF rate, and stable-employment percentage? A property-management company in the area should have these aggregated.
- How much new for-sale + rental construction is in the pipeline within 1–3 miles? Heavy new supply typically softens prices + rents 12–24 months out; constrained supply supports both.
Investment metrics
- 1% rule
- 0.81% ✗
- Cap rate
- 5.70%
- Cash-on-cash
- -2.13%
- DSCR
- 0.91
- GRM
- 10.2
CMA / ARV
- ARV (median comp)
- $253,810
- List price
- $189,900
- Delta
- -25.18%
- Verdict
- UNDERPRICED
- Comps
- 20 within 1.0 mi
Show comp detail 12 sales within ~0.75 mi
| Address | Dist | Beds/Ba | Sqft | Sold | Price | $/sf | Match |
|---|---|---|---|---|---|---|---|
| 238 Orchard Pl | 0.04mi | 3/1.0 | 1,003 (+3%) | 3mo | $220,238 | $220 | 91 |
| 92 Saint Jude Dr | 0.04mi | 3/1.0 | 972 (0%) | 10mo | $290,000 | $298 | 90 |
| 199 Orchard Pl | 0.08mi | 3/1.0 | 1,003 (+3%) | 12mo | $199,900 | $199 | 81 |
| 57 Teresa Dr | 0.29mi | 3/1.0 | 981 (+1%) | 15mo | $212,000 | $216 | 73 |
| 234 Maryknoll Dr | 0.35mi | 3/1.0 | 936 (-4%) | 18mo | $203,000 | $217 | 62 |
| 33 Teresa Dr | 0.34mi | 3/1.0 | 1,027 (+6%) | 17mo | $230,000 | $224 | 61 |
| 248 Maryknoll Dr | 0.38mi | 3/1.0 | 925 (-5%) | 18mo | $146,500 | $158 | 59 |
| 395 S Shore Blvd | 0.08mi | 2/1.0 (-1) | 1,093 (+12%) | 19mo | $200,000 | $183 | 55 |
| 125 Della Dr | 0.68mi | 2/1.0 (-1) | 999 (+3%) | 8mo | $242,000 | $242 | 52 |
| 72 Della Dr | 0.59mi | 3/1.0 | 999 (+3%) | 21mo | $191,000 | $191 | 50 |
| 41 Della Dr | 0.60mi | 3/1.0 | 1,064 (+10%) | 11mo | $225,000 | $211 | 47 |
| 4 Boardman Rd | 0.64mi | 4/1.0 (+1) | 900 (-7%) | 18mo | $225,000 | $250 | 37 |
Match score weights: distance 35% · size 25% · config 20% · recency 20%. Top-matched comps best support the ARV.
Projected returns pro-forma
-3.0% appreciation · 3.0% rent growth · sell at horizon
- IRR
- -19.8%
- Equity multiple
- 0.31×
- Total profit
- $-36,751
- Equity at exit
- $28,315
- IRR
- -12.7%
- Equity multiple
- 0.25×
- Total profit
- $-39,631
- Equity at exit
- $16,419
Cash invested: $53,172 (down + closing). Projections, not guarantees.
Landlord ↔ Tenant lean methodology
- Overall (STATE)
- 15 Strongly Tenant-Friendly
- State New York
- 15 Strongly Tenant-Friendly · D+10
- County
- — inherits STATE
- City
- — inherits STATE
ZIP-level market 14218
- Home prices YoY
- -9.2%
- Active inventory
- 92
- Price-to-rent
- 10.2×
Monthly cashflow live
- Estimated rent
- $1,547 medium interval (Pro) →
- Mortgage (P&I)
- −$996
- Tax from tax record
- −$241 /mo · $2,893/yr
- Insurance
- −$79
- HOA
- −$0
- Vacancy / Maint / Mgmt
- −$325
- Net cashflow
- $-94
Break-even live
Sensitivity live
| Price | -10% $13 | -5% $-41 | +0% $-94 | +5% $-148 | +10% $-202 |
|---|---|---|---|---|---|
| Rent | -10% $-216 | -5% $-155 | +0% $-94 | +5% $-33 | +10% $28 |
| Rate | -1.0pp $1 | -0.5pp $-46 | base $-94 | +0.5pp $-143 | +1.0pp $-194 |
UW: 25.0% down · 7.5% · 30yr · 1.5% tax · 5.0% vac · 8.0% maint · 8.0% mgmt
Financing live
Cash to close
- Down payment
- $47,475
- Closing costs
- $5,697
- Reserves months
- —
- Total cash needed
- —
Loan-product check · same deal, 3 products live
Conventional
25% down · 7.5% · 30yr
- Down + closing
- —
- Monthly P&I
- —
- Monthly cashflow
- —
- DSCR
- —
- Eligible?
- —
Personal DTI + credit; lowest rate.
DSCR
20% down · 8.5% · 30yr
- Down + closing
- —
- Monthly P&I
- —
- Monthly cashflow
- —
- DSCR
- —
- Eligible?
- —
No personal income docs; deal must DSCR.
Hard money
10% down · 12.0% · 12mo
- Down + closing
- —
- Monthly P&I
- —
- Monthly cashflow
- —
- DSCR
- —
- Eligible?
- —
Short-term bridge; refi at stabilization.
Rent comps 3 comps
| Address | Beds | Baths | Sqft | Rent | $/sqft | DOM | Units | Dist |
|---|---|---|---|---|---|---|---|---|
| 133 Orchard Pl Lackawanna, NY | 1.0–2.0 | 1.0 | 700 | $1,855 | $2.65 | 4d | 12 | 0.23mi |
| 40 Vincent Ave Unit 2 Buffalo, NY | 2.0 | 1.0 | 1075 | $875 | $0.81 | 25d | 1 | 0.70mi |
| 127 Langner Rd Buffalo, NY | 2.0 | 1.0 | 900 | $1,400 | $1.56 | 4d | 1 | 1.44mi |
Listing history 3 events
-
2026-05-18price $189,900 586-char remark
-
2026-04-29$199,900 Active 586-char remark
-
2023-05-11soldstatus $80,000
ⓘ Source: listings_history table (triggers on properties + properties_extension) + one-shot
backfill from property_details.listing_events for pre-trigger history.
Tax reassessment forecast NY · Partial reset (capped growth)
- Current annual tax
- $2,893 · $241/mo
- Projected year-2 tax
- $3,051 · $254/mo
- Expected delta
- +$158/yr (+$13/mo · 5.5%)
ⓘ Screening estimate from a state-policy table — verify with the county assessor before closing.
Climate risk First Street
- Flood 1/10 Low FEMA zone X (unshaded) · 0% chance over 30 yrs
- Wildfire 1/10 Low
- Heat 3/10 Moderate 7 d/yr ≥92°F today · 16 d/yr by 30 yrs out
- Wind 1/10 Low
- Air quality 4/10 Moderate 3 unhealthy d/yr today · 8 by 30 yrs out
Nearby sold comps map
Loading sold comps map…
Walkable amenities ~0.75 mi
Loading nearby amenities…
Taxation est. · year 1
- Rental income
- $18,558
- − Mortgage interest
- −$10,637
- − Property taxes
- −$2,893
- − Insurance
- −$950
- − Repairs & maintenance
- −$1,485
- − Management
- −$1,485
- − Depreciation
- −$5,524
- Taxable loss
- −$4,415
- Est. tax savings @ 24.0%
- +$1,060
- After-tax cash flow
- $-72/yr
For passive investors: Depreciation is non-cash, so a rental often shows a tax loss while cash-flowing — sheltering income. Rental losses are passive: they offset passive income freely, and up to $25,000/yr can offset ordinary (W-2) income if you actively participate and your MAGI is under $100k (phasing out to $0 by $150k); unused losses carry forward. On sale, claimed depreciation is recaptured at up to 25%, and gains may owe capital-gains tax (a 1031 exchange can defer both). Figures are a year-1 estimate at your 24.0% rate — not tax advice; consult a CPA.
Schools (NCES district)
- District
- Lackawanna City School District
- NCES district ID
- 3616440
- Math proficiency
- 19% ▼ -10.00%
- Reading proficiency
- 29% ▲ 3.00%
- Median HH income
- $35,041
- Composite
- 19.76/100
- National rank
- #8708
- State rank
- #588 of 590 in NY
Livability — Lackawanna
- Score
- 75/100
- State rank
- #254
- US rank
- #4026
Category grades
Schools grade is shown separately in the Schools card above.
Census & demographics
- Census place
- Lackawanna, NY
- City population
- 20,661
- Population (ZIP)
- 20,661
Population outlook (Erie County) Hauer SSP2
- Today (2025)
- 933,037 people
- By 2030
- 935,181 · +0.2%
- By 2040
- 928,531 · -0.5%
- By 2050
- 905,725 · -2.9%
- By 2075
- 834,037 · -10.6%
- By 2100
- 708,033 · -24.1%
Race, ethnicity, and origin ACS 2023
- Neighborhood character
- Predominantly White (73%)
- Race & ethnicity
- White 73% Black 13% Hispanic / Latino 10% Two or more races 5%
- Hispanic origin (detail)
- Puerto Rican 8%
- Common ancestry
- Romanian 18% Lithuanian 2% Slovak 1%
- Foreign-born
- 7% · Canada
- Languages at home
- 80% English-only · Arabic 11% Spanish 6% Russian/Polish/Slavic 1%
Political lean MEDSL · Erie
- 2024 margin
- Lean D (+9.7) · D 54.8% · R 45.2%
- 2008→2024 swing
- -7.9pp toward R · 2008: 17.5pp · 2024: 9.7pp
- All cycles
- 2024: D+9.7 2020: D+14.7 2016: D+4.8 2012: D+15.6 2008: D+17.5
Not yet ingested
- Civics
- —
Market trends
- HPI YoY
- ▼ -39.44%
- Current HPI
- 389.0188
- Rent YoY
- —
- Metro
- —
- State GDP YoY
- ▲ 2.60%
- F500 in state
- 92
Industry mix (Fortune 500 HQ in NY)
| Industry | F500 HQs | Revenue |
|---|---|---|
| Financial Services | 10 | $950B |
|
||
| Consumer Goods | 9 | $162B |
|
||
| Insurance | 4 | $225B |
|
||
| Telecommunications | 2 | $144B |
|
||
| Pharmaceuticals | 2 | $112B |
|
||
| Media / Entertainment | 2 | $69B |
|
||
Price history
+137.4% since first listed4 events — show timeline
- 2026-05-28 Pending — WNYREIS
- 2026-05-18 Price Changed $189,900 WNYREIS
- 2026-04-29 Listed $199,900 WNYREIS
- 2023-05-11 Sold (Public Records) $80,000 Public Records
Property tax history
+5.9%/yrLatest (2025): $2,893 · +5.4% YoY. Source: county tax records.
Cash-flow waterfall
monthlySold comps — $/sqft
last 12 mo · ≤1 miLoading sold comps…