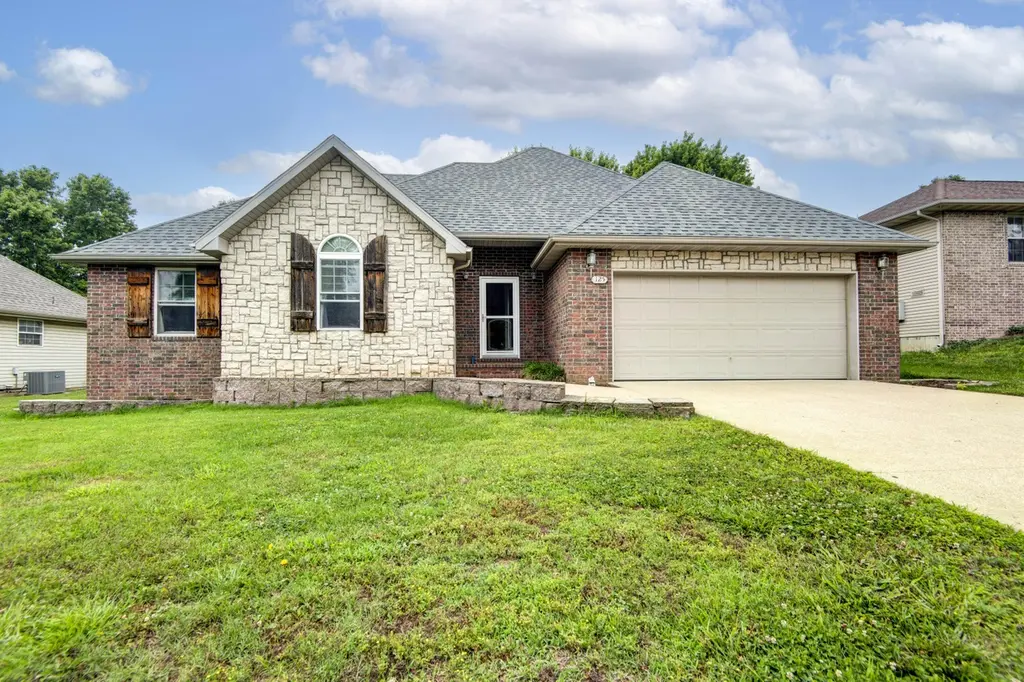
125 W Silver Oak St · Nixa, MO
Flood risk 1/10 · Minimal
- FEMA flood zone
- X (unshaded)
- Chance of flooding over 30 yrs
- 0.0%
- Est. flood insurance / yr
- $473 – $860
Fire risk 4/10 · Minor
- Est. fire insurance / yr
- $1,054 – $1,958
Heat risk 5/10 · Moderate
- Hot days now (above 104°F)
- 7 days/yr
- Hot days in 30 yrs
- 19 days/yr
Wind risk 2/10 · Minimal
- Chance of severe wind over 30 yrs
- 1.0%
Air-quality risk 1/10 · Minimal
- Unhealthy air days now
- 0 days/yr
- Unhealthy air days in 30 yrs
- 0 days/yr
Risk factors via First Street. Map © Google.
Why this score? — see what drove the D grade
The composite is a weighted blend of 9 inputs, each scored 0–100. Each bar is that input's sub-score; the figure is the points it added to the 100-point composite (weight × sub-score).
- Cash flow +11.9/30.0
- ARV discount +7.5/15.0
- Schools +5.6/10.0
- Rent growth +3.9/5.0
- Livability +3.7/5.0
- DSCR +3.5/10.0
- 1% rule +2.6/10.0
- Condition / age +2.5/5.0
- Appreciation +0.0/10.0
$259,900
🖨 Deal sheet (PDF) 📄 Offer letter ✓ Due diligence
Listing remarks
Located in the heart of Nixa! This custom-built home features an open-concept floor plan with 1,586 sq. ft. , three bedrooms, two bathrooms, and a two-car garage. The upgraded kitchen is complete with newer appliances, granite countertops, a new disposal, and a convenient pantry for all your essentials. The master suite is large enough for an extra sitting area, and the master bathroom features a tiled walk-in shower, jetted tub and large walk-in closet. There is hardwood flooring throughout the kitchen and hallways. This home offers many upgrades, including newer windows, new roof, a hot water heater, Leaf Filter, a water softener, and a heated insulated garage. Don't miss out--schedule y
Key facts
- Tiled walk-in shower
- Upgraded kitchen
- Jetted tub
Tags
Property features AI
Finance
- Other: Lot dimensions approximately 75 x 100 (0.17 acres); Located in the Walnut Creek subdivision
- HOA & community: Homeowners association with $100 annual fee
Exterior
- Parking: Driveway; Heated garage; Garage faces front; Garage door opener; 2-car garage
- Security: Smoke detector(s)
- Utilities: Public water; Public sewer; Natural gas
- Home design: Single-family residence; One story; Vinyl siding and brick exterior; Composition roof; Permanent foundation
- Construction: Vinyl siding and brick construction; Composition roof; Permanent foundation
- Exterior features: Covered patio; Deck; Rain gutters; Storm door(s); Partial fencing; Shed(s)
Interior
- Kitchen: Electric cooktop; Electric oven; Free-standing electric oven; Dishwasher; Disposal; Granite counters; Water purifier
- Flooring: Hardwood; Tile; Carpet; Brick flooring accents
- Bathrooms: 2 full bathrooms
- Heating & cooling: Forced air heating; Natural gas heating; Fireplace with gas insert in living room; Ceiling fan(s)
- Interior features: Pantry; Granite counters; Tray ceilings; High ceilings; Insulated windows with blinds and window coverings; Double-pane windows; Water softener (owned); Water purifier; Smoke detector(s)
- Laundry & utility: Main level laundry; Gas water heater
Neighborhood map
What this means for you Summary
Snapshot
- This is a 3-bed/2.0-bath other listed at $260k.
Deal economics
- At list price, monthly cash flow is $-66 ($-797/yr) — negative.
- To cash-flow at today's rent, offer at most $248k (4.5% below list).
- To meet the 1% rule (rent ≥ 1% of price), the offer needs to be $197k (24.2% below list).
- Recommended offer: $197k (24.2% below list) — sets the bar for 1% rule.
- Cap rate 6.0% vs local median 3.6% in Nixa — top-decile yield for the area; either an underpriced asset or a hidden risk that comps aren't pricing in. Stress-test before assuming the spread holds.
Location & tenants
- Location reads 74/100 on livability (#68 in MO, #4,558 nationally) — a middle-class / working-renter tenant base. Strengths: crime A+, cost of living A+, housing A+; Watch: amenities F, commute F, health & safety F.
- Nixa Public Schools (suburban): math 66% / reading 65% proficiency, ranked #6 of 324 in MO (top 2%) — acceptable for families but not a draw, mixed tenant base, ~2y average lease.
- Zoned schools: Century Elem. (math 52% / reading 52%, grade C-, #231 of 1,115 statewide, top 24%, 619 students, 30% FRL); Nixa Junior High (math 70% / reading 61%, grade A-, #3 of 391 statewide, top 1%, 1,067 students, 29% FRL); Nixa High (math 70% / reading 77%, grade B+, #6 of 521 statewide, top 1%, 1,957 students, 24% FRL) — zoned schools at 28% FRL track the district average.
- Market conditions: Rents rising fast (+5.7%/yr); 400 active listings in the ZIP; 12 comparable units currently listed for rent nearby; rentals at typical pace (median 16d on market — plan ~3-4 weeks tenant-placement turnaround); solid renter incomes; 537 units permitted in Christian County in 2024 (0 in 5+ unit buildings).
Forward outlook
- Local home prices are declining (-3.0%/yr); year-one equity from $2k of loan paydown is wiped out by about $8k of value loss. Plan a longer hold.
- Christian County population projected at +24% by 2050 — long-run rental-demand tailwind backs the buy-and-hold thesis.
Negotiation context
- Only 1 days on market — expect competitive offers; lowballing is unlikely to land.
Risks & watch-outs
- Climate carrying-cost: extreme-heat days projected 7→19/yr by 2055 (HVAC capex compounding) — expect insurance premiums to compound above CPI over the hold.
Questions for the listing agent
- What do current leases actually rent for vs. the listed asking? Can we see a recent rent roll and the last 12 months of T-12 income?
- What does the HOA fee cover, when was the last increase, and are there any pending special assessments or reserve-fund shortfalls?
- Is there a deadline driving the sale (1031 exchange, divorce, estate, relocation)? That informs how much negotiation room exists.
- Schools are B-rated — typically a magnet for longer-tenancy family renters. What's the average tenant stay here, and is there a school-zone premium baked into asking?
- The area grade is low — what's the realistic commute time and amenity access for the typical tenant pool here? Any planned neighborhood developments (good or bad) we should know about?
- What's the average days-on-market for RENTAL listings here right now (not sales)? A rising rental-DOM trend means longer vacancies and softer asking-rent achievability than the comps imply.
- What's the recent tenant-quality profile in this submarket — average credit score on applications, eviction rate, late-payment / NSF rate, and stable-employment percentage? A property-management company in the area should have these aggregated.
- How much new for-sale + rental construction is in the pipeline within 1–3 miles? Heavy new supply typically softens prices + rents 12–24 months out; constrained supply supports both.
Investment metrics
- 1% rule
- 0.76% ✗
- Cap rate
- 5.99%
- Cash-on-cash
- -1.10%
- DSCR
- 0.95
- GRM
- 11.0
CMA / ARV
No comps found within radius.
Projected returns pro-forma
-3.0% appreciation · 5.67% rent growth · sell at horizon
- IRR
- -15.5%
- Equity multiple
- 0.44×
- Total profit
- $-40,987
- Equity at exit
- $38,752
- IRR
- -3.3%
- Equity multiple
- 0.75×
- Total profit
- $-17,890
- Equity at exit
- $22,471
Cash invested: $72,772 (down + closing). Projections, not guarantees.
Landlord ↔ Tenant lean methodology
- Overall (STATE)
- 81 Strongly Landlord-Friendly
- State Missouri
- 81 Strongly Landlord-Friendly · R+10
- County
- — inherits STATE
- City
- — inherits STATE
ZIP-level market 65714
- Home prices YoY
- -25.0%
- Rents YoY
- 5.7%
- Active inventory
- 400
- Price-to-rent
- 11.0×
Monthly cashflow live
- Estimated rent
- $1,971 high interval (Pro) →
- Mortgage (P&I)
- −$1,363
- Tax from tax record
- −$144 /mo · $1,727/yr
- Insurance
- −$108
- HOA
- −$8
- Vacancy / Maint / Mgmt
- −$414
- Net cashflow
- $-66
Break-even live
Sensitivity live
| Price | -10% $81 | -5% $7 | +0% $-66 | +5% $-140 | +10% $-214 |
|---|---|---|---|---|---|
| Rent | -10% $-222 | -5% $-144 | +0% $-66 | +5% $11 | +10% $89 |
| Rate | -1.0pp $64 | -0.5pp $0 | base $-66 | +0.5pp $-134 | +1.0pp $-202 |
UW: 25.0% down · 7.5% · 30yr · 1.5% tax · 5.0% vac · 8.0% maint · 8.0% mgmt
Financing live
Cash to close
- Down payment
- $64,975
- Closing costs
- $7,797
- Reserves months
- —
- Total cash needed
- —
Loan-product check · same deal, 3 products live
Conventional
25% down · 7.5% · 30yr
- Down + closing
- —
- Monthly P&I
- —
- Monthly cashflow
- —
- DSCR
- —
- Eligible?
- —
Personal DTI + credit; lowest rate.
DSCR
20% down · 8.5% · 30yr
- Down + closing
- —
- Monthly P&I
- —
- Monthly cashflow
- —
- DSCR
- —
- Eligible?
- —
No personal income docs; deal must DSCR.
Hard money
10% down · 12.0% · 12mo
- Down + closing
- —
- Monthly P&I
- —
- Monthly cashflow
- —
- DSCR
- —
- Eligible?
- —
Short-term bridge; refi at stabilization.
Rent comps 12 comps
| Address | Beds | Baths | Sqft | Rent | $/sqft | DOM | Units | Dist |
|---|---|---|---|---|---|---|---|---|
| 640 Harrison St Unit 658 Nixa, MO | 2.0 | 2.0 | 1264 | $1,895 | $1.50 | 23d | 1 | 0.29mi |
| 922 S Pindall Ln Nixa, MO | 3.0 | 2.0 | 1608 | $2,195 | $1.37 | 15d | 1 | 0.53mi |
| 926 S Pindall Ln Nixa, MO | 4.0 | 2.0 | 1861 | $2,495 | $1.34 | 15d | 1 | 0.54mi |
| 930 S Pindall Ln Nixa, MO | 3.0 | 2.0 | 1608 | $2,195 | $1.37 | 15d | 1 | 0.55mi |
| 652 W Brook Hollow Rd Nixa, MO | 3.0 | 2.0 | 1608 | $2,195 | $1.37 | 15d | 1 | 0.70mi |
| 320 S Market St Unit 320 Nixa, MO | 3.0 | 2.0 | 1600 | $1,625 | $1.02 | 25d | 1 | 0.79mi |
| 311 S Market St Unit 311 Nixa, MO | 2.0 | 1.5 | 1113 | $1,100 | $0.99 | 25d | 1 | 0.82mi |
| 657 E Kings Carriage Blvd Nixa, MO | 3.0 | 2.0 | 1424 | $1,795 | $1.26 | 25d | 1 | 0.84mi |
| 709 E Appleridge Nixa, MO | 3.0 | 2.0 | 1535 | $1,750 | $1.14 | 25d | 1 | 0.87mi |
| 504 W Woodbine Rd Nixa, MO | 3.0 | 2.0 | 1327 | $1,625 | $1.22 | 15d | 1 | 1.15mi |
| 250 E Rosedale Rd Nixa, MO | 3.0 | 2.0 | 2250 | $2,300 | $1.02 | 15d | 1 | 1.16mi |
| 608 Cypress Ave Nixa, MO | 3.0 | 2.0 | 1364 | $1,925 | $1.41 | 15d | 1 | 1.28mi |
HOA detail
- Monthly dues
- $8 · $96/yr
- Likely covers
- water
Listing history 3 events
-
2026-05-28status Pending
-
2026-05-27$259,900 Active
-
2008-09-19soldstatus
ⓘ Source: listings_history table (triggers on properties + properties_extension) + one-shot
backfill from property_details.listing_events for pre-trigger history.
Tax reassessment forecast MO · Resets to sale price
- Current annual tax
- $1,727 · $144/mo
- Projected year-2 tax
- $2,521 · $210/mo
- Expected delta
- +$794/yr (+$66/mo · 45.9%)
ⓘ Screening estimate from a state-policy table — verify with the county assessor before closing.
Climate risk First Street
- Flood 1/10 Low FEMA zone X (unshaded) · 0% chance over 30 yrs
- Wildfire 4/10 Moderate
- Heat 5/10 Major 7 d/yr ≥104°F today · 19 d/yr by 30 yrs out
- Wind 2/10 Low 100% chance of damaging wind over 30 yrs
- Air quality 1/10 Low 0 unhealthy d/yr today · 0 by 30 yrs out
Nearby sold comps map
Loading sold comps map…
Walkable amenities ~0.75 mi
Loading nearby amenities…
Taxation est. · year 1
- Rental income
- $23,647
- − Mortgage interest
- −$14,558
- − Property taxes
- −$1,727
- − Insurance
- −$1,300
- − Repairs & maintenance
- −$1,892
- − Management
- −$1,892
- − HOA
- −$96
- − Depreciation
- −$7,561
- Taxable loss
- −$5,379
- Est. tax savings @ 24.0%
- +$1,291
- After-tax cash flow
- $494/yr
For passive investors: Depreciation is non-cash, so a rental often shows a tax loss while cash-flowing — sheltering income. Rental losses are passive: they offset passive income freely, and up to $25,000/yr can offset ordinary (W-2) income if you actively participate and your MAGI is under $100k (phasing out to $0 by $150k); unused losses carry forward. On sale, claimed depreciation is recaptured at up to 25%, and gains may owe capital-gains tax (a 1031 exchange can defer both). Figures are a year-1 estimate at your 24.0% rate — not tax advice; consult a CPA.
Schools (NCES district)
- District
- Nixa Public Schools
- NCES district ID
- 2922530
- Math proficiency
- 66% ▲ 8.00%
- Reading proficiency
- 65% ▲ 4.00%
- Median HH income
- $54,073
- Composite
- 56.04/100
- National rank
- #1186
- State rank
- #6 of 324 in MO
Livability — Nixa
- Score
- 74/100
- State rank
- #68
- US rank
- #4558
Category grades
Schools grade is shown separately in the Schools card above.
Census & demographics
- Census place
- Nixa, MO
- County
- Christian County · 70,465 people
- City population
- 37,013
- Metro
- Springfield, MO
- Population (ZIP)
- 37,013
- Household income
- $86,765
- Rent vs Own
- Severe rent burden
- 769.0
Population outlook (Christian County) Hauer SSP2
- Today (2025)
- 95,071 people
- By 2030
- 100,379 · +5.6%
- By 2040
- 109,902 · +15.6%
- By 2050
- 117,487 · +23.6%
- By 2075
- 130,738 · +37.5%
- By 2100
- 131,730 · +38.6%
Race, ethnicity, and origin ACS 2023
- Neighborhood character
- Predominantly White (89%)
- Race & ethnicity
- White 89% Two or more races 4% Hispanic / Latino 4% Asian 2% Black 1%
- Common ancestry
- Italian 3% Slovak 3% Lithuanian 2%
- Foreign-born
- 4% · Canada, Vietnam
- Languages at home
- 94% English-only · Spanish 3% Russian/Polish/Slavic 2% Vietnamese 1%
Political lean MEDSL · Christian
- 2024 margin
- Solid R (+52.2) · D 23.3% · R 75.6% · Other 1.1%
- 2008→2024 swing
- -16.4pp toward R · 2008: -35.8pp · 2024: -52.2pp
- All cycles
- 2024: R+52.2 2020: R+50.8 2016: R+54.2 2012: R+46.5 2008: R+35.8
Not yet ingested
- Civics
- —
Market trends
- HPI YoY
- ▼ -71.42%
- Current HPI
- 213.8371
- Rent YoY
- ▲ 5.67%
- Metro
- Springfield, MO
- State GDP YoY
- ▲ 1.84%
- F500 in state
- 20
Industry mix (Fortune 500 HQ in MO)
| Industry | F500 HQs | Revenue |
|---|---|---|
| Healthcare | 1 | $163B |
|
||
| Insurance | 1 | $21B |
|
||
| Industrial Technology | 1 | $17B |
|
||
| Retail | 1 | $16B |
|
||
| Industrial Distribution | 1 | $10B |
|
||
| Utilities | 1 | $9B |
|
||
Price history
3 events — show timeline
- 2026-05-28 Pending — SOMO
- 2026-05-27 Listed $259,900 SOMO
- 2008-09-19 Sold (Public Records) — Public Records
Property tax history
+3.1%/yrLatest (2025): $1,727 · +5.4% YoY. Source: county tax records.
Cash-flow waterfall
monthlySold comps — $/sqft
last 12 mo · ≤1 miLoading sold comps…