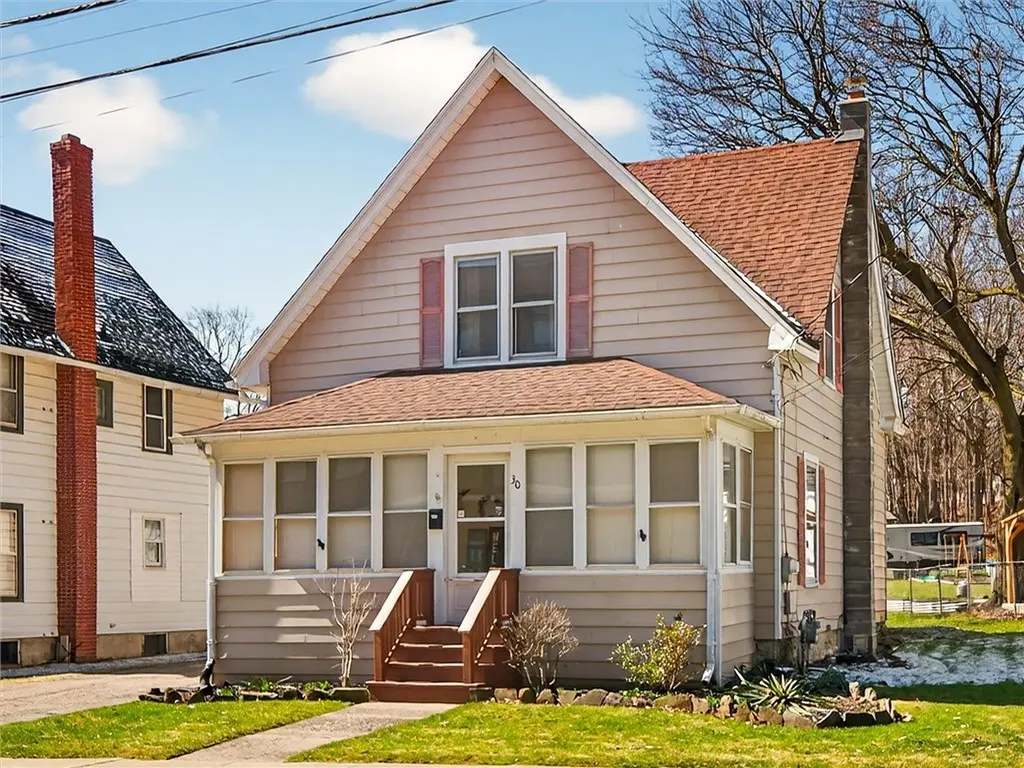
30 Elm St · Perry, NY
Flood risk 1/10 · Minimal
- FEMA flood zone
- X
- Chance of flooding over 30 yrs
- 0.0%
- Est. flood insurance / yr
- $473 – $860
Fire risk 1/10 · Minimal
- Est. fire insurance / yr
- $691 – $1,283
Heat risk 2/10 · Minimal
- Hot days now (above 93°F)
- 7 days/yr
- Hot days in 30 yrs
- 16 days/yr
Wind risk 1/10 · Minimal
- Chance of severe wind over 30 yrs
- —
Air-quality risk 1/10 · Minimal
- Unhealthy air days now
- 0 days/yr
- Unhealthy air days in 30 yrs
- 0 days/yr
Risk factors via First Street. Map © Google.
Why this score? — see what drove the B+ grade
The composite is a weighted blend of 9 inputs, each scored 0–100. Each bar is that input's sub-score; the figure is the points it added to the 100-point composite (weight × sub-score).
- Cash flow +30.0/30.0
- ARV discount +15.0/15.0
- 1% rule +10.0/10.0
- DSCR +10.0/10.0
- Schools +4.9/10.0
- Livability +3.6/5.0
- Rent growth +2.5/5.0
- Condition / age +2.5/5.0
- Appreciation +0.0/10.0
$79,900
🖨 Deal sheet 📄 Offer letter ✓ Due diligence
Listing remarks
Charming 3-Bedroom Colonial Below Assessed Value! This classic 3-bedroom, 1.5-bath colonial offers timeless character and plenty of space with 1,653 square feet of comfortable living. The main floor offers a welcoming living room with a gas fireplace, formal dining area, and an inviting kitchen with ample storage. Upstairs, you’ll find three bedrooms and a full bath. Additional conveniences include a 2-car garage, a half bath on the main level, pantry area. Set in a desirable neighborhood close to schools and shopping, this property is priced below assessed value—an excellent opportunity for homebuyers or investors looking for instant equity. Don’t miss your chance to m
Key facts
- 6,098 sq ft lot
- 2 garage spots
- Built 1920
Neighborhood map
What this means for you Summary
Snapshot
- This is a 3-bed/2.5-bath single-family listed at $80k.
Deal economics
- At list price, monthly cash flow is $438 ($5k/yr) — positive.
- The deal already cash-flows at list — no discount required.
- Meets the 1% rule at list price ($1k rent vs $80k).
- Cap rate 12.9% vs local median 4.2% in Perry — top-decile yield for the area; either an underpriced asset or a hidden risk that comps aren't pricing in. Stress-test before assuming the spread holds.
Location & tenants
- Location reads 72/100 on livability (#348 in NY) — a middle-class / working-renter tenant base. Strengths: cost of living A+, housing A+, health & safety A; Watch: employment D+, amenities F, commute F.
- Perry Central School District (rural): math 53% / reading 63% proficiency, ranked #272 of 590 in NY (top 46%) — acceptable for families but not a draw, mixed tenant base, ~2y average lease.
- Market conditions: 23 active listings in the ZIP; 83 units permitted in Wyoming County in 2024 (0 in 5+ unit buildings).
Forward outlook
- Local home prices are declining (-3.0%/yr); year-one equity from $552 of loan paydown is wiped out by about $2k of value loss. Plan a longer hold.
- Wyoming County population projected at -16% by 2050 — secular population decline; favor cash flow + early exit over multi-decade hold.
- At projected returns (-3.0% appreciation + 3.0% rent growth), your $22k cash investment doubles in ~6 years — after that, you're playing with house money.
Negotiation context
- Only 5 days on market — expect competitive offers; lowballing is unlikely to land.
- 7 sale attempts since 14y ago with the ask held roughly flat each time — persistent listings suggest the price (not the market) is what's stuck; bring a comps-based counter.
- Current owner paid $62k; 29% above their basis — modest negotiation headroom, anchor on the comps not their cost.
Risks & watch-outs
- Watch-outs: built in 1920 — expect roof / HVAC / electrical / plumbing capex.
Questions for the listing agent
- Built in 1920 — when were the roof, HVAC, electrical panel, plumbing, and water heater last replaced?
- Is there a deadline driving the sale (1031 exchange, divorce, estate, relocation)? That informs how much negotiation room exists.
- What's the average days-on-market for RENTAL listings here right now (not sales)? A rising rental-DOM trend means longer vacancies and softer asking-rent achievability than the comps imply.
- What's the recent tenant-quality profile in this submarket — average credit score on applications, eviction rate, late-payment / NSF rate, and stable-employment percentage? A property-management company in the area should have these aggregated.
- How much new for-sale + rental construction is in the pipeline within 1–3 miles? Heavy new supply typically softens prices + rents 12–24 months out; constrained supply supports both.
Investment metrics
- 1% rule
- 1.57% ✓
- Cap rate
- 12.88%
- Cash-on-cash
- 23.52%
- DSCR
- 2.05
- GRM
- 5.3
CMA / ARV
- ARV (on-the-fly)
- $142,354
- Comps found
- 11
Show comp detail 11 sales within ~0.75 mi
| Address | Dist | Beds/Ba | Sqft | Sold | Price | $/sf | Match |
|---|---|---|---|---|---|---|---|
| 45 Olin Ave | 0.30mi | 3/1.0 | 1,392 (+7%) | 11mo | $148,000 | $106 | 60 |
| 23 Hawthorne St | 0.35mi | 3/2.0 | 1,426 (+9%) | 9mo | $163,500 | $115 | 59 |
| 46 Watkins Ave | 0.32mi | 3/2.0 | 1,144 (-12%) | 6mo | $164,500 | $144 | 57 |
| 66 Water St | 0.09mi | 3/1.0 | 1,133 (-13%) | 14mo | $100,000 | $88 | 56 |
| 3 Watrous St | 0.61mi | 3/2.0 | 1,240 (-5%) | 10mo | $135,000 | $109 | 52 |
| 88 Borden Ave | 0.35mi | 3/1.5 | 1,380 (+6%) | 24mo | $110,000 | $80 | 50 |
| 88 Gardeau Rd | 0.38mi | 3/1.0 | 1,148 (-12%) | 7mo | $151,000 | $132 | 50 |
| 5 Watkins Ave | 0.49mi | 3/1.5 | 1,344 (+3%) | 22mo | $60,000 | $45 | 50 |
| 26 Bradford St | 0.70mi | 3/1.5 | 1,364 (+4%) | 12mo | $149,900 | $110 | 46 |
| 21 Benedict St | 0.22mi | 4/1.0 (+1) | 1,476 (+13%) | 15mo | $35,000 | $24 | 45 |
| 21 Orchard St | 0.68mi | 4/2.0 (+1) | 1,498 (+15%) | 12mo | $205,000 | $137 | 26 |
Match score weights: distance 35% · size 25% · config 20% · recency 20%. Top-matched comps best support the ARV.
Projected returns pro-forma
-3.0% appreciation · 3.0% rent growth · sell at horizon
- IRR
- 16.6%
- Equity multiple
- 1.67×
- Total profit
- $14,994
- Equity at exit
- $11,913
- IRR
- 25.2%
- Equity multiple
- 3.19×
- Total profit
- $49,088
- Equity at exit
- $6,908
Cash invested: $22,372 (down + closing). Projections, not guarantees.
Landlord ↔ Tenant lean methodology
- Overall (STATE)
- 15 Strongly Tenant-Friendly
- State New York
- 15 Strongly Tenant-Friendly · D+10
- County
- — inherits STATE
- City
- — inherits STATE
ZIP-level market 14530
- Home prices YoY
- -4.0%
- Active inventory
- 23
- Price-to-rent
- 5.3×
Monthly cashflow live
- Estimated rent
- $1,254 medium interval (Pro) →
- Mortgage (P&I)
- −$419
- Tax est. 1.5%
- −$100 /mo · $1,198/yr
- Insurance
- −$33
- HOA
- −$0
- Vacancy / Maint / Mgmt
- −$263
- Net cashflow
- $438
Break-even live
UW: 25.0% down · 7.5% · 30yr · 1.5% tax · 5.0% vac · 8.0% maint · 8.0% mgmt
Financing live
Cash to close
- Down payment
- $19,975
- Closing costs
- $2,397
- Reserves months
- —
- Total cash needed
- —
Loan-product check · same deal, 3 products live
Conventional
25% down · 7.5% · 30yr
- Down + closing
- —
- Monthly P&I
- —
- Monthly cashflow
- —
- DSCR
- —
- Eligible?
- —
Personal DTI + credit; lowest rate.
DSCR
20% down · 8.5% · 30yr
- Down + closing
- —
- Monthly P&I
- —
- Monthly cashflow
- —
- DSCR
- —
- Eligible?
- —
No personal income docs; deal must DSCR.
Hard money
10% down · 12.0% · 12mo
- Down + closing
- —
- Monthly P&I
- —
- Monthly cashflow
- —
- DSCR
- —
- Eligible?
- —
Short-term bridge; refi at stabilization.
Listing history 15 events
-
2026-03-30status Pending
-
2026-03-25$79,900 Active
-
2016-03-05historical
-
2015-09-04$56,900 Active
-
2015-08-14historical
-
2015-06-22price $57,000
-
2015-05-13$62,000 Active
-
2013-04-25historical
-
2012-08-19$74,900
-
2012-08-19$74,900
-
2012-08-17$74,900
-
2012-08-17historical
-
2012-06-18$82,000
-
2001-08-30soldstatus $62,000
-
1994-02-16soldstatus $35,000
ⓘ Source: listings_history table (triggers on properties + properties_extension) + one-shot
backfill from property_details.listing_events for pre-trigger history.
Climate risk First Street
- Flood 1/10 Low FEMA zone X · 0% chance over 30 yrs
- Wildfire 1/10 Low
- Heat 2/10 Low 7 d/yr ≥93°F today · 16 d/yr by 30 yrs out
- Wind 1/10 Low
- Air quality 1/10 Low 0 unhealthy d/yr today · 0 by 30 yrs out
Nearby sold comps map
Loading sold comps map…
Walkable amenities ~0.75 mi
Loading nearby amenities…
Taxation est. · year 1
- Rental income
- $15,047
- − Mortgage interest
- −$4,476
- − Property taxes
- −$1,198
- − Insurance
- −$400
- − Repairs & maintenance
- −$1,204
- − Management
- −$1,204
- − Depreciation
- −$2,324
- Taxable income
- $4,241
- Est. tax owed @ 24.0%
- −$1,018
- After-tax cash flow
- $4,243/yr
For passive investors: Depreciation is non-cash, so a rental often shows a tax loss while cash-flowing — sheltering income. Rental losses are passive: they offset passive income freely, and up to $25,000/yr can offset ordinary (W-2) income if you actively participate and your MAGI is under $100k (phasing out to $0 by $150k); unused losses carry forward. On sale, claimed depreciation is recaptured at up to 25%, and gains may owe capital-gains tax (a 1031 exchange can defer both). Figures are a year-1 estimate at your 24.0% rate — not tax advice; consult a CPA.
Schools (NCES district)
- District
- Perry Central School District
- NCES district ID
- 3622770
- Math proficiency
- 53% ▼ -7.00%
- Reading proficiency
- 63% ▲ 12.00%
- Median HH income
- $48,386
- Composite
- 49.23/100
- National rank
- #2036
- State rank
- #272 of 590 in NY
Livability — Perry
- Score
- 72/100
- State rank
- #348
- US rank
- #5898
Category grades
Schools grade is shown separately in the Schools card above.
Census & demographics
- Census place
- Perry, NY
- Population (ZIP)
- 6,396
Population outlook (Wyoming County) Hauer SSP2
- Today (2025)
- 38,976 people
- By 2030
- 37,826 · -3.0%
- By 2040
- 35,585 · -8.7%
- By 2050
- 32,841 · -15.7%
- By 2075
- 25,920 · -33.5%
- By 2100
- 19,082 · -51.0%
Race, ethnicity, and origin ACS 2023
- Neighborhood character
- Predominantly White (84%)
- Race & ethnicity
- White 84% Hispanic / Latino 8% Black 5% Two or more races 3%
- Hispanic origin (detail)
- Mexican 5% Puerto Rican 2%
- Common ancestry
- Romanian 3% Danish 3% Slovak 2%
- Foreign-born
- 4% · Canada
- Languages at home
- 96% English-only · Spanish 3% German/W. Germanic 1%
Political lean MEDSL · Wyoming
- 2024 margin
- Solid R (+48.2) · D 25.9% · R 74.1%
- 2008→2024 swing
- -22.1pp toward R · 2008: -26.1pp · 2024: -48.2pp
- All cycles
- 2024: R+48.2 2020: R+45.5 2016: R+51.0 2012: R+29.6 2008: R+26.1
Not yet ingested
- Civics
- —
Market trends
- HPI YoY
- ▼ -10.45%
- Current HPI
- 250.8251
- Rent YoY
- —
- Metro
- —
- State GDP YoY
- ▲ 2.60%
- F500 in state
- 92
Industry mix (Fortune 500 HQ in NY)
| Industry | F500 HQs | Revenue |
|---|---|---|
| Financial Services | 10 | $950B |
|
||
| Consumer Goods | 9 | $162B |
|
||
| Insurance | 4 | $225B |
|
||
| Telecommunications | 2 | $144B |
|
||
| Pharmaceuticals | 2 | $112B |
|
||
| Media / Entertainment | 2 | $69B |
|
||
Price history
+128.3% since first listed15 events — show timeline
- 2026-03-30 Pending — UNYREIS
- 2026-03-25 Listed $79,900 UNYREIS
- 2016-03-05 Listing Removed — WNYREIS
- 2015-09-04 Listed $56,900 WNYREIS
- 2015-08-14 Listing Removed — WNYREIS
- 2015-06-22 Price Changed $57,000 WNYREIS
- 2015-05-13 Listed $62,000 WNYREIS
- 2013-04-25 Listing Removed — UNYREIS
- 2012-08-19 Listed $74,900 WNYREIS
- 2012-08-19 Listed $74,900 UNYREIS
- 2012-08-17 Listing Removed — UNYREIS
- 2012-08-17 Listed $74,900 UNYREIS
- 2012-06-18 Listed $82,000 UNYREIS
- 2001-08-30 Sold (Public Records) $62,000 Public Records
- 1994-02-16 Sold (Public Records) $35,000 Public Records
Property tax history
+1.9%/yrLatest (2025): $4,218 · +2.1% YoY. Source: county tax records.
Cash-flow waterfall
monthlySold comps — $/sqft
last 12 mo · ≤1 miLoading sold comps…