 Duplex
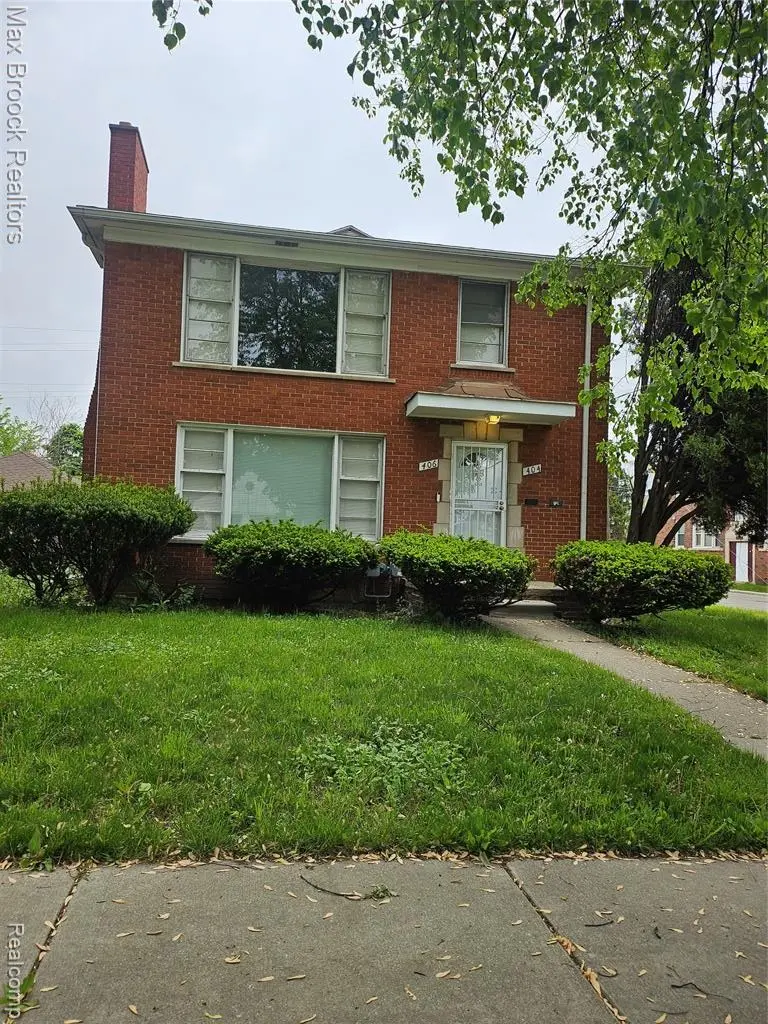
404-406 W Golden · Detroit, MI
Flood risk No data
- FEMA flood zone
- —
- Chance of flooding over 30 yrs
- —
- Est. flood insurance / yr
- —
Fire risk No data
- Est. fire insurance / yr
- —
Heat risk No data
- Hot days now (above threshold)
- —
- Hot days in 30 yrs
- —
Wind risk No data
- Chance of severe wind over 30 yrs
- —
Air-quality risk No data
- Unhealthy air days now
- —
- Unhealthy air days in 30 yrs
- —
Risk factors via First Street. Map © Google.
Why this score? — see what drove the B grade
The composite is a weighted blend of 9 inputs, each scored 0–100. Each bar is that input's sub-score; the figure is the points it added to the 100-point composite (weight × sub-score).
- Cash flow +30.0/30.0
- 1% rule +10.0/10.0
- DSCR +10.0/10.0
- ARV discount +7.5/15.0
- Appreciation +5.0/10.0
- Livability +3.7/5.0
- Condition / age +2.8/5.0
- Rent growth +2.5/5.0
- Schools +1.3/10.0
$149,900
🖨 Deal sheet 📄 Offer letter ✓ Due diligence
Multi-family units
County records classify this as Multi-Family (2-4 Unit). Listing-text estimate: 2 units. confirmed
Listing remarks
Excellent location and street all brick two family recently updated in a up and coming area. Refinished hardwood flooring in bedrooms, living room and dining room. New flooring and cabinets in the kitchen. New interior and exterior doors. fireplace in living room. home has a full basement. One car detached garage. Live in one and rent the other or an investor can rent out both units.
Key facts
- New exterior doors
- New flooring
- All brick
Tags
Property features AI
Finance
- Other: Zoned for multi-family; Lot acreage approximately 0.12
- Financial info: Net operating income reported as $0
- HOA & community: HOA details not provided
Exterior
- Parking: Parking details not provided
- Security: Security details not provided
- Utilities: Public water (at street); Public sewer (at street); Natural gas
- Home design: Multi-family property; Colonial style; 2-story structure; Built in 1956; Frontage: 50 feet
- Construction: Basement foundation; Block basement construction
- Exterior features: Brick exterior; Paved street frontage
Interior
- Kitchen: Kitchen details not provided
- Bedrooms: Total bedrooms not specified
- Flooring: Flooring details not provided
- Bathrooms: Two full bathrooms; Four total baths/lavatories
- Heating & cooling: Forced air heating; Natural gas fuel
- Interior features: Two separate units (duplex); Block basement
- Laundry & utility: Basement (laundry/utility location not specified)
Neighborhood map
What this means for you Summary
Snapshot
- This is a 2 × 3-bed/1-bath units multifamily listed at $150k. Condition is rated average.
Deal economics
- At list price, monthly cash flow is $996 ($12k/yr) — positive. Per door: $498/mo.
- The deal already cash-flows at list — no discount required.
- Meets the 1% rule at list price ($3k rent vs $150k).
- Recommended offer: $145k (3.0% below list) — sets the bar for market timing.
- Cap rate 14.3% vs local median 10.2% in Detroit — top-decile yield for the area; either an underpriced asset or a hidden risk that comps aren't pricing in. Stress-test before assuming the spread holds.
Location & tenants
- Location reads 73/100 on livability (#218 in MI) — a middle-class / working-renter tenant base. Strengths: amenities A+, commute A+, cost of living A+; Watch: schools F, crime F, employment F.
- Detroit Public Schools Community District (urban): math 10% / reading 24% proficiency, ranked #499 of 540 in MI (top 92%) — low school quality limits family demand, transient renter base, plan for 1-2y turnover; 90% free/reduced lunch — lower-income household profile, screen leases tightly.
- Market conditions: 1 active listings in the ZIP; 2,639 units permitted in Wayne County in 2024 (1,216 in 5+ unit buildings).
Forward outlook
- In year one you build about $6k of equity ($1k loan paydown + $4k appreciation (3.0% local appreciation)).
- Wayne County population projected at -17% by 2050 — secular population decline; favor cash flow + early exit over multi-decade hold.
- At projected returns (3.0% appreciation + 3.0% rent growth), your $42k cash investment doubles in ~3 years — after that, you're playing with house money.
- By year 7, paydown + projected appreciation supports a ~$35k cash-out refi (75% LTV) — recoverable capital for the next deal without selling this one.
Negotiation context
- It's been on market 36 days — a 3% lower offer ($145k) is reasonable based on typical stale-listing flexibility.
Risks & watch-outs
- Watch-outs: built in 1956 — expect roof / HVAC / electrical / plumbing capex.
Questions for the listing agent
- It's been on market 36 days. Have you received any prior offers? Is the seller open to a 3% concession, seller financing, or rate buy-down credit?
- Can we see the unit-by-unit rent roll, current vacancy, and any below-market leases? What's the average tenancy length?
- What capital expenditures (roof, boiler, parking lot, exteriors) have been made in the last 5 years, and what's planned in the next 2?
- Built in 1956 — when were the roof, HVAC, electrical panel, plumbing, and water heater last replaced?
- Is there a deadline driving the sale (1031 exchange, divorce, estate, relocation)? That informs how much negotiation room exists.
- Schools are F-rated, which usually means shorter tenancies and higher turnover. Who's the typical renter profile here, and what's been the actual vacancy rate?
- Crime grade is F in this area — have there been break-ins, vandalism, or insurance claims at this property in the last 3 years? What carrier currently insures it and at what premium?
- What's the average days-on-market for RENTAL listings here right now (not sales)? A rising rental-DOM trend means longer vacancies and softer asking-rent achievability than the comps imply.
- What's the recent tenant-quality profile in this submarket — average credit score on applications, eviction rate, late-payment / NSF rate, and stable-employment percentage? A property-management company in the area should have these aggregated.
- How much new apartment / multifamily construction is in the pipeline within 1–3 miles? Heavy new supply (>2% of stock underway) typically softens rents 12–24 months out; light construction supports rent growth.
Investment metrics
- 1% rule
- 1.72% ✓
- Cap rate
- 14.27%
- Cash-on-cash
- 28.47%
- DSCR
- 2.27
- GRM
- 4.9
CMA / ARV
- ARV (median comp)
- $70,594
- List price
- $149,900
- Delta
- 112.34%
- Verdict
- OVERPRICED
- Comps
- 11 within 1.0 mi
Projected returns pro-forma
3.0% appreciation · 3.0% rent growth · sell at horizon
- IRR
- 34.4%
- Equity multiple
- 2.94×
- Total profit
- $81,529
- Equity at exit
- $67,402
- IRR
- 34.6%
- Equity multiple
- 5.80×
- Total profit
- $201,415
- Equity at exit
- $103,874
Cash invested: $41,972 (down + closing). Projections, not guarantees.
Landlord ↔ Tenant lean methodology
- Overall (STATE)
- 62 Landlord-Friendly
- State Michigan
- 62 Landlord-Friendly · EVEN
- County
- — inherits STATE
- City
- — inherits STATE
ZIP-level market 48203 1958
- Active inventory
- 1
- Price-to-rent
- 9.7×
Monthly cashflow live
- Estimated rent
- $2,572 high interval (Pro) →
- Mortgage (P&I)
- −$786
- Tax est. 1.5%
- −$187 /mo · $2,248/yr
- Insurance
- −$62
- HOA
- −$0
- Vacancy / Maint / Mgmt
- −$540
- Net cashflow
- $996
Break-even live
2-unit breakdown (identical units grouped — click to expand)
| Units | Beds | Baths | Est. rent |
|---|---|---|---|
| 2× units | 3 | 1 | $2,572 |
| #1 | 3 | 1 | $1,286 |
| #2 | 3 | 1 | $1,286 |
| Total (2 units) | $2,572 | ||
UW: 25.0% down · 7.5% · 30yr · 1.5% tax · 5.0% vac · 8.0% maint · 8.0% mgmt
Financing live
Cash to close
- Down payment
- $37,475
- Closing costs
- $4,497
- Reserves months
- —
- Total cash needed
- —
Loan-product check · same deal, 3 products live
Conventional
25% down · 7.5% · 30yr
- Down + closing
- —
- Monthly P&I
- —
- Monthly cashflow
- —
- DSCR
- —
- Eligible?
- —
Personal DTI + credit; lowest rate.
DSCR
20% down · 8.5% · 30yr
- Down + closing
- —
- Monthly P&I
- —
- Monthly cashflow
- —
- DSCR
- —
- Eligible?
- —
No personal income docs; deal must DSCR.
Hard money
10% down · 12.0% · 12mo
- Down + closing
- —
- Monthly P&I
- —
- Monthly cashflow
- —
- DSCR
- —
- Eligible?
- —
Short-term bridge; refi at stabilization.
Listing history 14 events
-
2026-06-18days on market $149,900 Active 36 DOM
-
2026-06-17days on market $149,900 Active 35 DOM
-
2026-06-15days on market $149,900 Active 33 DOM
-
2026-06-13days on market $149,900 Active 31 DOM
-
2026-06-13days on market $149,900 Active 30 DOM
-
2026-06-09days on market $149,900 Active 27 DOM
-
2026-06-08days on market $149,900 Active 26 DOM
-
2026-06-07days on market $149,900 Active 25 DOM
-
2026-06-04days on market $149,900 Active 22 DOM
-
2026-06-03days on market $149,900 Active 21 DOM
-
2026-06-02days on market $149,900 Active 20 DOM
-
2026-06-01days on market $149,900 Active 19 DOM
-
2026-05-31days on market $149,900 Active 18 DOM
-
2026-05-13$149,900 Active 386-char remark
ⓘ Source: listings_history table (triggers on properties + properties_extension) + one-shot
backfill from property_details.listing_events for pre-trigger history.
Nearby sold comps map
Loading sold comps map…
Walkable amenities ~0.75 mi
Loading nearby amenities…
Taxation est. · year 1
- Rental income
- $30,864
- − Mortgage interest
- −$8,397
- − Property taxes
- −$2,248
- − Insurance
- −$750
- − Repairs & maintenance
- −$2,469
- − Management
- −$2,469
- − Depreciation
- −$4,361
- Taxable income
- $10,170
- Est. tax owed @ 24.0%
- −$2,441
- After-tax cash flow
- $9,511/yr
For passive investors: Depreciation is non-cash, so a rental often shows a tax loss while cash-flowing — sheltering income. Rental losses are passive: they offset passive income freely, and up to $25,000/yr can offset ordinary (W-2) income if you actively participate and your MAGI is under $100k (phasing out to $0 by $150k); unused losses carry forward. On sale, claimed depreciation is recaptured at up to 25%, and gains may owe capital-gains tax (a 1031 exchange can defer both). Figures are a year-1 estimate at your 24.0% rate — not tax advice; consult a CPA.
Condition & rehab AI · 6 photos
A two-family home in average condition with moderate rehab needs, offering potential for value increase through exterior and interior painting.
Repairs flagged
- Minor Exterior paint — Some discoloration visible
- Minor Interior paint — Some discoloration visible
Value-add opportunities
- Both Paint exterior — Enhances curb appeal and value
- Both Paint interior — Enhances interior appearance and value
Renovation cost estimate screening
| Repair item | Severity | Est. cost |
|---|---|---|
| Exterior paint · Some discoloration visible | Minor | $500–3,000 |
| Interior paint · Some discoloration visible | Minor | $500–3,000 |
| Total estimated repair cost · 2 items | $1,000–6,000 |
Value-add ROI direction
- Both Paint exterior — Enhances curb appeal and value ↑
- Both Paint interior — Enhances interior appearance and value ↑
ⓘ Cost ranges are severity-bucket heuristics (US national rule-of-thumb). Get contractor quotes + a written scope before underwriting a rehab budget.
Schools (NCES district)
- District
- Detroit Public Schools Community District
- NCES district ID
- 2601103
- Math proficiency
- 10% ▼ -2.00%
- Reading proficiency
- 24% ▲ 6.00%
- Median HH income
- $25,815
- Composite
- 13.06/100
- National rank
- #9564
- State rank
- #499 of 540 in MI
Livability — Detroit
- Score
- 73/100
- State rank
- #218
- US rank
- #5427
Category grades
Schools grade is shown separately in the Schools card above.
Census & demographics
- Census place
- Detroit, MI
Population outlook (Wayne County) Hauer SSP2
- Today (2025)
- 1,675,273 people
- By 2030
- 1,620,300 · -3.3%
- By 2040
- 1,502,341 · -10.3%
- By 2050
- 1,384,039 · -17.4%
- By 2075
- 1,124,592 · -32.9%
- By 2100
- 881,193 · -47.4%
Not yet ingested
- Political lean
- —
- Race & ethnicity
- —
- Common origin
- —
- Civics
- —
Market trends
- HPI YoY
- —
- Current HPI
- —
- Rent YoY
- —
- Metro
- —
- State GDP YoY
- ▲ 1.37%
- F500 in state
- 28
Industry mix (Fortune 500 HQ in MI)
| Industry | F500 HQs | Revenue |
|---|---|---|
| Automotive Parts | 3 | $48B |
|
||
| Automotive | 2 | $372B |
|
||
| Chemicals | 1 | $45B |
|
||
| Automotive Retail | 1 | $29B |
|
||
| Healthcare / Medical Devices | 1 | $23B |
|
||
| Automotive Technology | 1 | $20B |
|
||
Price history
1 event — show timeline
- 2026-05-13 Listed $149,900 MiRealSource-MiMLS
Cash-flow waterfall
monthlySold comps — $/sqft
last 12 mo · ≤1 miLoading sold comps…