 🏢 Co-op
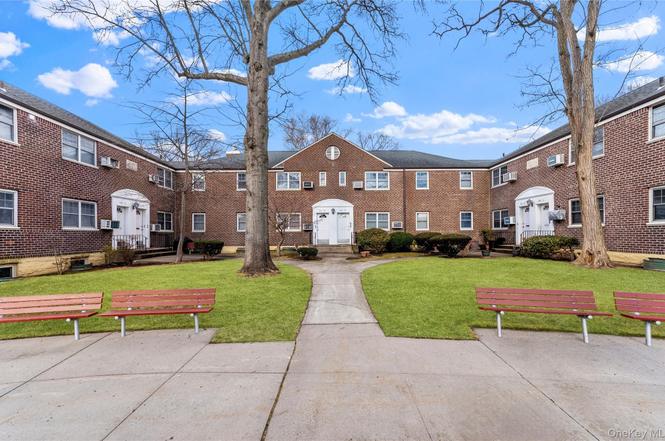
255-25 61st Ave Unit 3-881 · New York, NY
Flood risk 1/10 · Minimal
- FEMA flood zone
- X (unshaded)
- Chance of flooding over 30 yrs
- 0.0%
- Est. flood insurance / yr
- $507 – $1,088
Fire risk 3/10 · Minor
- Est. fire insurance / yr
- $691 – $1,283
Heat risk 6/10 · Moderate
- Hot days now (above 97°F)
- 7 days/yr
- Hot days in 30 yrs
- 15 days/yr
Wind risk 6/10 · Moderate
- Chance of severe wind over 30 yrs
- 27.0%
Air-quality risk 4/10 · Minor
- Unhealthy air days now
- 6 days/yr
- Unhealthy air days in 30 yrs
- 7 days/yr
Risk factors via First Street. Map © Google.
Why this score? — see what drove the D- grade
The composite is a weighted blend of 9 inputs, each scored 0–100. Each bar is that input's sub-score; the figure is the points it added to the 100-point composite (weight × sub-score).
- Cash flow +11.6/30.0
- ARV discount +7.5/15.0
- Schools +5.0/10.0
- Livability +3.8/5.0
- 1% rule +3.4/10.0
- DSCR +3.4/10.0
- Rent growth +2.5/5.0
- Condition / age +2.5/5.0
- Appreciation +0.0/10.0
$448,000
🖨 Deal sheet 📄 Offer letter ✓ Due diligence
Listing remarks
Rare True 3 Bedroom Lower Corner Unit with Separate Dining Room Located in a Beautiful Tree Lined Courtyard. This Highly Sought After South Facing, Bright & Sunny Co-op Unit Features Renovated Kitchen with Plenty of Cabinetry, Including Corner Cabinets, Corian-Edged Countertops, Tiled Flooring, Stainless Steel Appliances, with Ultra Convenient In-Unit Washing Machine & Dishwasher. 3 Full Sized Bedrooms with Plenty of Closets, Including Additional Built out Closets in Both Primary Bedroom & 3rd Bedroom. Two Corner Windows in 2 Bedrooms. Separate Tiled Dining Room with Modern Lighting Fixture, which Flows into Large Living Room. Tiled Bathroom with Glass Shower Doors. Additi
Key facts
- Lower corner unit
- Separate dining room
- Renovated kitchen
Tags
Neighborhood map
What this means for you Summary
Snapshot
- This is a 3-bed/1.0-bath condo listed at $448k.
Deal economics
- At list price, monthly cash flow is $-139 ($-2k/yr) — negative.
- To cash-flow at today's rent, offer at most $428k (4.5% below list).
- To meet the 1% rule (rent ≥ 1% of price), the offer needs to be $374k (16.5% below list).
- Recommended offer: $374k (16.5% below list) — sets the bar for 1% rule.
- Cap rate 5.9% vs local median 2.6% in New York — top-decile yield for the area; either an underpriced asset or a hidden risk that comps aren't pricing in. Stress-test before assuming the spread holds.
Location & tenants
- Location reads 75/100 on livability (#268 in NY, #4,188 nationally) — a middle-class / working-renter tenant base. Strengths: amenities A+, commute A+, health & safety A; Watch: crime F, cost of living F.
- Market conditions: 162 active listings in the ZIP; 16 comparable units currently listed for rent nearby; rentals at typical pace (median 19d on market — plan ~3-4 weeks tenant-placement turnaround); high-income renter base; 5,302 units permitted in Queens County in 2024 (4,918 in 5+ unit buildings).
- This rent runs 37% of the median local income ($122k/yr) — at the standard rent-burdened threshold; future hikes will face affordability resistance.
Forward outlook
- Local home prices are declining (-3.0%/yr); year-one equity from $3k of loan paydown is wiped out by about $13k of value loss. Plan a longer hold.
- Queens County population projected at +16% by 2050 — long-run rental-demand tailwind backs the buy-and-hold thesis.
Negotiation context
- It's been on market 39 days — a 3% lower offer ($435k) is reasonable based on typical stale-listing flexibility.
Risks & watch-outs
- Watch-outs: built in 1953 — expect roof / HVAC / electrical / plumbing capex.
- Climate carrying-cost: major wind risk, 27% chance of damaging wind over 30y; extreme-heat days projected 7→15/yr by 2055 (HVAC capex compounding) — expect insurance premiums to compound above CPI over the hold.
Questions for the listing agent
- What do current leases actually rent for vs. the listed asking? Can we see a recent rent roll and the last 12 months of T-12 income?
- It's been on market 39 days. Have you received any prior offers? Is the seller open to a 16% concession, seller financing, or rate buy-down credit?
- Built in 1953 — when were the roof, HVAC, electrical panel, plumbing, and water heater last replaced?
- Any open or pending special assessments — roof, HVAC, plumbing, elevator, façade? What's the per-unit balance and payoff schedule, and is the seller paying it off at close or rolling it to the buyer?
- Is there a deadline driving the sale (1031 exchange, divorce, estate, relocation)? That informs how much negotiation room exists.
- Schools are B-rated — typically a magnet for longer-tenancy family renters. What's the average tenant stay here, and is there a school-zone premium baked into asking?
- Crime grade is F in this area — have there been break-ins, vandalism, or insurance claims at this property in the last 3 years? What carrier currently insures it and at what premium?
- The area grade is low — what's the realistic commute time and amenity access for the typical tenant pool here? Any planned neighborhood developments (good or bad) we should know about?
- What's the average days-on-market for RENTAL listings here right now (not sales)? A rising rental-DOM trend means longer vacancies and softer asking-rent achievability than the comps imply.
- What's the recent tenant-quality profile in this submarket — average credit score on applications, eviction rate, late-payment / NSF rate, and stable-employment percentage? A property-management company in the area should have these aggregated.
- How much new apartment / multifamily construction is in the pipeline within 1–3 miles? Heavy new supply (>2% of stock underway) typically softens rents 12–24 months out; light construction supports rent growth.
Investment metrics
- 1% rule
- 0.84% ✗
- Cap rate
- 5.92%
- Cash-on-cash
- -1.33%
- DSCR
- 0.94
- GRM
- 10.0
CMA / ARV
No comps found within radius.
Projected returns pro-forma
-3.0% appreciation · 3.0% rent growth · sell at horizon
- IRR
- -18.5%
- Equity multiple
- 0.35×
- Total profit
- $-81,417
- Equity at exit
- $66,798
- IRR
- -10.8%
- Equity multiple
- 0.35×
- Total profit
- $-82,099
- Equity at exit
- $38,735
Cash invested: $125,440 (down + closing). Projections, not guarantees.
Landlord ↔ Tenant lean methodology
- Overall (CITY)
- 0 Strongly Tenant-Friendly
- State New York
- 15 Strongly Tenant-Friendly · D+10
- County
- — inherits STATE
- City New York
- 0 Strongly Tenant-Friendly · D+34
ZIP-level market 11362
- Home prices YoY
- -31.1%
- Active inventory
- 162
- Price-to-rent
- 10.0×
Monthly cashflow live
- Estimated rent
- $3,743 high interval (Pro) →
- Mortgage (P&I)
- −$2,349
- Tax est. 1.5%
- −$560 /mo · $6,720/yr
- Insurance
- −$187
- HOA
- −$0
- Vacancy / Maint / Mgmt
- −$786
- Net cashflow
- $-139
Break-even live
UW: 25.0% down · 7.5% · 30yr · 1.5% tax · 5.0% vac · 8.0% maint · 8.0% mgmt
Financing live
Cash to close
- Down payment
- $112,000
- Closing costs
- $13,440
- Reserves months
- —
- Total cash needed
- —
Loan-product check · same deal, 3 products live
Conventional
25% down · 7.5% · 30yr
- Down + closing
- —
- Monthly P&I
- —
- Monthly cashflow
- —
- DSCR
- —
- Eligible?
- —
Personal DTI + credit; lowest rate.
DSCR
20% down · 8.5% · 30yr
- Down + closing
- —
- Monthly P&I
- —
- Monthly cashflow
- —
- DSCR
- —
- Eligible?
- —
No personal income docs; deal must DSCR.
Hard money
10% down · 12.0% · 12mo
- Down + closing
- —
- Monthly P&I
- —
- Monthly cashflow
- —
- DSCR
- —
- Eligible?
- —
Short-term bridge; refi at stabilization.
Rent comps 16 comps
| Address | Beds | Baths | Sqft | Rent | $/sqft | DOM | Units | Dist |
|---|---|---|---|---|---|---|---|---|
| 253-15 60th Ave Unit 2nd Floor Flushing, NY | 3.0 | 2.0 | 1100 | $3,500 | $3.18 | 3d | 1 | 0.18mi |
| 5804 264th St Little Neck, NY | 3.0 | 2.0 | 1196 | $4,700 | $3.93 | 10d | 1 | 0.28mi |
| 5710 253rd St Little Neck, NY | 3.0 | 1.0 | 1236 | $3,400 | $2.75 | 1d | 1 | 0.31mi |
| 6923 Little Neck Pkwy Glen Oaks, NY | 3.0 | 2.0 | 1300 | $3,250 | $2.50 | 11d | 1 | 0.42mi |
| 245-63 61st Ave Unit 1FL Flushing, NY | 3.0 | 2.0 | 1000 | $3,000 | $3.00 | 24d | 1 | 0.46mi |
| 240-53 68th Ave Unit 1st Floor Douglaston, NY | 2.0 | 1.0 | 900 | $2,500 | $2.78 | 24d | 1 | 0.92mi |
| 7608 269th St New Hyde Park, NY | 3.0 | 2.0 | 1031 | $4,500 | $4.36 | 1d | 1 | 0.94mi |
| 4623 Arcadia Ln Great Neck, NY | 3.0 | 1.0 | 1480 | $4,700 | $3.18 | 43d | 1 | 1.06mi |
| 245-24 77th Cres Jamaica, NY | 2.0 | 1.0 | 785 | $2,600 | $3.31 | 19d | 1 | 1.10mi |
| 246-17 Union Tpke Unit A Bellerose, NY | 3.0 | 1.0 | 799 | $3,200 | $4.01 | 24d | 1 | 1.16mi |
| 4245 247th St Little Neck, NY | 3.0 | 1.0 | 1080 | $3,800 | $3.52 | 24d | 1 | 1.19mi |
| 4141 Little Neck Pkwy #3 Little Neck, NY | 2.0 | 2.0 | 1350 | $3,000 | $2.22 | 24d | 1 | 1.24mi |
| 4420 Douglaston Pkwy Unit 5A Little Neck, NY | 2.0 | 1.0 | 900 | $3,100 | $3.44 | 4d | 1 | 1.28mi |
| 8111 261st St Glen Oaks, NY | 4.0 | 3.0 | 1182 | $4,200 | $3.55 | 10d | 1 | 1.33mi |
| 232-15 67th Ave Unit 1FL Flushing, NY | 2.0 | 2.0 | 900 | $2,900 | $3.22 | 4d | 1 | 1.35mi |
| 48 79th Ave New Hyde Park, NY | 3.0 | 2.0 | 1109 | $4,500 | $4.06 | 43d | 1 | 1.35mi |
HOA detail condo
- Monthly dues
- $0 · $0/yr
- Assessments
- None detected in remarks — confirm with the listing agent.
Listing history 2 events
-
2026-02-19status Pending
-
2026-01-06$448,000 Active
ⓘ Source: listings_history table (triggers on properties + properties_extension) + one-shot
backfill from property_details.listing_events for pre-trigger history.
Climate risk First Street
- Flood 1/10 Low FEMA zone X (unshaded) · 0% chance over 30 yrs
- Wildfire 3/10 Moderate
- Heat 6/10 Major 7 d/yr ≥97°F today · 15 d/yr by 30 yrs out
- Wind 6/10 Major 27% chance of damaging wind over 30 yrs
- Air quality 4/10 Moderate 6 unhealthy d/yr today · 7 by 30 yrs out
Nearby sold comps map
Loading sold comps map…
Walkable amenities ~0.75 mi
Loading nearby amenities…
Taxation est. · year 1
- Rental income
- $44,911
- − Mortgage interest
- −$25,095
- − Property taxes
- −$6,720
- − Insurance
- −$2,240
- − Repairs & maintenance
- −$3,593
- − Management
- −$3,593
- − Depreciation
- −$13,033
- Taxable loss
- −$9,363
- Est. tax savings @ 24.0%
- +$2,247
- After-tax cash flow
- $574/yr
For passive investors: Depreciation is non-cash, so a rental often shows a tax loss while cash-flowing — sheltering income. Rental losses are passive: they offset passive income freely, and up to $25,000/yr can offset ordinary (W-2) income if you actively participate and your MAGI is under $100k (phasing out to $0 by $150k); unused losses carry forward. On sale, claimed depreciation is recaptured at up to 25%, and gains may owe capital-gains tax (a 1031 exchange can defer both). Figures are a year-1 estimate at your 24.0% rate — not tax advice; consult a CPA.
Schools (NCES district)
No district data.
Livability — New York
- Score
- 75/100
- State rank
- #268
- US rank
- #4188
Category grades
Schools grade is shown separately in the Schools card above.
Census & demographics
- Census place
- New York, NY
- County
- Queens County · 1,914,869 people
- City population
- 7,731,280
- Metro
- New York-Newark-Jersey City, NY-NJ-PA
- Population (ZIP)
- 18,492
- Household income
- $122,090
- Rent vs Own
- Severe rent burden
- 250.0
Population outlook (Queens County) Hauer SSP2
- Today (2025)
- 2,546,320 people
- By 2030
- 2,643,059 · +3.8%
- By 2040
- 2,815,563 · +10.6%
- By 2050
- 2,944,423 · +15.6%
- By 2075
- 3,123,338 · +22.7%
- By 2100
- 3,098,688 · +21.7%
Race, ethnicity, and origin ACS 2023
- Neighborhood character
- Diverse neighborhood (Simpson 0.62)
- Race & ethnicity
- Asian 48% White 37% Hispanic / Latino 9% Two or more races 5% Black 3%
- Hispanic origin (detail)
- Puerto Rican 3% Dominican 1%
- Common ancestry
- Romanian 4% Hispanic 1% Scotch-Irish 1%
- Foreign-born
- 40% · China, South Korea, Canada
- Languages at home
- 47% English-only · Chinese 21% Korean 12% Other Indo-European 9%
Political lean MEDSL · Queens
- 2024 margin
- Strong D (+24.6) · D 62.3% · R 37.7%
- 2008→2024 swing
- -26.2pp toward R · 2008: 50.8pp · 2024: 24.6pp
- All cycles
- 2024: D+24.6 2020: D+45.2 2016: D+53.4 2012: D+58.5 2008: D+50.8
Not yet ingested
- Civics
- —
Market trends
- HPI YoY
- ▼ -117.12%
- Current HPI
- 259.773
- Rent YoY
- —
- Metro
- New York-Newark-Jersey City, NY-NJ-PA
- State GDP YoY
- ▲ 2.60%
- F500 in state
- 92
Industry mix (Fortune 500 HQ in NY)
| Industry | F500 HQs | Revenue |
|---|---|---|
| Financial Services | 10 | $950B |
|
||
| Consumer Goods | 9 | $162B |
|
||
| Insurance | 4 | $225B |
|
||
| Telecommunications | 2 | $144B |
|
||
| Pharmaceuticals | 2 | $112B |
|
||
| Media / Entertainment | 2 | $69B |
|
||
Price history
2 events — show timeline
- 2026-02-19 Pending — OneKey® MLS as Distributed by MLS Grid
- 2026-01-06 Listed $448,000 OneKey® MLS as Distributed by MLS Grid
Cash-flow waterfall
monthlySold comps — $/sqft
last 12 mo · ≤1 miLoading sold comps…