 🌊 Lakefront
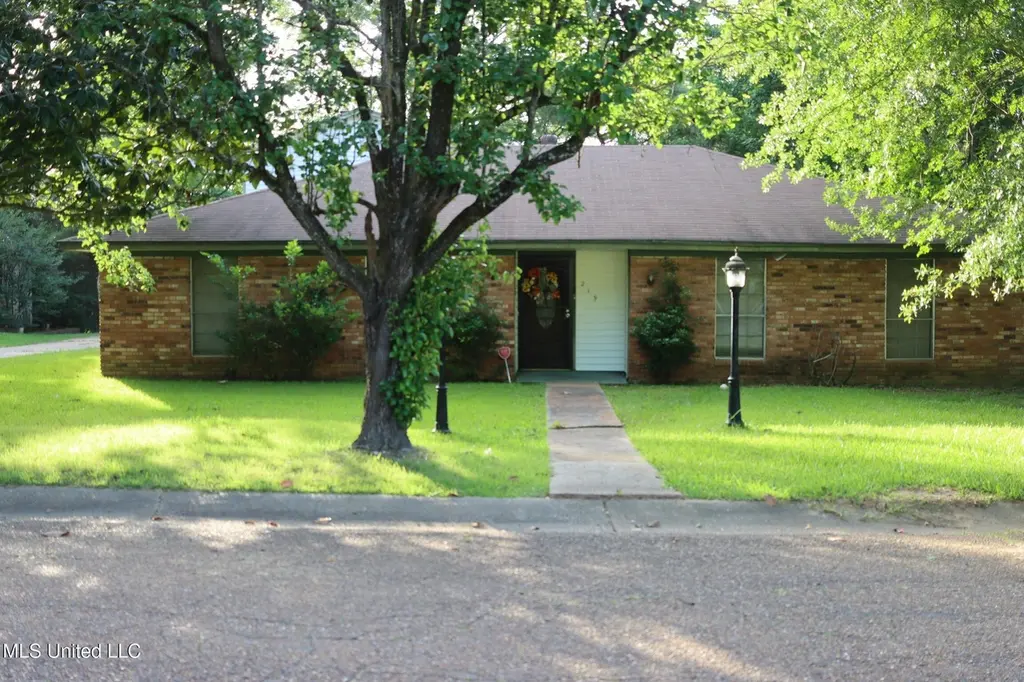
219 Lake Cove Dr · Jackson, MS
Flood risk 1/10 · Minimal
- FEMA flood zone
- X (unshaded)
- Chance of flooding over 30 yrs
- 0.0%
- Est. flood insurance / yr
- $507 – $1,088
Fire risk 3/10 · Minor
- Est. fire insurance / yr
- $1,241 – $2,305
Heat risk 7/10 · Major
- Hot days now (above 108°F)
- 7 days/yr
- Hot days in 30 yrs
- 20 days/yr
Wind risk 8/10 · Major
- Chance of severe wind over 30 yrs
- 80.0%
Air-quality risk 1/10 · Minimal
- Unhealthy air days now
- 0 days/yr
- Unhealthy air days in 30 yrs
- 0 days/yr
Risk factors via First Street. Map © Google.
Why this score? — see what drove the C+ grade
The composite is a weighted blend of 9 inputs, each scored 0–100. Each bar is that input's sub-score; the figure is the points it added to the 100-point composite (weight × sub-score).
- Cash flow +21.4/30.0
- ARV discount +14.4/15.0
- 1% rule +6.9/10.0
- DSCR +6.8/10.0
- Rent growth +3.6/5.0
- Livability +3.4/5.0
- Condition / age +2.5/5.0
- Schools +1.1/10.0
- Appreciation +0.0/10.0
$137,000
🖨 Deal sheet 📄 Offer letter ✓ Due diligence
Listing remarks
Andriana Branch Spacious two-story home presenting an excellent value-add opportunity for investors or buyers ready to renovate and make it their own. The layout includes two primary bedrooms, two additional guest bedrooms, and three full bathrooms, offering flexibility for updates and redesign. The backyard features an in-ground pool and ample outdoor space with strong potential to shine after improvements. The property is being sold as-is and will require repairs, making it well-suited for those looking to build equity or expand an investment portfolio.
Key facts
- 0.3 acre lot
- Parking
- Pool
Property features AI
Exterior
- Parking: Attached carport; Driveway; 1 carport space
- Utilities: Public water; Public sewer; Electricity connected; Natural gas available
- Home design: Single family house; Two levels
- Construction: Brick construction; Shingle roof; Slab foundation; Built in (year source: assessor)
- Exterior features: Private in-ground pool with pool cover; Balcony; Private yard
Interior
- Kitchen: Dishwasher; Refrigerator
- Bedrooms: Primary bedroom (lower level); Additional bedrooms (lower level)
- Bathrooms: 3 bathrooms (including primary bathroom on lower level)
- Heating & cooling: Natural gas heating; Central air conditioning
- Interior features: Fireplace in living room and primary bedroom; Total of 11 rooms
- Laundry & utility: Laundry room (lower level)
Neighborhood map
What this means for you Summary
Snapshot
- This is a 4-bed/3.0-bath single-family listed at $137k.
Deal economics
- At list price, monthly cash flow is $204 ($2k/yr) — positive.
- The deal already cash-flows at list — no discount required.
- Meets the 1% rule at list price ($2k rent vs $137k).
- Recommended offer: $135k (1.5% below list) — sets the bar for market timing.
Location & tenants
- Location reads 68/100 on livability (#66 in MS) — a middle-class / working-renter tenant base. Strengths: commute A+, cost of living A+, housing A+; Watch: amenities F, employment F, health & safety F.
- Jackson Public School District (urban): math 9% / reading 18% proficiency, ranked #112 of 130 in MS (top 86%) — low school quality limits family demand, transient renter base, plan for 1-2y turnover; 88% free/reduced lunch — lower-income household profile, screen leases tightly.
- Zoned schools: Timberlawn Elementary School (math 5% / reading 11%, grade F, #334 of 375 statewide, top 89%, 353 students, 100% FRL); Forest Hill High School (math 5% / reading 15%, grade F, #168 of 197 statewide, top 86%, 991 students, 100% FRL).
- Market conditions: Rents rising fast (+4.2%/yr); 302 active listings in the ZIP; 1 comparable units currently listed for rent nearby; 167 units permitted in Hinds County in 2024 (0 in 5+ unit buildings).
- This rent runs 39% of the median local income ($51k/yr) — at the standard rent-burdened threshold; future hikes will face affordability resistance.
Forward outlook
- Local home prices are declining (-3.0%/yr); year-one equity from $947 of loan paydown is wiped out by about $4k of value loss. Plan a longer hold.
- Hinds County population projected to shrink 6% by 2050 — rents likely to lag national; underwrite the cash flow, not the appreciation.
Negotiation context
- It's been on market 15 days — a 2% lower offer ($135k) is reasonable based on typical stale-listing flexibility.
- 4 sale attempts since 2y ago with the ask held roughly flat each time — persistent listings suggest the price (not the market) is what's stuck; bring a comps-based counter.
Risks & watch-outs
- Watch-outs: property tax is 2.7% of price.
- Climate carrying-cost: severe wind risk, 80% chance of damaging wind over 30y; extreme-heat days projected 7→20/yr by 2055 (HVAC capex compounding) — expect insurance premiums to compound above CPI over the hold.
Questions for the listing agent
- Built in 1973 — when were the roof, HVAC, electrical panel, plumbing, and water heater last replaced?
- Property tax is high relative to price — has the assessment been appealed recently, and will the sale trigger a re-assessment?
- Is there a deadline driving the sale (1031 exchange, divorce, estate, relocation)? That informs how much negotiation room exists.
- Schools are F-rated, which usually means shorter tenancies and higher turnover. Who's the typical renter profile here, and what's been the actual vacancy rate?
- This sits on a lake — are riparian / water-frontage rights deeded with the parcel? Any dock permits, shoreline easements, or HOA water-use restrictions?
- What's the documented flood / surge / shoreline-erosion history here (FEMA AND non-FEMA — e.g., storm surge, creek backup, septic-field saturation)?
- Any water-quality or seasonal algae-bloom issues that affect tenant satisfaction or short-term-rental demand?
- What's the average days-on-market for RENTAL listings here right now (not sales)? A rising rental-DOM trend means longer vacancies and softer asking-rent achievability than the comps imply.
- What's the recent tenant-quality profile in this submarket — average credit score on applications, eviction rate, late-payment / NSF rate, and stable-employment percentage? A property-management company in the area should have these aggregated.
- How much new for-sale + rental construction is in the pipeline within 1–3 miles? Heavy new supply typically softens prices + rents 12–24 months out; constrained supply supports both.
Investment metrics
- 1% rule
- 1.19% ✓
- Cap rate
- 8.08%
- Cash-on-cash
- 6.38%
- DSCR
- 1.28
- GRM
- 7.0
CMA / ARV
- ARV (median comp)
- $161,763
- List price
- $137,000
- Delta
- -15.31%
- Verdict
- UNDERPRICED
- Comps
- 20 within 1.0 mi
Show comp detail 12 sales within ~0.75 mi
| Address | Dist | Beds/Ba | Sqft | Sold | Price | $/sf | Match |
|---|---|---|---|---|---|---|---|
| 219 Lake Cove Dr | 0.00mi | 4/3.0 | 2,114 (0%) | 0mo | $137,000 | $65 | 100 |
| 227 Lake Cove Dr | 0.04mi | 4/2.0 | 2,100 (-1%) | 20mo | $170,000 | $81 | 76 |
| 229 Lake Cove Dr | 0.05mi | 3/2.0 (-1) | 1,940 (-8%) | 18mo | $159,000 | $82 | 60 |
| 517 Winnwood | 0.23mi | 4/2.0 | 1,863 (-12%) | 13mo | $159,000 | $85 | 54 |
| 121 Yorkshire | 0.52mi | 3/2.0 (-1) | 2,197 (+4%) | 12mo | $105,000 | $48 | 50 |
| 107 Carriage Hills Dr | 0.48mi | 3/2.0 (-1) | 1,892 (-10%) | 7mo | $198,777 | $105 | 45 |
| 126 Waywood Dr | 0.47mi | 3/2.0 (-1) | 1,896 (-10%) | 9mo | $209,900 | $111 | 44 |
| 100 Cedarwood Dr | 0.46mi | 4/2.0 | 1,828 (-14%) | 12mo | $179,000 | $98 | 42 |
| 408 Sharon Hills Dr | 0.63mi | 3/2.0 (-1) | 2,256 (+7%) | 17mo | $200,000 | $89 | 37 |
| 206 Carriage Hills Dr | 0.64mi | 3/2.0 (-1) | 2,013 (-5%) | 22mo | $209,900 | $104 | 35 |
| 552 Cedarwood Dr | 0.58mi | 4/2.0 | 2,319 (+10%) | 24mo | $195,000 | $84 | 33 |
| 138 Chestnut Cv | 0.71mi | 3/2.0 (-1) | 1,972 (-7%) | 18mo | $161,900 | $82 | 32 |
Match score weights: distance 35% · size 25% · config 20% · recency 20%. Top-matched comps best support the ARV.
Projected returns pro-forma
-3.0% appreciation · 4.23% rent growth · sell at horizon
- IRR
- -4.8%
- Equity multiple
- 0.82×
- Total profit
- $-7,043
- Equity at exit
- $20,427
- IRR
- 6.4%
- Equity multiple
- 1.51×
- Total profit
- $19,680
- Equity at exit
- $11,845
Cash invested: $38,360 (down + closing). Projections, not guarantees.
Landlord ↔ Tenant lean methodology
- Overall (STATE)
- 90 Strongly Landlord-Friendly
- State Mississippi
- 90 Strongly Landlord-Friendly · R+11
- County
- — inherits STATE
- City
- — inherits STATE
ZIP-level market 39212
- Home prices YoY
- -11.7%
- Rents YoY
- 4.2%
- Active inventory
- 302
- Price-to-rent
- 7.0×
Monthly cashflow live
- Estimated rent
- $1,636 medium interval (Pro) →
- Mortgage (P&I)
- −$718
- Tax from tax record
- −$313 /mo · $3,757/yr
- Insurance
- −$57
- HOA
- −$0
- Vacancy / Maint / Mgmt
- −$344
- Net cashflow
- $204
Break-even live
UW: 25.0% down · 7.5% · 30yr · 1.5% tax · 5.0% vac · 8.0% maint · 8.0% mgmt
Financing live
Cash to close
- Down payment
- $34,250
- Closing costs
- $4,110
- Reserves months
- —
- Total cash needed
- —
Loan-product check · same deal, 3 products live
Conventional
25% down · 7.5% · 30yr
- Down + closing
- —
- Monthly P&I
- —
- Monthly cashflow
- —
- DSCR
- —
- Eligible?
- —
Personal DTI + credit; lowest rate.
DSCR
20% down · 8.5% · 30yr
- Down + closing
- —
- Monthly P&I
- —
- Monthly cashflow
- —
- DSCR
- —
- Eligible?
- —
No personal income docs; deal must DSCR.
Hard money
10% down · 12.0% · 12mo
- Down + closing
- —
- Monthly P&I
- —
- Monthly cashflow
- —
- DSCR
- —
- Eligible?
- —
Short-term bridge; refi at stabilization.
Rent comps 1 comps
| Address | Beds | Baths | Sqft | Rent | $/sqft | DOM | Units | Dist |
|---|---|---|---|---|---|---|---|---|
| 296 Woodcliff Dr Jackson, MS | 3.0 | 2.0 | 2242 | $1,756 | $0.78 | 14d | 1 | 0.41mi |
Listing history 14 events
-
2026-05-12status Active 561-char remark
-
2026-05-06status Pending 561-char remark
-
2026-05-06$137,000 Active 561-char remark
-
2026-04-30historical
-
2026-02-03price $137,000
-
2026-01-14price $147,000
-
2025-10-21price $157,000
-
2025-06-11$162,000 Active
-
2024-04-20historical
-
2024-03-19$162,900 Active
-
2022-09-01soldstatus
-
2019-11-11soldstatus
-
1991-04-18soldstatus
-
1983-08-27soldstatus
ⓘ Source: listings_history table (triggers on properties + properties_extension) + one-shot
backfill from property_details.listing_events for pre-trigger history.
Tax reassessment forecast MS · Resets to sale price
- Current annual tax
- $3,757 · $313/mo
- Projected year-2 tax
- $3,757 · $313/mo
- Expected delta
- $0/yr ($0/mo · 0.0%)
ⓘ Screening estimate from a state-policy table — verify with the county assessor before closing.
Climate risk First Street
- Flood 1/10 Low FEMA zone X (unshaded) · 0% chance over 30 yrs
- Wildfire 3/10 Moderate
- Heat 7/10 Severe 7 d/yr ≥108°F today · 20 d/yr by 30 yrs out
- Wind 8/10 Severe 80% chance of damaging wind over 30 yrs
- Air quality 1/10 Low 0 unhealthy d/yr today · 0 by 30 yrs out
Nearby sold comps map
Loading sold comps map…
Walkable amenities ~0.75 mi
Loading nearby amenities…
Taxation est. · year 1
- Rental income
- $19,636
- − Mortgage interest
- −$7,674
- − Property taxes
- −$3,757
- − Insurance
- −$685
- − Repairs & maintenance
- −$1,571
- − Management
- −$1,571
- − Depreciation
- −$3,985
- Taxable income
- $392
- Est. tax owed @ 24.0%
- −$94
- After-tax cash flow
- $2,354/yr
For passive investors: Depreciation is non-cash, so a rental often shows a tax loss while cash-flowing — sheltering income. Rental losses are passive: they offset passive income freely, and up to $25,000/yr can offset ordinary (W-2) income if you actively participate and your MAGI is under $100k (phasing out to $0 by $150k); unused losses carry forward. On sale, claimed depreciation is recaptured at up to 25%, and gains may owe capital-gains tax (a 1031 exchange can defer both). Figures are a year-1 estimate at your 24.0% rate — not tax advice; consult a CPA.
Schools (NCES district)
- District
- Jackson Public School District
- NCES district ID
- 2802190
- Math proficiency
- 9% ▼ -14.00%
- Reading proficiency
- 18% ▼ -7.00%
- Median HH income
- $33,234
- Composite
- 10.89/100
- National rank
- #9755
- State rank
- #112 of 130 in MS
Livability — Jackson
- Score
- 68/100
- State rank
- #66
- US rank
- #9695
Category grades
Schools grade is shown separately in the Schools card above.
Census & demographics
- Census place
- Jackson, MS
- County
- Hinds County · 167,040 people
- City population
- 140,204
- Metro
- Jackson, MS
- Population (ZIP)
- 25,659
- Household income
- $50,722
- Rent vs Own
- Severe rent burden
- 1314.0
Population outlook (Hinds County) Hauer SSP2
- Today (2025)
- 242,528 people
- By 2030
- 241,113 · -0.6%
- By 2040
- 235,557 · -2.9%
- By 2050
- 226,946 · -6.4%
- By 2075
- 199,995 · -17.5%
- By 2100
- 164,165 · -32.3%
Race, ethnicity, and origin ACS 2023
- Neighborhood character
- Predominantly Black (86%)
- Race & ethnicity
- Black 86% White 9% Hispanic / Latino 3% Two or more races 3%
- Common ancestry
- Serbian 1% Lithuanian 1%
- Foreign-born
- 1% · Canada
- Languages at home
- 97% English-only · Spanish 2%
Political lean MEDSL · Hinds
- 2024 margin
- Solid D (+46.1) · D 72.4% · R 26.3% · Other 1.4%
- 2008→2024 swing
- +7.1pp toward D · 2008: 39.0pp · 2024: 46.1pp
- All cycles
- 2024: D+46.1 2020: D+48.3 2016: D+43.7 2012: D+45.1 2008: D+39.0
Not yet ingested
- Civics
- —
Market trends
- HPI YoY
- ▼ -23.01%
- Current HPI
- 174.4025
- Rent YoY
- ▲ 4.23%
- Metro
- Jackson, MS
- State GDP YoY
- —
- F500 in state
- 0
Price history
-15.9% since first listed16 events — show timeline
- 2026-06-10 Sold (MLS) — MLSU
- 2026-05-27 Pending — MLSU
- 2026-05-12 Relisted — MLSU
- 2026-05-06 Pending — MLSU
- 2026-05-06 Listed $137,000 MLSU
- 2026-04-30 Listing Removed — MLSU
- 2026-02-03 Price Changed $137,000 MLSU
- 2026-01-14 Price Changed $147,000 MLSU
- 2025-10-21 Price Changed $157,000 MLSU
- 2025-06-11 Listed $162,000 MLSU
- 2024-04-20 Listing Removed — MLSU
- 2024-03-19 Listed $162,900 MLSU
- 2022-09-01 Sold (Public Records) — Public Records
- 2019-11-11 Sold (Public Records) — Public Records
- 1991-04-18 Sold (Public Records) — Public Records
- 1983-08-27 Sold (Public Records) — Public Records
Property tax history
+13.4%/yrLatest (2025): $3,757 · +3.0% YoY. Source: county tax records.
Cash-flow waterfall
monthlySold comps — $/sqft
last 12 mo · ≤1 miLoading sold comps…