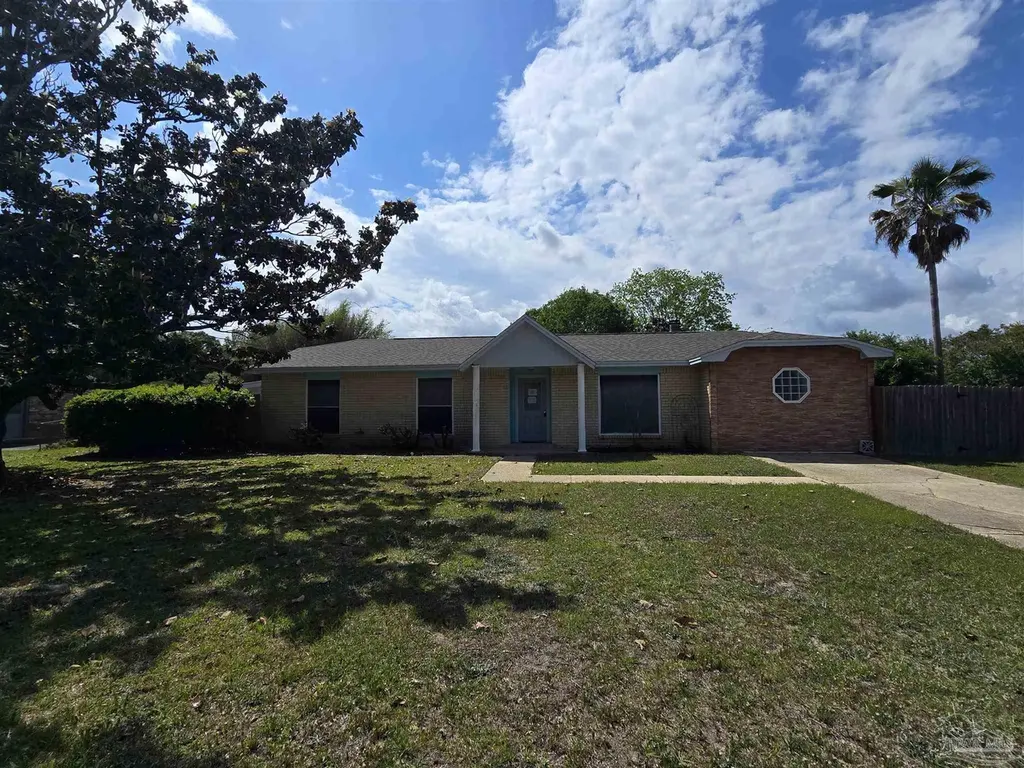
7039 Forshalee St · Brent, FL
Flood risk 1/10 · Minimal
- FEMA flood zone
- X (unshaded)
- Chance of flooding over 30 yrs
- 0.0%
- Est. flood insurance / yr
- $507 – $1,088
Fire risk 1/10 · Minimal
- Est. fire insurance / yr
- $947 – $1,759
Heat risk 10/10 · Severe
- Hot days now (above 106°F)
- 7 days/yr
- Hot days in 30 yrs
- 22 days/yr
Wind risk 9/10 · Severe
- Chance of severe wind over 30 yrs
- 99.0%
Air-quality risk 1/10 · Minimal
- Unhealthy air days now
- 0 days/yr
- Unhealthy air days in 30 yrs
- 0 days/yr
Risk factors via First Street. Map © Google.
Why this score? — see what drove the C- grade
The composite is a weighted blend of 9 inputs, each scored 0–100. Each bar is that input's sub-score; the figure is the points it added to the 100-point composite (weight × sub-score).
- ARV discount +15.0/15.0
- Cash flow +14.6/30.0
- DSCR +4.5/10.0
- 1% rule +4.2/10.0
- Schools +3.6/10.0
- Livability +3.5/5.0
- Rent growth +3.3/5.0
- Condition / age +2.5/5.0
- Appreciation +0.0/10.0
$196,500
🖨 Deal sheet (PDF) 📄 Offer letter ✓ Due diligence
Listing remarks MLS
LOCATION! 3 B, 2 B home nestled in a nice neighborhood—right in the center of town, AND boasts almost a 1/2 acre of land! The huge family room, breakfast nook, & bar make this the perfect home for entertaining. It is hurricane ready with Rebuild NWFL: new copper wiring 2018, new HVAC 2018, & new roof June 2021. The entry foyer & inside laundry make this home even more convenient. The fenced in back yard with workshop & covered pavilion / patio area create a private paradise convenient to everything. Don't miss your chance to own this fantastic property.
Key facts
- 0.39 acre lot
- Garage
- Built 1973
Tags
Property features AI
Finance
- HOA & community: No homeowners association
Exterior
- Parking: Driveway parking; Converted garage; Open parking available
- Utilities: Public water; Public sewer; Electric with circuit breakers and copper wiring; Cable available
- Home design: Single-story home; Resale property; Not attached to other properties; Shingle roof; Slab foundation
- Construction: Frame construction; One level
- Exterior features: Private backyard with fencing; Patio and porch; Yard building (outbuilding); County-maintained paved road access; Central access lot feature
Interior
- Kitchen: Dishwasher; Built-in microwave; Electric water heater
- Bedrooms: Primary bedroom on the first floor (approx. 13.5' x 13'); Second bedroom on the first floor (approx. 11' x 12.5'); Third bedroom on the first floor (approx. 10.5' x 11')
- Flooring: Carpet
- Bathrooms: Two full bathrooms
- Heating & cooling: Central heating; Fireplace(s); Central air; Ceiling fans for cooling
- Interior features: Built-in bookcases; Ceiling fans; High-speed internet
- Laundry & utility: Indoor laundry with washer/dryer hookups
Neighborhood map
What this means for you Summary
Snapshot
- This is a 3-bed/2.0-bath single-family listed at $196k.
Deal economics
- At list price, monthly cash flow is $47 ($561/yr) — positive.
- The deal already cash-flows at list — no discount required.
- To meet the 1% rule (rent ≥ 1% of price), the offer needs to be $181k (7.7% below list).
- Recommended offer: $181k (7.7% below list) — sets the bar for 1% rule.
Location & tenants
- Location reads 69/100 on livability (#484 in FL) — a middle-class / working-renter tenant base. Strengths: cost of living A+, housing A+, health & safety A+; Watch: crime D, amenities F, commute F.
- Escambia (suburban): math 40% / reading 45% proficiency, ranked #56 of 73 in FL (top 77%) — families likely to look elsewhere, expect single-tenant / working-renter base with shorter leases.
- Zoned schools: Reinhardt Holm Elementary School (math 37% / reading 42%, grade F, #1,513 of 2,144 statewide, top 73%, 453 students, 82% FRL); Washington Senior High School (math 25% / reading 40%, grade F, #411 of 667 statewide, top 62%, 1,733 students, 51% FRL).
- Market conditions: Rents rising (+3.4%/yr); 240 active listings in the ZIP; 9 comparable units currently listed for rent nearby; rentals at typical pace (median 25d on market — plan ~3-4 weeks tenant-placement turnaround); 1,479 units permitted in Escambia County in 2024 (0 in 5+ unit buildings).
- This rent runs 30% of the median local income ($71k/yr) — at the standard rent-burdened threshold; future hikes will face affordability resistance.
Forward outlook
- Local home prices are declining (-3.0%/yr); year-one equity from $1k of loan paydown is wiped out by about $6k of value loss. Plan a longer hold.
- Escambia County population projected at +13% by 2050 — modest demand growth; plan on rents tracking national, not racing it.
Negotiation context
- It's been on market 24 days — a 2% lower offer ($194k) is reasonable based on typical stale-listing flexibility.
- 4 sale attempts since 22y ago with the ask held roughly flat each time — persistent listings suggest the price (not the market) is what's stuck; bring a comps-based counter.
Risks & watch-outs
- Climate carrying-cost: severe wind risk, 99% chance of damaging wind over 30y; extreme-heat days projected 7→22/yr by 2055 (HVAC capex compounding) — expect insurance premiums to compound above CPI over the hold.
Questions for the listing agent
- Built in 1973 — when were the roof, HVAC, electrical panel, plumbing, and water heater last replaced?
- Is there a deadline driving the sale (1031 exchange, divorce, estate, relocation)? That informs how much negotiation room exists.
- Crime grade is D in this area — have there been break-ins, vandalism, or insurance claims at this property in the last 3 years? What carrier currently insures it and at what premium?
- What's the average days-on-market for RENTAL listings here right now (not sales)? A rising rental-DOM trend means longer vacancies and softer asking-rent achievability than the comps imply.
- What's the recent tenant-quality profile in this submarket — average credit score on applications, eviction rate, late-payment / NSF rate, and stable-employment percentage? A property-management company in the area should have these aggregated.
- How much new for-sale + rental construction is in the pipeline within 1–3 miles? Heavy new supply typically softens prices + rents 12–24 months out; constrained supply supports both.
Investment metrics
- 1% rule
- 0.92% ✗
- Cap rate
- 6.58%
- Cash-on-cash
- 1.02%
- DSCR
- 1.05
- GRM
- 9.0
CMA / ARV
- ARV (on-the-fly)
- $277,506
- Comps found
- 12
Show comp detail 12 sales within ~0.75 mi
| Address | Dist | Beds/Ba | Sqft | Sold | Price | $/sf | Match |
|---|---|---|---|---|---|---|---|
| 6227 Vicksburg Dr | 0.36mi | 3/2.0 | 1,740 (+2%) | 1mo | $199,900 | $115 | 80 |
| 6111 Confederate Dr | 0.35mi | 2/2.0 (-1) | 1,649 (-4%) | 1mo | $260,000 | $158 | 72 |
| 129 Redbreast Ln | 0.29mi | 3/2.0 | 1,892 (+10%) | 6mo | $300,000 | $159 | 64 |
| 117 Monarch Ln | 0.64mi | 3/2.0 | 1,624 (-5%) | 2mo | $310,000 | $191 | 60 |
| 359 Tree Swallow Dr | 0.66mi | 3/2.0 | 1,607 (-6%) | 6mo | $295,000 | $184 | 54 |
| 5910 Duchess Rd | 0.66mi | 3/2.0 | 1,837 (+7%) | 7mo | $310,000 | $169 | 51 |
| 6315 White Oak Dr | 0.67mi | 4/2.0 (+1) | 1,851 (+8%) | 1mo | $300,000 | $162 | 50 |
| 6500 Antietam Dr | 0.58mi | 4/2.0 (+1) | 1,882 (+10%) | 4mo | $209,000 | $111 | 48 |
| 441 Shiloh Dr | 0.71mi | 3/2.0 | 1,517 (-11%) | 2mo | $205,000 | $135 | 46 |
| 6337 Parakeet Trl | 0.48mi | 4/2.0 (+1) | 1,968 (+15%) | 5mo | $340,000 | $173 | 43 |
| 6410 White Oak Dr | 0.60mi | 4/2.0 (+1) | 1,911 (+12%) | 7mo | $310,000 | $162 | 42 |
| 5910 Sarah Dr | 0.67mi | 4/2.0 (+1) | 1,932 (+13%) | 2mo | $120,000 | $62 | 41 |
Match score weights: distance 35% · size 25% · config 20% · recency 20%. Top-matched comps best support the ARV.
Projected returns pro-forma
-3.0% appreciation · 3.39% rent growth · sell at horizon
- IRR
- -14.2%
- Equity multiple
- 0.49×
- Total profit
- $-28,105
- Equity at exit
- $29,299
- IRR
- -4.8%
- Equity multiple
- 0.68×
- Total profit
- $-17,502
- Equity at exit
- $16,990
Cash invested: $55,020 (down + closing). Projections, not guarantees.
Landlord ↔ Tenant lean methodology
- Overall (STATE)
- 87 Strongly Landlord-Friendly
- State Florida
- 87 Strongly Landlord-Friendly · R+3
- County
- — inherits STATE
- City
- — inherits STATE
ZIP-level market 32503
- Rents YoY
- 3.4%
- Active inventory
- 240
- Price-to-rent
- 9.0×
Monthly cashflow live
- Estimated rent
- $1,814 high interval (Pro) →
- Mortgage (P&I)
- −$1,030
- Tax from tax record
- −$274 /mo · $3,287/yr
- Insurance
- −$82
- HOA
- −$0
- Vacancy / Maint / Mgmt
- −$381
- Net cashflow
- $47
Break-even live
Sensitivity live
| Price | -10% $158 | -5% $102 | +0% $47 | +5% $-9 | +10% $-64 |
|---|---|---|---|---|---|
| Rent | -10% $-97 | -5% $-25 | +0% $47 | +5% $118 | +10% $190 |
| Rate | -1.0pp $146 | -0.5pp $97 | base $47 | +0.5pp $-4 | +1.0pp $-56 |
UW: 25.0% down · 7.5% · 30yr · 1.5% tax · 5.0% vac · 8.0% maint · 8.0% mgmt
Financing live
Cash to close
- Down payment
- $49,125
- Closing costs
- $5,895
- Reserves months
- —
- Total cash needed
- —
Loan-product check · same deal, 3 products live
Conventional
25% down · 7.5% · 30yr
- Down + closing
- —
- Monthly P&I
- —
- Monthly cashflow
- —
- DSCR
- —
- Eligible?
- —
Personal DTI + credit; lowest rate.
DSCR
20% down · 8.5% · 30yr
- Down + closing
- —
- Monthly P&I
- —
- Monthly cashflow
- —
- DSCR
- —
- Eligible?
- —
No personal income docs; deal must DSCR.
Hard money
10% down · 12.0% · 12mo
- Down + closing
- —
- Monthly P&I
- —
- Monthly cashflow
- —
- DSCR
- —
- Eligible?
- —
Short-term bridge; refi at stabilization.
Rent comps 9 comps
| Address | Beds | Baths | Sqft | Rent | $/sqft | DOM | Units | Dist |
|---|---|---|---|---|---|---|---|---|
| 27 E Burgess Rd Pensacola, FL | 2.0 | 2.0 | 1100 | $1,124 | $1.02 | 25d | 1 | 0.50mi |
| 118 Czar Ln Pensacola, FL | 4.0 | 2.0 | 1477 | $1,795 | $1.22 | 25d | 1 | 0.52mi |
| 204 Tree Swallow Dr Pensacola, FL | 3.0 | 2.0 | 1500 | $2,000 | $1.33 | 25d | 1 | 0.56mi |
| 147 Creekview Dr Pensacola, FL | 3.0 | 2.0 | 1188 | $1,700 | $1.43 | 15d | 1 | 0.65mi |
| 7812 Oak Forest Dr Pensacola, FL | 3.0 | 1.5 | 1166 | $1,750 | $1.50 | 25d | 1 | 1.02mi |
| 400 Schubert Dr Pensacola, FL | 3.0 | 2.5 | 1600 | $2,100 | $1.31 | 25d | 1 | 1.09mi |
| 7150 Plantation Rd #122 Pensacola, FL | 2.0 | 2.0 | 1092 | $1,500 | $1.37 | 25d | 1 | 1.10mi |
| 1040 E Olive Rd Pensacola, FL | 1.0–3.0 | 1.0–2.0 | 897 | $1,644 | $1.83 | 25d | 7 | 1.33mi |
| 6115 N Davis Hwy Pensacola, FL | 1.0–3.0 | 1.0–2.0 | 1112 | $1,825 | $1.64 | 15d | 10 | 1.33mi |
Listing history 15 events
-
2026-05-13historical Contingent
-
2026-05-04$196,500 Active
-
2024-08-09historical
-
2024-07-19price $267,000
-
2024-07-05price $288,000
-
2024-06-23$299,900 Active
-
2022-07-08soldstatus $250,000
-
2022-06-30status Pending 592-char remark
Show marketing remark (592 chars)
LOCATION! 3 B, 2 B home nestled in a nice neighborhood—right in the center of town, AND boasts almost a 1/2 acre of land! The huge family room, breakfast nook, & bar make this the perfect home for entertaining. It is hurricane ready with Rebuild NWFL: new copper wiring 2018, new HVAC 2018, & new roof June 2021. The entry foyer & inside laundry make this home even more convenient. The fenced in back yard with workshop & covered pavilion / patio area create a private paradise convenient to everything. Don't miss your chance to own this fantastic property.
-
2022-06-30soldstatus $250,000 Sold 592-char remark
Show marketing remark (592 chars)
LOCATION! 3 B, 2 B home nestled in a nice neighborhood—right in the center of town, AND boasts almost a 1/2 acre of land! The huge family room, breakfast nook, & bar make this the perfect home for entertaining. It is hurricane ready with Rebuild NWFL: new copper wiring 2018, new HVAC 2018, & new roof June 2021. The entry foyer & inside laundry make this home even more convenient. The fenced in back yard with workshop & covered pavilion / patio area create a private paradise convenient to everything. Don't miss your chance to own this fantastic property.
-
2022-05-27historical Contingent 592-char remark
Show marketing remark (592 chars)
LOCATION! 3 B, 2 B home nestled in a nice neighborhood—right in the center of town, AND boasts almost a 1/2 acre of land! The huge family room, breakfast nook, & bar make this the perfect home for entertaining. It is hurricane ready with Rebuild NWFL: new copper wiring 2018, new HVAC 2018, & new roof June 2021. The entry foyer & inside laundry make this home even more convenient. The fenced in back yard with workshop & covered pavilion / patio area create a private paradise convenient to everything. Don't miss your chance to own this fantastic property.
-
2022-05-22$250,000 Active 592-char remark
Show marketing remark (592 chars)
LOCATION! 3 B, 2 B home nestled in a nice neighborhood—right in the center of town, AND boasts almost a 1/2 acre of land! The huge family room, breakfast nook, & bar make this the perfect home for entertaining. It is hurricane ready with Rebuild NWFL: new copper wiring 2018, new HVAC 2018, & new roof June 2021. The entry foyer & inside laundry make this home even more convenient. The fenced in back yard with workshop & covered pavilion / patio area create a private paradise convenient to everything. Don't miss your chance to own this fantastic property.
-
2005-02-03soldstatus $139,900
-
2005-01-26soldstatus $139,900
-
2004-12-08$139,900
-
2004-10-13soldstatus $115,000
ⓘ Source: listings_history table (triggers on properties + properties_extension) + one-shot
backfill from property_details.listing_events for pre-trigger history.
Tax reassessment forecast FL · Resets to sale price
- Current annual tax
- $3,287 · $274/mo
- Projected year-2 tax
- $3,287 · $274/mo
- Expected delta
- $0/yr ($0/mo · 0.0%)
ⓘ Screening estimate from a state-policy table — verify with the county assessor before closing.
Climate risk First Street
- Flood 1/10 Low FEMA zone X (unshaded) · 0% chance over 30 yrs
- Wildfire 1/10 Low
- Heat 10/10 Extreme 7 d/yr ≥106°F today · 22 d/yr by 30 yrs out
- Wind 9/10 Extreme 99% chance of damaging wind over 30 yrs
- Air quality 1/10 Low 0 unhealthy d/yr today · 0 by 30 yrs out
Nearby sold comps map
Loading sold comps map…
Walkable amenities ~0.75 mi
Loading nearby amenities…
Taxation est. · year 1
- Rental income
- $21,767
- − Mortgage interest
- −$11,007
- − Property taxes
- −$3,287
- − Insurance
- −$982
- − Repairs & maintenance
- −$1,741
- − Management
- −$1,741
- − Depreciation
- −$5,716
- Taxable loss
- −$2,708
- Est. tax savings @ 24.0%
- +$650
- After-tax cash flow
- $1,211/yr
For passive investors: Depreciation is non-cash, so a rental often shows a tax loss while cash-flowing — sheltering income. Rental losses are passive: they offset passive income freely, and up to $25,000/yr can offset ordinary (W-2) income if you actively participate and your MAGI is under $100k (phasing out to $0 by $150k); unused losses carry forward. On sale, claimed depreciation is recaptured at up to 25%, and gains may owe capital-gains tax (a 1031 exchange can defer both). Figures are a year-1 estimate at your 24.0% rate — not tax advice; consult a CPA.
Schools (NCES district)
- District
- Escambia
- NCES district ID
- 1200510
- Math proficiency
- 40% ▼ -9.00%
- Reading proficiency
- 45% ▼ -4.00%
- Median HH income
- $44,649
- Composite
- 36.04/100
- National rank
- #4773
- State rank
- #56 of 73 in FL
Livability — Brent
- Score
- 69/100
- State rank
- #484
- US rank
- #8921
Category grades
Schools grade is shown separately in the Schools card above.
Census & demographics
- Census place
- Brent, FL
- County
- Escambia County · 301,722 people
- City population
- 27,543
- Metro
- Pensacola-Ferry Pass-Brent, FL
- Population (ZIP)
- 33,559
- Household income
- $71,411
- Rent vs Own
- Severe rent burden
- 948.0
Population outlook (Escambia County) Hauer SSP2
- Today (2025)
- 334,637 people
- By 2030
- 345,779 · +3.3%
- By 2040
- 364,828 · +9.0%
- By 2050
- 378,514 · +13.1%
- By 2075
- 403,220 · +20.5%
- By 2100
- 386,125 · +15.4%
Race, ethnicity, and origin ACS 2023
- Neighborhood character
- Predominantly White (68%)
- Race & ethnicity
- White 68% Black 20% Two or more races 6% Hispanic / Latino 5% Asian 2%
- Common ancestry
- Lithuanian 3% Italian 2% Romanian 2%
- Foreign-born
- 5% · Canada, China
- Languages at home
- 93% English-only · Spanish 3% Arabic 1% Tagalog/Filipino 1%
Political lean MEDSL · Escambia
- 2024 margin
- R (+19.5) · D 39.7% · R 59.2% · Other 1.1%
- 2008→2024 swing
- -0.2pp no change · 2008: -19.3pp · 2024: -19.5pp
- All cycles
- 2024: R+19.5 2020: R+15.1 2016: R+20.6 2012: R+20.6 2008: R+19.3
Not yet ingested
- Civics
- —
Market trends
- HPI YoY
- ▼ -300.02%
- Current HPI
- 294.4873
- Rent YoY
- ▲ 3.39%
- Metro
- Pensacola-Ferry Pass-Brent, FL
- State GDP YoY
- ▲ 3.28%
- F500 in state
- 36
Industry mix (Fortune 500 HQ in FL)
| Industry | F500 HQs | Revenue |
|---|---|---|
| Industrial Technology | 2 | $29B |
|
||
| Insurance | 2 | $17B |
|
||
| Retail | 1 | $60B |
|
||
| Technology Distribution | 1 | $58B |
|
||
| Homebuilding | 1 | $35B |
|
||
| Technology Manufacturing | 1 | $35B |
|
||
Price history
+70.9% since first listed15 events — show timeline
- 2026-05-13 Contingent — PARMLS
- 2026-05-04 Listed $196,500 PARMLS
- 2024-08-09 Listing Removed — PARMLS
- 2024-07-19 Price Changed $267,000 PARMLS
- 2024-07-05 Price Changed $288,000 PARMLS
- 2024-06-23 Listed $299,900 PARMLS
- 2022-07-08 Sold (Public Records) $250,000 Public Records
- 2022-06-30 Pending — PARMLS
- 2022-06-30 Sold (MLS) $250,000 PARMLS
- 2022-05-27 Contingent — PARMLS
- 2022-05-22 Listed $250,000 PARMLS
- 2005-02-03 Sold (Public Records) $139,900 Public Records
- 2005-01-26 Sold (MLS) $139,900 PARMLS
- 2004-12-08 Listed $139,900 PARMLS
- 2004-10-13 Sold (Public Records) $115,000 Public Records
Property tax history
+15.7%/yrLatest (2025): $3,287 · +2522.3% YoY. Source: county tax records.
Cash-flow waterfall
monthlySold comps — $/sqft
last 12 mo · ≤1 miLoading sold comps…