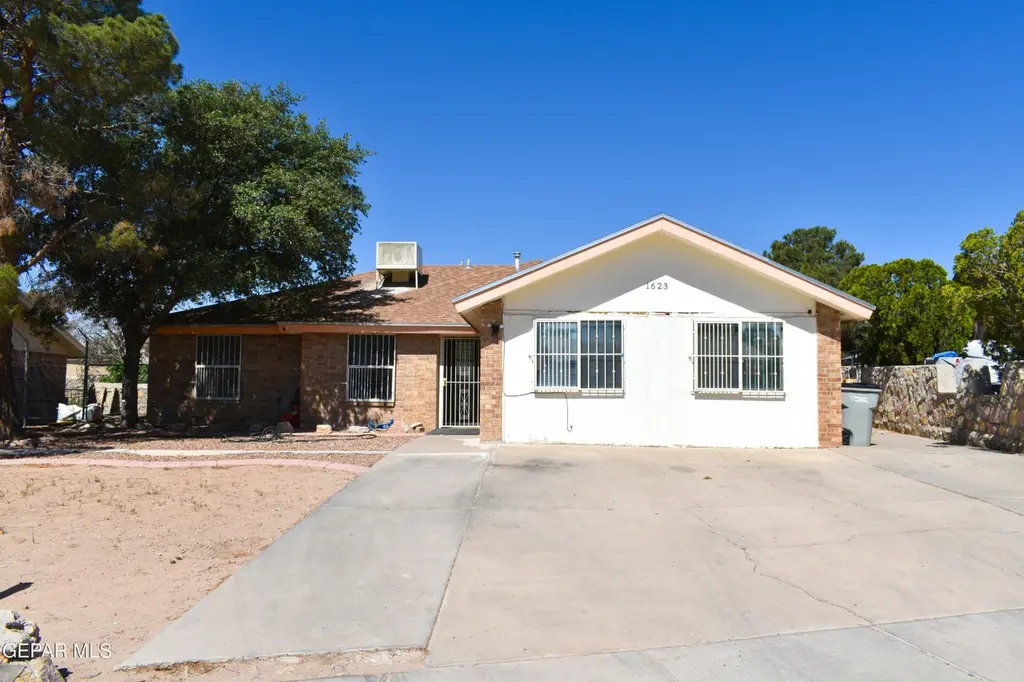
1623 Brian Ray Cir · El Paso, TX
Flood risk 1/10 · Minimal
- FEMA flood zone
- X
- Chance of flooding over 30 yrs
- 0.0%
- Est. flood insurance / yr
- $507 – $1,088
Fire risk 1/10 · Minimal
- Est. fire insurance / yr
- $1,222 – $2,270
Heat risk 6/10 · Moderate
- Hot days now (above 101°F)
- 7 days/yr
- Hot days in 30 yrs
- 25 days/yr
Wind risk 1/10 · Minimal
- Chance of severe wind over 30 yrs
- —
Air-quality risk 3/10 · Minor
- Unhealthy air days now
- 2 days/yr
- Unhealthy air days in 30 yrs
- 2 days/yr
Risk factors via First Street. Map © Google.
Why this score? — see what drove the D+ grade
The composite is a weighted blend of 9 inputs, each scored 0–100. Each bar is that input's sub-score; the figure is the points it added to the 100-point composite (weight × sub-score).
- Cash flow +18.2/30.0
- ARV discount +7.5/15.0
- 1% rule +6.2/10.0
- DSCR +5.7/10.0
- Livability +4.0/5.0
- Rent growth +3.0/5.0
- Schools +2.6/10.0
- Condition / age +2.5/5.0
- Appreciation +0.0/10.0
$235,000
🖨 Deal sheet 📄 Offer letter ✓ Due diligence
Listing remarks MLS
;; **1623 Brian Ray Cir, El Paso, TX 79936** Spacious East Side home offering **4-5 bedrooms and 2 baths, perfect for families or those needing extra space. Multiple living areas, bright kitchen, and a private backyard make it ideal for entertaining or relaxing. Located in the Vista Del Sol neighborhood, this property provides easy access to Vista Del Sol Park, Cielo Vista Mall, Walmart, Target, and a variety of dining options along George Dieter and Montwood. Schools in Socorro ISD are nearby, along with healthcare clinics and pharmacies. Quick routes to Loop 375 and I-10 ensure convenient commuting. A wonderful blend of comfort, location, and lifestyle awaits at 1623 Brian Ray Cir. Home has a converted garage
Key facts
- 7,435 sq ft lot
- Built 1985
- Listed 179 days
Neighborhood map
What this means for you Summary
Snapshot
- This is a 5-bed/2.5-bath single-family listed at $235k.
Deal economics
- At list price, monthly cash flow is $209 ($3k/yr) — positive.
- The deal already cash-flows at list — no discount required.
- Meets the 1% rule at list price ($3k rent vs $235k).
- Recommended offer: $207k (12.0% below list) — sets the bar for market timing.
Location & tenants
- Location reads 81/100 on livability (#23 in TX, #1,375 nationally) — a professional / high-income tenant draw. Strengths: commute A+, cost of living A+, housing A+; Watch: employment D+.
- Socorro ISD (urban): math 23% / reading 36% proficiency, ranked #624 of 826 in TX (top 76%) — low school quality limits family demand, transient renter base, plan for 1-2y turnover; 66% free/reduced lunch — lower-income household profile, screen leases tightly.
- Market conditions: Rents rising (+2.0%/yr); 228 active listings in the ZIP; 2 comparable units currently listed for rent nearby; 2,196 units permitted in El Paso County in 2024 (143 in 5+ unit buildings).
- At $2,638/mo this rent would consume 47% of the median local household income ($67k/yr) (locally 2856% of renters already pay >50% of income on rent) — very limited rent-growth headroom before tenants either downsize or default.
Forward outlook
- Local home prices are declining (-3.0%/yr); year-one equity from $2k of loan paydown is wiped out by about $7k of value loss. Plan a longer hold.
- El Paso County population projected at +10% by 2050 — modest demand growth; plan on rents tracking national, not racing it.
Negotiation context
- It's been on market 180 days — a 12% lower offer ($207k) is reasonable based on typical stale-listing flexibility.
- 2 sale attempts since 5y ago; this cycle's ask has dropped $15k (6%) from the opening price — seller is motivated, your offer sets the floor, not the list.
- Current owner paid $63k; list at $235k implies a 273% gain — meaningful room to come down on a strong offer.
Risks & watch-outs
- Watch-outs: property tax is 2.8% of price.
- Climate carrying-cost: extreme-heat days projected 7→25/yr by 2055 (HVAC capex compounding) — expect insurance premiums to compound above CPI over the hold.
Questions for the listing agent
- It's been on market 180 days. Have you received any prior offers? Is the seller open to a 12% concession, seller financing, or rate buy-down credit?
- Property tax is high relative to price — has the assessment been appealed recently, and will the sale trigger a re-assessment?
- Why hasn't it sold? Are there any deal-killer items the seller is aware of (foundation, flood, title, zoning, code violations)?
- Is there a deadline driving the sale (1031 exchange, divorce, estate, relocation)? That informs how much negotiation room exists.
- Schools are B-rated — typically a magnet for longer-tenancy family renters. What's the average tenant stay here, and is there a school-zone premium baked into asking?
- The area grade is low — what's the realistic commute time and amenity access for the typical tenant pool here? Any planned neighborhood developments (good or bad) we should know about?
- What's the average days-on-market for RENTAL listings here right now (not sales)? A rising rental-DOM trend means longer vacancies and softer asking-rent achievability than the comps imply.
- What's the recent tenant-quality profile in this submarket — average credit score on applications, eviction rate, late-payment / NSF rate, and stable-employment percentage? A property-management company in the area should have these aggregated.
- How much new for-sale + rental construction is in the pipeline within 1–3 miles? Heavy new supply typically softens prices + rents 12–24 months out; constrained supply supports both.
Investment metrics
- 1% rule
- 1.12% ✓
- Cap rate
- 7.36%
- Cash-on-cash
- 3.81%
- DSCR
- 1.17
- GRM
- 7.4
CMA / ARV
No comps found within radius.
Projected returns pro-forma
-3.0% appreciation · 2.04% rent growth · sell at horizon
- IRR
- -11.5%
- Equity multiple
- 0.59×
- Total profit
- $-27,115
- Equity at exit
- $35,039
- IRR
- -3.8%
- Equity multiple
- 0.76×
- Total profit
- $-15,862
- Equity at exit
- $20,319
Cash invested: $65,800 (down + closing). Projections, not guarantees.
Landlord ↔ Tenant lean methodology
- Overall (STATE)
- 87 Strongly Landlord-Friendly
- State Texas
- 87 Strongly Landlord-Friendly · R+5
- County
- — inherits STATE
- City
- — inherits STATE
ZIP-level market 79936
- Home prices YoY
- -25.9%
- Rents YoY
- 2.0%
- Active inventory
- 228
- Price-to-rent
- 7.4×
Monthly cashflow live
- Estimated rent
- $2,638 medium interval (Pro) →
- Mortgage (P&I)
- −$1,232
- Tax from tax record
- −$545 /mo · $6,544/yr
- Insurance
- −$98
- HOA
- −$0
- Vacancy / Maint / Mgmt
- −$554
- Net cashflow
- $209
Break-even live
UW: 25.0% down · 7.5% · 30yr · 1.5% tax · 5.0% vac · 8.0% maint · 8.0% mgmt
Financing live
Cash to close
- Down payment
- $58,750
- Closing costs
- $7,050
- Reserves months
- —
- Total cash needed
- —
Loan-product check · same deal, 3 products live
Conventional
25% down · 7.5% · 30yr
- Down + closing
- —
- Monthly P&I
- —
- Monthly cashflow
- —
- DSCR
- —
- Eligible?
- —
Personal DTI + credit; lowest rate.
DSCR
20% down · 8.5% · 30yr
- Down + closing
- —
- Monthly P&I
- —
- Monthly cashflow
- —
- DSCR
- —
- Eligible?
- —
No personal income docs; deal must DSCR.
Hard money
10% down · 12.0% · 12mo
- Down + closing
- —
- Monthly P&I
- —
- Monthly cashflow
- —
- DSCR
- —
- Eligible?
- —
Short-term bridge; refi at stabilization.
Rent comps 2 comps
| Address | Beds | Baths | Sqft | Rent | $/sqft | DOM | Units | Dist |
|---|---|---|---|---|---|---|---|---|
| 1716 Tommy Aaron Dr El Paso, TX | 4.0 | 2.5 | 3152 | $3,190 | $1.01 | 43d | 1 | 0.76mi |
| 11648 Lake Erie Dr El Paso, TX | 5.0 | 3.0 | 2424 | $2,200 | $0.91 | 10d | 1 | 1.29mi |
Listing history 19 events
-
2026-06-13days on market $235,000 Active 180 DOM
-
2026-06-10days on market $235,000 Active 177 DOM
-
2026-06-09days on market $235,000 Active 176 DOM
-
2026-06-08days on market $235,000 Active 175 DOM
-
2026-06-07days on market $235,000 Active 174 DOM
-
2026-06-05days on market $235,000 Active 171 DOM
-
2026-06-03days on market $235,000 Active 170 DOM
-
2026-06-03days on market $235,000 Active 169 DOM
-
2026-06-01days on market $235,000 Active 168 DOM
-
2026-05-31days on market $235,000 Active 167 DOM
-
2026-04-21price $235,000 724-char remark
Show marketing remark (724 chars)
;; **1623 Brian Ray Cir, El Paso, TX 79936** Spacious East Side home offering **4-5 bedrooms and 2 baths, perfect for families or those needing extra space. Multiple living areas, bright kitchen, and a private backyard make it ideal for entertaining or relaxing. Located in the Vista Del Sol neighborhood, this property provides easy access to Vista Del Sol Park, Cielo Vista Mall, Walmart, Target, and a variety of dining options along George Dieter and Montwood. Schools in Socorro ISD are nearby, along with healthcare clinics and pharmacies. Quick routes to Loop 375 and I-10 ensure convenient commuting. A wonderful blend of comfort, location, and lifestyle awaits at 1623 Brian Ray Cir. Home has a converted garage
-
2026-03-23price $239,900 724-char remark
Show marketing remark (724 chars)
;; **1623 Brian Ray Cir, El Paso, TX 79936** Spacious East Side home offering **4-5 bedrooms and 2 baths, perfect for families or those needing extra space. Multiple living areas, bright kitchen, and a private backyard make it ideal for entertaining or relaxing. Located in the Vista Del Sol neighborhood, this property provides easy access to Vista Del Sol Park, Cielo Vista Mall, Walmart, Target, and a variety of dining options along George Dieter and Montwood. Schools in Socorro ISD are nearby, along with healthcare clinics and pharmacies. Quick routes to Loop 375 and I-10 ensure convenient commuting. A wonderful blend of comfort, location, and lifestyle awaits at 1623 Brian Ray Cir. Home has a converted garage
-
2025-12-15$250,000 Active 724-char remark
Show marketing remark (724 chars)
;; **1623 Brian Ray Cir, El Paso, TX 79936** Spacious East Side home offering **4-5 bedrooms and 2 baths, perfect for families or those needing extra space. Multiple living areas, bright kitchen, and a private backyard make it ideal for entertaining or relaxing. Located in the Vista Del Sol neighborhood, this property provides easy access to Vista Del Sol Park, Cielo Vista Mall, Walmart, Target, and a variety of dining options along George Dieter and Montwood. Schools in Socorro ISD are nearby, along with healthcare clinics and pharmacies. Quick routes to Loop 375 and I-10 ensure convenient commuting. A wonderful blend of comfort, location, and lifestyle awaits at 1623 Brian Ray Cir. Home has a converted garage
-
2022-01-07soldstatus
-
2021-11-11historical
-
2021-10-07price $190,000
-
2021-09-02$200,000 Active
-
1996-08-02soldstatus $63,000
-
1985-10-18soldstatus $54,950
ⓘ Source: listings_history table (triggers on properties + properties_extension) + one-shot
backfill from property_details.listing_events for pre-trigger history.
Tax reassessment forecast TX · Resets to sale price
- Current annual tax
- $6,544 · $545/mo
- Projected year-2 tax
- $6,544 · $545/mo
- Expected delta
- $0/yr ($0/mo · 0.0%)
ⓘ Screening estimate from a state-policy table — verify with the county assessor before closing.
Climate risk First Street
- Flood 1/10 Low FEMA zone X · 0% chance over 30 yrs
- Wildfire 1/10 Low
- Heat 6/10 Major 7 d/yr ≥101°F today · 25 d/yr by 30 yrs out
- Wind 1/10 Low
- Air quality 3/10 Moderate 2 unhealthy d/yr today · 2 by 30 yrs out
Nearby sold comps map
Loading sold comps map…
Walkable amenities ~0.75 mi
Loading nearby amenities…
Taxation est. · year 1
- Rental income
- $31,661
- − Mortgage interest
- −$13,164
- − Property taxes
- −$6,544
- − Insurance
- −$1,175
- − Repairs & maintenance
- −$2,533
- − Management
- −$2,533
- − Depreciation
- −$6,836
- Taxable loss
- −$1,124
- Est. tax savings @ 24.0%
- +$270
- After-tax cash flow
- $2,775/yr
For passive investors: Depreciation is non-cash, so a rental often shows a tax loss while cash-flowing — sheltering income. Rental losses are passive: they offset passive income freely, and up to $25,000/yr can offset ordinary (W-2) income if you actively participate and your MAGI is under $100k (phasing out to $0 by $150k); unused losses carry forward. On sale, claimed depreciation is recaptured at up to 25%, and gains may owe capital-gains tax (a 1031 exchange can defer both). Figures are a year-1 estimate at your 24.0% rate — not tax advice; consult a CPA.
Schools (NCES district)
- District
- Socorro ISD
- NCES district ID
- 4840710
- Math proficiency
- 23% ▼ -34.00%
- Reading proficiency
- 36% ▼ -14.00%
- Median HH income
- $49,318
- Composite
- 25.67/100
- National rank
- #7396
- State rank
- #624 of 826 in TX
Livability — El Paso
- Score
- 81/100
- State rank
- #23
- US rank
- #1375
Category grades
Schools grade is shown separately in the Schools card above.
Census & demographics
- Census place
- El Paso, TX
- County
- El Paso County · 761,266 people
- City population
- 630,223
- Metro
- El Paso, TX
- Population (ZIP)
- 102,991
- Household income
- $67,198
- Rent vs Own
- Severe rent burden
- 2856.0
Population outlook (El Paso County) Hauer SSP2
- Today (2025)
- 897,899 people
- By 2030
- 922,694 · +2.8%
- By 2040
- 960,492 · +7.0%
- By 2050
- 982,919 · +9.5%
- By 2075
- 997,266 · +11.1%
- By 2100
- 900,630 · +0.3%
Race, ethnicity, and origin ACS 2023
- Neighborhood character
- Predominantly Hispanic (86%)
- Race & ethnicity
- Hispanic / Latino 86% Two or more races 40% White 9% Black 3% Asian 1%
- Hispanic origin (detail)
- Mexican 82% Puerto Rican 1%
- Foreign-born
- 20% · Canada
- Languages at home
- 32% English-only · Spanish 66%
Political lean MEDSL · El Paso
- 2024 margin
- D (+15.1) · D 57.0% · R 41.8% · Other 1.2%
- 2008→2024 swing
- -17.4pp toward R · 2008: 32.5pp · 2024: 15.1pp
- All cycles
- 2024: D+15.1 2020: D+35.1 2016: D+43.2 2012: D+32.6 2008: D+32.5
Not yet ingested
- Civics
- —
Market trends
- HPI YoY
- ▼ -86.55%
- Current HPI
- 247.851
- Rent YoY
- ▲ 2.04%
- Metro
- El Paso, TX
- State GDP YoY
- ▲ 3.95%
- F500 in state
- 110
Industry mix (Fortune 500 HQ in TX)
| Industry | F500 HQs | Revenue |
|---|---|---|
| Energy | 16 | $1,198B |
|
||
| Technology | 5 | $198B |
|
||
| Engineering / Construction | 4 | $72B |
|
||
| Energy Services | 3 | $60B |
|
||
| Utilities | 3 | $41B |
|
||
| Healthcare | 2 | $330B |
|
||
Price history
+327.7% since first listed9 events — show timeline
- 2026-04-21 Price Changed $235,000 GEPARMLS
- 2026-03-23 Price Changed $239,900 GEPARMLS
- 2025-12-15 Listed $250,000 GEPARMLS
- 2022-01-07 Sold (Public Records) — Public Records
- 2021-11-11 Listing Removed — GEPARMLS
- 2021-10-07 Price Changed $190,000 GEPARMLS
- 2021-09-02 Listed $200,000 GEPARMLS
- 1996-08-02 Sold (Public Records) $63,000 Public Records
- 1985-10-18 Sold (Public Records) $54,950 Public Records
Property tax history
+8.7%/yrLatest (2025): $6,544 · +4.2% YoY. Source: county tax records.
Cash-flow waterfall
monthlySold comps — $/sqft
last 12 mo · ≤1 miLoading sold comps…