172 E2220 · Haworth, OK
Flood risk 3/10 · Minor
- FEMA flood zone
- X (unshaded)
- Chance of flooding over 30 yrs
- 0.2%
- Est. flood insurance / yr
- $507 – $1,088
Fire risk 6/10 · Moderate
- Est. fire insurance / yr
- $2,463 – $4,575
Heat risk 7/10 · Major
- Hot days now (above 111°F)
- 7 days/yr
- Hot days in 30 yrs
- 22 days/yr
Wind risk 4/10 · Minor
- Chance of severe wind over 30 yrs
- 15.0%
Air-quality risk 1/10 · Minimal
- Unhealthy air days now
- 0 days/yr
- Unhealthy air days in 30 yrs
- 0 days/yr
Risk factors via First Street. Map © Google.
Why this score? — see what drove the C+ grade
The composite is a weighted blend of 9 inputs, each scored 0–100. Each bar is that input's sub-score; the figure is the points it added to the 100-point composite (weight × sub-score).
- Cash flow +24.5/30.0
- Appreciation +10.0/10.0
- DSCR +7.9/10.0
- ARV discount +7.5/15.0
- 1% rule +6.3/10.0
- Rent growth +2.5/5.0
- Livability +2.5/5.0
- Condition / age +2.0/5.0
- Schools +1.4/10.0
$115,000
🖨 Deal sheet 📄 Offer letter ✓ Due diligence
Listing remarks
Motivated Sellers! 4 Beds 2 Baths Like New Home! ?? 2021 Kabco Manufactured Home ?? Size: 1,674 sq. ft. ?? 4 Bedrooms | ?? 2 Bathrooms Features: & acirc; & euro; & cent; Open Floor Plan and all appliances come with home & acirc; & euro; & cent; Bedrooms: 4 generously sized bedrooms and large closets & acirc; & euro; & cent; Bathrooms: 2 full baths & acirc; & euro; & cent; Extras Included: Skirting and porches come with the home. ?? Move Required: The home will need to be relocated to your land or property. ??location: Haworth, OK ?? Contact Jerrod Lundry 580.977.9016 for more details or to schedule a showing!
Key facts
- Open floor plan
- Built 2021
- Listed 23 days
Tags
Neighborhood map
What this means for you Summary
Snapshot
- This is a 4-bed/2.0-bath other listed at $115k. Condition is rated fair.
Deal economics
- At list price, monthly cash flow is $236 ($3k/yr) — positive.
- The deal already cash-flows at list — no discount required.
- Meets the 1% rule at list price ($1k rent vs $115k).
- Recommended offer: $113k (1.5% below list) — sets the bar for market timing.
Location & tenants
- Location reads 50/100 on livability (#669 in OK) — a working-class tenant base; expect higher turnover. Strengths: cost of living A+, housing A+; Watch: schools F, crime F, amenities F.
- Haworth (rural): math 12% / reading 22% proficiency, ranked #207 of 270 in OK (top 77%) — low school quality limits family demand, transient renter base, plan for 1-2y turnover; 71% free/reduced lunch — lower-income household profile, screen leases tightly.
- Market conditions: 7 active listings in the ZIP; 16 units permitted in McCurtain County in 2024 (0 in 5+ unit buildings).
Forward outlook
- In year one you build about $12k of equity ($795 loan paydown + $12k appreciation (10.0% local appreciation)).
- McCurtain County population projected to shrink 4% by 2050 — rents likely to lag national; underwrite the cash flow, not the appreciation.
- At projected returns (10.0% appreciation + 3.0% rent growth), your $32k cash investment doubles in ~3 years — after that, you're playing with house money.
- By year 3, paydown + projected appreciation supports a ~$31k cash-out refi (75% LTV) — recoverable capital for the next deal without selling this one.
Negotiation context
- It's been on market 23 days — a 2% lower offer ($113k) is reasonable based on typical stale-listing flexibility.
Risks & watch-outs
- Climate carrying-cost: major wildfire risk; extreme-heat days projected 7→22/yr by 2055 (HVAC capex compounding) — expect insurance premiums to compound above CPI over the hold.
Questions for the listing agent
- Have any recent inspections been done? Can we get a copy of the seller's disclosures and any deferred-maintenance estimates?
- Is there a deadline driving the sale (1031 exchange, divorce, estate, relocation)? That informs how much negotiation room exists.
- Schools are F-rated, which usually means shorter tenancies and higher turnover. Who's the typical renter profile here, and what's been the actual vacancy rate?
- Crime grade is F in this area — have there been break-ins, vandalism, or insurance claims at this property in the last 3 years? What carrier currently insures it and at what premium?
- What's the average days-on-market for RENTAL listings here right now (not sales)? A rising rental-DOM trend means longer vacancies and softer asking-rent achievability than the comps imply.
- What's the recent tenant-quality profile in this submarket — average credit score on applications, eviction rate, late-payment / NSF rate, and stable-employment percentage? A property-management company in the area should have these aggregated.
- How much new for-sale + rental construction is in the pipeline within 1–3 miles? Heavy new supply typically softens prices + rents 12–24 months out; constrained supply supports both.
Investment metrics
- 1% rule
- 1.13% ✓
- Cap rate
- 8.75%
- Cash-on-cash
- 8.79%
- DSCR
- 1.39
- GRM
- 7.3
CMA / ARV
No comps found within radius.
Projected returns pro-forma
10.0% appreciation · 3.0% rent growth · sell at horizon
- IRR
- 30.7%
- Equity multiple
- 3.41×
- Total profit
- $77,676
- Equity at exit
- $103,601
- IRR
- 26.6%
- Equity multiple
- 7.74×
- Total profit
- $216,968
- Equity at exit
- $223,420
Cash invested: $32,200 (down + closing). Projections, not guarantees.
Landlord ↔ Tenant lean methodology
- Overall (STATE)
- 83 Strongly Landlord-Friendly
- State Oklahoma
- 83 Strongly Landlord-Friendly · R+20
- County
- — inherits STATE
- City
- — inherits STATE
ZIP-level market 74740
- Home prices YoY
- 5.9%
- Active inventory
- 7
- Price-to-rent
- 7.3×
Monthly cashflow live
- Estimated rent
- $1,305 medium interval (Pro) →
- Mortgage (P&I)
- −$603
- Tax est. 1.5%
- −$144 /mo · $1,725/yr
- Insurance
- −$48
- HOA
- −$0
- Vacancy / Maint / Mgmt
- −$274
- Net cashflow
- $236
Break-even live
UW: 25.0% down · 7.5% · 30yr · 1.5% tax · 5.0% vac · 8.0% maint · 8.0% mgmt
Financing live
Cash to close
- Down payment
- $28,750
- Closing costs
- $3,450
- Reserves months
- —
- Total cash needed
- —
Loan-product check · same deal, 3 products live
Conventional
25% down · 7.5% · 30yr
- Down + closing
- —
- Monthly P&I
- —
- Monthly cashflow
- —
- DSCR
- —
- Eligible?
- —
Personal DTI + credit; lowest rate.
DSCR
20% down · 8.5% · 30yr
- Down + closing
- —
- Monthly P&I
- —
- Monthly cashflow
- —
- DSCR
- —
- Eligible?
- —
No personal income docs; deal must DSCR.
Hard money
10% down · 12.0% · 12mo
- Down + closing
- —
- Monthly P&I
- —
- Monthly cashflow
- —
- DSCR
- —
- Eligible?
- —
Short-term bridge; refi at stabilization.
Listing history 15 events
-
2026-06-18days on market $115,000 Active 23 DOM
-
2026-06-17days on market $115,000 Active 22 DOM
-
2026-06-16days on market $115,000 Active 21 DOM
-
2026-06-15days on market $115,000 Active 20 DOM
-
2026-06-13days on market $115,000 Active 18 DOM
-
2026-06-12days on market $115,000 Active 17 DOM
-
2026-06-09days on market $115,000 Active 14 DOM
-
2026-06-09days on market $115,000 Active 13 DOM
-
2026-06-08days on market $115,000 Active 12 DOM
-
2026-06-07days on market $115,000 Active 11 DOM
-
2026-06-04days on market $115,000 Active 8 DOM
-
2026-06-02days on market $115,000 Active 7 DOM
-
2026-06-01days on market $115,000 Active 6 DOM
-
2026-05-31days on market $115,000 Active 5 DOM
-
2026-05-26$115,000 Active
ⓘ Source: listings_history table (triggers on properties + properties_extension) + one-shot
backfill from property_details.listing_events for pre-trigger history.
Climate risk First Street
- Flood 3/10 Moderate FEMA zone X (unshaded) · 20% chance over 30 yrs
- Wildfire 6/10 Major
- Heat 7/10 Severe 7 d/yr ≥111°F today · 22 d/yr by 30 yrs out
- Wind 4/10 Moderate 15% chance of damaging wind over 30 yrs
- Air quality 1/10 Low 0 unhealthy d/yr today · 0 by 30 yrs out
Nearby sold comps map
Loading sold comps map…
Walkable amenities ~0.75 mi
Loading nearby amenities…
Taxation est. · year 1
- Rental income
- $15,655
- − Mortgage interest
- −$6,442
- − Property taxes
- −$1,725
- − Insurance
- −$575
- − Repairs & maintenance
- −$1,252
- − Management
- −$1,252
- − Depreciation
- −$3,345
- Taxable income
- $1,063
- Est. tax owed @ 24.0%
- −$255
- After-tax cash flow
- $2,576/yr
For passive investors: Depreciation is non-cash, so a rental often shows a tax loss while cash-flowing — sheltering income. Rental losses are passive: they offset passive income freely, and up to $25,000/yr can offset ordinary (W-2) income if you actively participate and your MAGI is under $100k (phasing out to $0 by $150k); unused losses carry forward. On sale, claimed depreciation is recaptured at up to 25%, and gains may owe capital-gains tax (a 1031 exchange can defer both). Figures are a year-1 estimate at your 24.0% rate — not tax advice; consult a CPA.
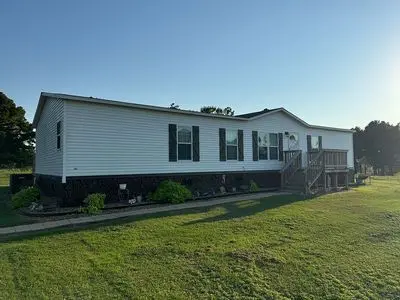
Condition & rehab AI · 2 photos
The home requires significant repairs and maintenance, particularly to the roof and exterior siding. Upgrading these areas would significantly increase its value and make it more attractive to buyers and renters.
Repairs flagged
- Major roof — The satellite image suggests potential roof damage.
- Moderate exterior siding — The siding shows signs of wear and tear.
- Major fencing — The fencing is in poor condition and needs repair or replacement.
- Minor landscaping — The landscaping is simple and could be improved with some additional plants and landscaping features.
Value-add opportunities
- Both repair roof — Repairing the roof would significantly increase the home's value and make it more attractive to buyers and renters.
- Both upgrade exterior siding — Upgrading the exterior siding would improve the home's curb appeal and increase its value.
- Both landscaping and fencing — Improving the landscaping and fencing would enhance the home's curb appeal and make it more attractive to buyers and renters.
Renovation cost estimate screening
| Repair item | Severity | Est. cost |
|---|---|---|
| roof · The satellite image suggests potential roof damage. | Major | $15,000–50,000 |
| exterior siding · The siding shows signs of wear and tear. | Moderate | $3,000–15,000 |
| fencing · The fencing is in poor condition and needs repair or replacement. | Major | $15,000–50,000 |
| landscaping · The landscaping is simple and could be improved with some additional plants and landscaping features. | Minor | $500–3,000 |
| Total estimated repair cost · 4 items | $33,500–118,000 |
Value-add ROI direction
- Both repair roof — Repairing the roof would significantly increase the home's value and make it more attractive to buyers and renters. ↑
- Both upgrade exterior siding — Upgrading the exterior siding would improve the home's curb appeal and increase its value. ↑
- Both landscaping and fencing — Improving the landscaping and fencing would enhance the home's curb appeal and make it more attractive to buyers and renters. ↑
ⓘ Cost ranges are severity-bucket heuristics (US national rule-of-thumb). Get contractor quotes + a written scope before underwriting a rehab budget.
Schools (NCES district)
- District
- Haworth
- NCES district ID
- 4014080
- Math proficiency
- 12% ▼ -11.00%
- Reading proficiency
- 22% ▼ -8.00%
- Median HH income
- $35,980
- Composite
- 14.05/100
- National rank
- #9467
- State rank
- #207 of 270 in OK
Livability — Haworth
- Score
- 50/100
- State rank
- #669
- US rank
- #25571
Category grades
Schools grade is shown separately in the Schools card above.
Census & demographics
- Population (ZIP)
- 1,953
Population outlook (McCurtain County) Hauer SSP2
- Today (2025)
- 32,668 people
- By 2030
- 32,323 · -1.1%
- By 2040
- 31,777 · -2.7%
- By 2050
- 31,436 · -3.8%
- By 2075
- 31,574 · -3.3%
- By 2100
- 30,839 · -5.6%
Race, ethnicity, and origin ACS 2023
- Neighborhood character
- Diverse neighborhood (Simpson 0.65)
- Race & ethnicity
- White 58% Native American 17% Two or more races 12% Black 10% Hispanic / Latino 3%
- Common ancestry
- Slovak 1% Iranian 1% Italian 1%
- Foreign-born
- 1% · Vietnam
- Languages at home
- 98% English-only · Spanish 1% Vietnamese 1%
Political lean MEDSL · McCurtain
- 2024 margin
- Solid R (+68.9) · D 15.0% · R 83.9% · Other 1.1%
- 2008→2024 swing
- -21.9pp toward R · 2008: -47.0pp · 2024: -68.9pp
- All cycles
- 2024: R+68.9 2020: R+66.5 2016: R+63.9 2012: R+51.6 2008: R+47.0
Not yet ingested
- Civics
- —
Market trends
- HPI YoY
- ▲ 21.07%
- Current HPI
- 376.7182
- Rent YoY
- —
- Metro
- —
- State GDP YoY
- ▲ 1.55%
- F500 in state
- 6
Industry mix (Fortune 500 HQ in OK)
| Industry | F500 HQs | Revenue |
|---|---|---|
| Energy | 3 | $48B |
|
||
Price history
1 event — show timeline
- 2026-05-26 Listed $115,000 FSBO.com
Cash-flow waterfall
monthlySold comps — $/sqft
last 12 mo · ≤1 miLoading sold comps…