 Multi-family
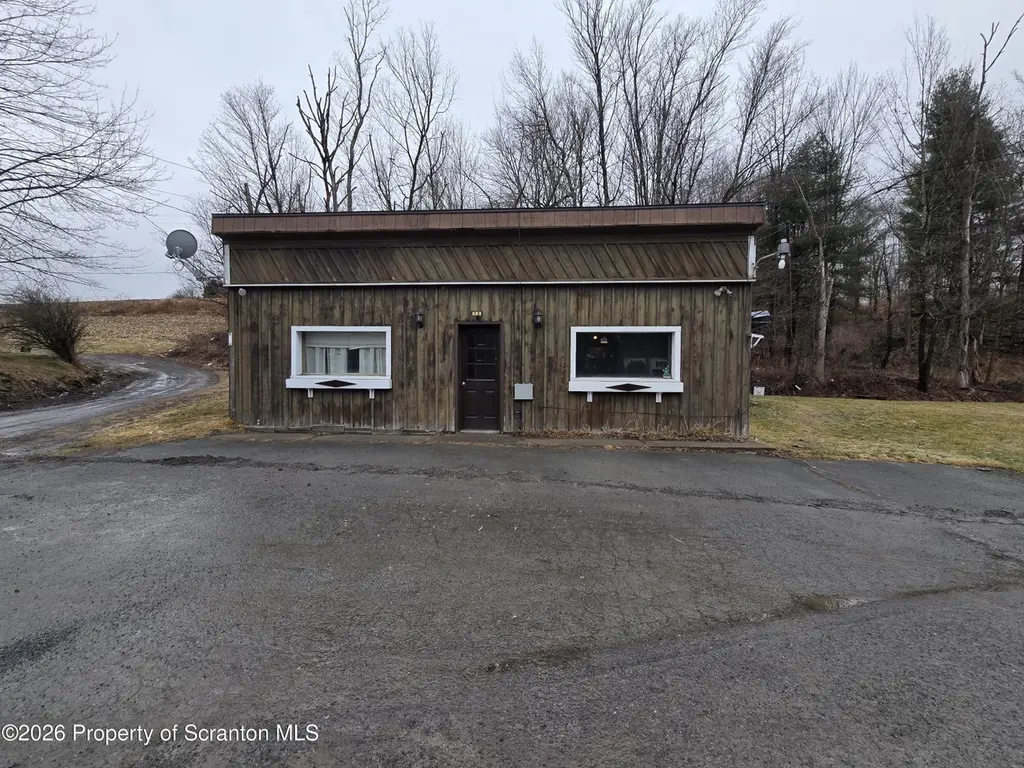
1025 Meshoppen Creek Rd · Lemon, PA
Flood risk No data
- FEMA flood zone
- —
- Chance of flooding over 30 yrs
- —
- Est. flood insurance / yr
- —
Fire risk No data
- Est. fire insurance / yr
- —
Heat risk No data
- Hot days now (above threshold)
- —
- Hot days in 30 yrs
- —
Wind risk No data
- Chance of severe wind over 30 yrs
- —
Air-quality risk No data
- Unhealthy air days now
- —
- Unhealthy air days in 30 yrs
- —
Risk factors via First Street. Map © Google.
Why this score? — see what drove the B- grade
The composite is a weighted blend of 9 inputs, each scored 0–100. Each bar is that input's sub-score; the figure is the points it added to the 100-point composite (weight × sub-score).
- Cash flow +28.9/30.0
- DSCR +10.0/10.0
- 1% rule +8.0/10.0
- ARV discount +7.5/15.0
- Appreciation +5.2/10.0
- Schools +3.1/10.0
- Rent growth +2.5/5.0
- Livability +2.5/5.0
- Condition / age +1.0/5.0
$99,900
🖨 Deal sheet 📄 Offer letter ✓ Due diligence
Multi-family units
County records classify this as Multi-Family (2-4 Unit). Listing-text estimate: 1 unit. estimate disagrees with records
Listing remarks MLS
Amazing Investment Property in the Right Location! Many recent upgrades & improvements, always rented for steady income, appliances stay, laundry & nice lawn. Get it before its gone!
Key facts
- Recent upgrades
- Nice lawn
- Appliances stay
Tags
Neighborhood map
What this means for you Summary
Snapshot
- This is a 2-bed/2.0-bath multifamily listed at $100k. Condition is rated poor.
Deal economics
- At list price, monthly cash flow is $338 ($4k/yr) — positive.
- The deal already cash-flows at list — no discount required.
- Meets the 1% rule at list price ($1k rent vs $100k).
- Recommended offer: $94k (6.0% below list) — sets the bar for market timing.
Location & tenants
- Location reads: area grade B — affects rentability + tenant quality, not the cash-flow math above.
- Tunkhannock Area SD (town): math 29% / reading 43% proficiency, ranked #397 of 539 in PA (top 74%) — families likely to look elsewhere, expect single-tenant / working-renter base with shorter leases.
- Market conditions: 5 active listings in the ZIP; 33 units permitted in Wyoming County in 2024 (0 in 5+ unit buildings).
Forward outlook
- In year one you build about $1k of equity ($691 loan paydown + $415 appreciation (0.4% local appreciation)).
- Wyoming County population projected at -23% by 2050 — secular population decline; favor cash flow + early exit over multi-decade hold.
- At projected returns (0.4% appreciation + 3.0% rent growth), your $28k cash investment doubles in ~5 years — after that, you're playing with house money.
Negotiation context
- It's been on market 86 days — a 6% lower offer ($94k) is reasonable based on typical stale-listing flexibility.
- 2 sale attempts; this cycle's ask has dropped $10k (9%) from the opening price — seller is motivated, your offer sets the floor, not the list.
Risks & watch-outs
- Watch-outs: built in 1900 — expect roof / HVAC / electrical / plumbing capex.
Questions for the listing agent
- It's been on market 86 days. Have you received any prior offers? Is the seller open to a 6% concession, seller financing, or rate buy-down credit?
- Have any recent inspections been done? Can we get a copy of the seller's disclosures and any deferred-maintenance estimates?
- Built in 1900 — when were the roof, HVAC, electrical panel, plumbing, and water heater last replaced?
- Why hasn't it sold? Are there any deal-killer items the seller is aware of (foundation, flood, title, zoning, code violations)?
- Is there a deadline driving the sale (1031 exchange, divorce, estate, relocation)? That informs how much negotiation room exists.
- What's the average days-on-market for RENTAL listings here right now (not sales)? A rising rental-DOM trend means longer vacancies and softer asking-rent achievability than the comps imply.
- What's the recent tenant-quality profile in this submarket — average credit score on applications, eviction rate, late-payment / NSF rate, and stable-employment percentage? A property-management company in the area should have these aggregated.
- How much new apartment / multifamily construction is in the pipeline within 1–3 miles? Heavy new supply (>2% of stock underway) typically softens rents 12–24 months out; light construction supports rent growth.
Investment metrics
- 1% rule
- 1.30% ✓
- Cap rate
- 10.35%
- Cash-on-cash
- 14.49%
- DSCR
- 1.64
- GRM
- 6.4
CMA / ARV
No comps found within radius.
Projected returns pro-forma
0.42% appreciation · 3.0% rent growth · sell at horizon
- IRR
- 14.9%
- Equity multiple
- 1.74×
- Total profit
- $20,583
- Equity at exit
- $31,101
- IRR
- 19.0%
- Equity multiple
- 3.18×
- Total profit
- $61,079
- Equity at exit
- $39,098
Cash invested: $27,972 (down + closing). Projections, not guarantees.
Landlord ↔ Tenant lean methodology
- Overall (STATE)
- 62 Landlord-Friendly
- State Pennsylvania
- 62 Landlord-Friendly · EVEN
- County
- — inherits STATE
- City
- — inherits STATE
ZIP-level market 18630
- Home prices YoY
- 0.3%
- Active inventory
- 5
- Price-to-rent
- 6.4×
Monthly cashflow live
- Estimated rent
- $1,302 medium interval (Pro) →
- Mortgage (P&I)
- −$524
- Tax est. 1.5%
- −$125 /mo · $1,498/yr
- Insurance
- −$42
- HOA
- −$0
- Vacancy / Maint / Mgmt
- −$273
- Net cashflow
- $338
Break-even live
UW: 25.0% down · 7.5% · 30yr · 1.5% tax · 5.0% vac · 8.0% maint · 8.0% mgmt
Financing live
Cash to close
- Down payment
- $24,975
- Closing costs
- $2,997
- Reserves months
- —
- Total cash needed
- —
Loan-product check · same deal, 3 products live
Conventional
25% down · 7.5% · 30yr
- Down + closing
- —
- Monthly P&I
- —
- Monthly cashflow
- —
- DSCR
- —
- Eligible?
- —
Personal DTI + credit; lowest rate.
DSCR
20% down · 8.5% · 30yr
- Down + closing
- —
- Monthly P&I
- —
- Monthly cashflow
- —
- DSCR
- —
- Eligible?
- —
No personal income docs; deal must DSCR.
Hard money
10% down · 12.0% · 12mo
- Down + closing
- —
- Monthly P&I
- —
- Monthly cashflow
- —
- DSCR
- —
- Eligible?
- —
Short-term bridge; refi at stabilization.
Listing history 18 events
-
2026-06-18days on market $99,900 Active 86 DOM
-
2026-06-17days on market $99,900 Active 85 DOM
-
2026-06-16days on market $99,900 Active 84 DOM
-
2026-06-15days on market $99,900 Active 83 DOM
-
2026-06-14days on market $99,900 Active 81 DOM
-
2026-06-13days on market $99,900 Active 80 DOM
-
2026-06-10days on market $99,900 Active 78 DOM
-
2026-06-09days on market $99,900 Active 77 DOM
-
2026-06-08days on market $99,900 Active 76 DOM
-
2026-06-07days on market $99,900 Active 75 DOM
-
2026-06-02days on market $99,900 Active 70 DOM
-
2026-06-01days on market $99,900 Active 69 DOM
-
2026-05-31days on market $99,900 Active 68 DOM
-
2026-05-30days on market $99,900 Active 67 DOM
-
2026-05-06status Active 194-char remark
Show marketing remark (194 chars)
Amazing Investment Property in the Right Location! Many recent upgrades & improvements, always rented for steady income, appliances stay, laundry & nice lawn. Get it before its gone!
-
2026-04-22status Pending 194-char remark
Show marketing remark (194 chars)
Amazing Investment Property in the Right Location! Many recent upgrades & improvements, always rented for steady income, appliances stay, laundry & nice lawn. Get it before its gone!
-
2026-03-31price $99,900 194-char remark
Show marketing remark (194 chars)
Amazing Investment Property in the Right Location! Many recent upgrades & improvements, always rented for steady income, appliances stay, laundry & nice lawn. Get it before its gone!
-
2026-03-10$109,900 Active 194-char remark
Show marketing remark (194 chars)
Amazing Investment Property in the Right Location! Many recent upgrades & improvements, always rented for steady income, appliances stay, laundry & nice lawn. Get it before its gone!
ⓘ Source: listings_history table (triggers on properties + properties_extension) + one-shot
backfill from property_details.listing_events for pre-trigger history.
Nearby sold comps map
Loading sold comps map…
Walkable amenities ~0.75 mi
Loading nearby amenities…
Taxation est. · year 1
- Rental income
- $15,619
- − Mortgage interest
- −$5,596
- − Property taxes
- −$1,498
- − Insurance
- −$500
- − Repairs & maintenance
- −$1,250
- − Management
- −$1,250
- − Depreciation
- −$2,906
- Taxable income
- $2,620
- Est. tax owed @ 24.0%
- −$629
- After-tax cash flow
- $3,426/yr
For passive investors: Depreciation is non-cash, so a rental often shows a tax loss while cash-flowing — sheltering income. Rental losses are passive: they offset passive income freely, and up to $25,000/yr can offset ordinary (W-2) income if you actively participate and your MAGI is under $100k (phasing out to $0 by $150k); unused losses carry forward. On sale, claimed depreciation is recaptured at up to 25%, and gains may owe capital-gains tax (a 1031 exchange can defer both). Figures are a year-1 estimate at your 24.0% rate — not tax advice; consult a CPA.
Condition & rehab AI · 13 photos
This property requires extensive repairs and updates to improve its condition and increase its value for resale and rental.
Repairs flagged
- Major roof — visible damage and tarp covering
- Major exterior siding — weathered and exposed
- Major interior walls — dated paneling and paint
- Major kitchen cabinets — dated and worn
- Major bath fixtures — dated and worn
- Major flooring — dated and worn wood
Value-add opportunities
- Both new roof — improves both resale and rental value
- Both exterior siding and paint — enhances curb appeal and value
- Both kitchen and bath updates — modernizes and increases value
- Both flooring replacement — modernizes and increases value
Renovation cost estimate screening
| Repair item | Severity | Est. cost |
|---|---|---|
| roof · visible damage and tarp covering | Major | $15,000–50,000 |
| exterior siding · weathered and exposed | Major | $15,000–50,000 |
| interior walls · dated paneling and paint | Major | $15,000–50,000 |
| kitchen cabinets · dated and worn | Major | $15,000–50,000 |
| bath fixtures · dated and worn | Major | $15,000–50,000 |
| flooring · dated and worn wood | Major | $15,000–50,000 |
| Total estimated repair cost · 6 items | $90,000–300,000 |
Value-add ROI direction
- Both new roof — improves both resale and rental value ↑
- Both exterior siding and paint — enhances curb appeal and value ↑
- Both kitchen and bath updates — modernizes and increases value ↑
- Both flooring replacement — modernizes and increases value ↑
ⓘ Cost ranges are severity-bucket heuristics (US national rule-of-thumb). Get contractor quotes + a written scope before underwriting a rehab budget.
Schools (NCES district)
- District
- Tunkhannock Area SD
- NCES district ID
- 4223850
- Math proficiency
- 29% ▼ -9.00%
- Reading proficiency
- 43% ▼ -18.00%
- Median HH income
- $51,545
- Composite
- 31.27/100
- National rank
- #6022
- State rank
- #397 of 539 in PA
Livability — Lemon
No livability data for this city. (Only ~50 U.S. cities are tracked.)
Census & demographics
- Population (ZIP)
- 3,027
Population outlook (Wyoming County) Hauer SSP2
- Today (2025)
- 26,334 people
- By 2030
- 25,225 · -4.2%
- By 2040
- 22,707 · -13.8%
- By 2050
- 20,250 · -23.1%
- By 2075
- 15,192 · -42.3%
- By 2100
- 10,961 · -58.4%
Race, ethnicity, and origin ACS 2023
- Neighborhood character
- Predominantly White (94%)
- Race & ethnicity
- White 94% Two or more races 3% Hispanic / Latino 2%
- Common ancestry
- Romanian 7% Lithuanian 3% Iranian 1%
- Foreign-born
- 1% · Canada
- Languages at home
- 98% English-only · Spanish 1%
Political lean MEDSL · Wyoming
- 2024 margin
- Solid R (+36.8) · D 31.1% · R 67.9% · Other 1.0%
- 2008→2024 swing
- -29.2pp toward R · 2008: -7.6pp · 2024: -36.8pp
- All cycles
- 2024: R+36.8 2020: R+35.2 2016: R+38.7 2012: R+12.3 2008: R+7.6
Not yet ingested
- Civics
- —
Market trends
- HPI YoY
- ▲ 0.42%
- Current HPI
- 118.1398
- Rent YoY
- —
- Metro
- —
- State GDP YoY
- ▲ 1.68%
- F500 in state
- 34
Industry mix (Fortune 500 HQ in PA)
| Industry | F500 HQs | Revenue |
|---|---|---|
| Healthcare | 2 | $309B |
|
||
| Insurance | 2 | $27B |
|
||
| Telecommunications / Media | 1 | $124B |
|
||
| Industrial Distribution | 1 | $22B |
|
||
| Financial Services | 1 | $20B |
|
||
| Chemicals / Materials | 1 | $18B |
|
||
Price history
-9.1% since first listed4 events — show timeline
- 2026-05-06 Relisted — GSBR as distributed by MLS GRID
- 2026-04-22 Pending — GSBR as distributed by MLS GRID
- 2026-03-31 Price Changed $99,900 GSBR as distributed by MLS GRID
- 2026-03-10 Listed $109,900 GSBR as distributed by MLS GRID
Cash-flow waterfall
monthlySold comps — $/sqft
last 12 mo · ≤1 miLoading sold comps…