 Triplex
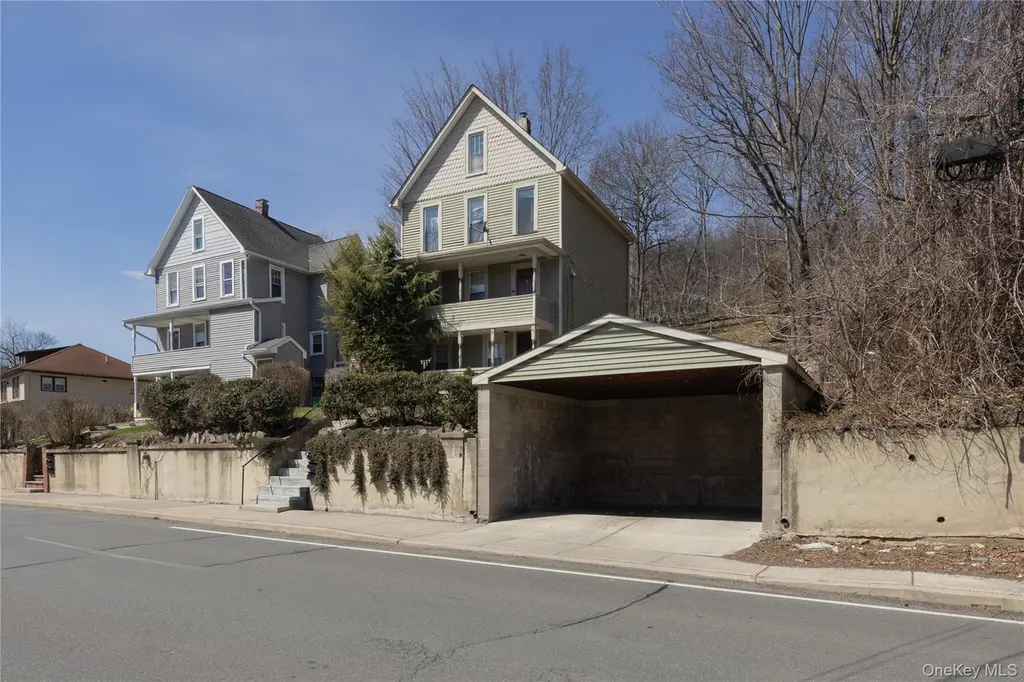
46 Wayne Ave · Suffern, NY
Flood risk 1/10 · Minimal
- FEMA flood zone
- X (unshaded)
- Chance of flooding over 30 yrs
- 0.0%
- Est. flood insurance / yr
- $473 – $860
Fire risk 4/10 · Minor
- Est. fire insurance / yr
- $691 – $1,283
Heat risk 6/10 · Moderate
- Hot days now (above 98°F)
- 7 days/yr
- Hot days in 30 yrs
- 16 days/yr
Wind risk 4/10 · Minor
- Chance of severe wind over 30 yrs
- 19.0%
Air-quality risk 3/10 · Minor
- Unhealthy air days now
- 2 days/yr
- Unhealthy air days in 30 yrs
- 3 days/yr
Risk factors via First Street. Map © Google.
Why this score? — see what drove the B+ grade
The composite is a weighted blend of 9 inputs, each scored 0–100. Each bar is that input's sub-score; the figure is the points it added to the 100-point composite (weight × sub-score).
- Cash flow +29.8/30.0
- ARV discount +15.0/15.0
- DSCR +10.0/10.0
- 1% rule +8.7/10.0
- Schools +5.1/10.0
- Livability +3.4/5.0
- Rent growth +2.5/5.0
- Condition / age +2.5/5.0
- Appreciation +0.0/10.0
$850,000
🖨 Deal sheet 📄 Offer letter ✓ Due diligence
Multi-family units
County records classify this as Multi-Family (2-4 Unit). Listing-text estimate: 3 units. confirmed
Listing remarks MLS
Whether you’re an investor seeking strong rental demand or an owner-occupant looking to offset expense, this triplex represent a compelling opportunity in one of Rockland County’s most sought after location. The home boasts plenty of off street parking, a valuable amenity in this highly desirable area. Perfectly situated just minutes from shops, dining and everyday convenience, this property also provides exceptional commuter access . It is close to the train station in Suffern, major highways, Orange County and New Jersey. *PARCEL DEAL - Must also buy lot and building at 42 & 44 Wayne.
Key facts
- Off street parking
- Commuter access
- 9,148 sq ft lot
Tags
Neighborhood map
What this means for you Summary
Snapshot
- This is a 3 × 5-bed/3.0-bath units multifamily listed at $850k.
Deal economics
- At list price, monthly cash flow is $3k ($37k/yr) — positive. Per door: $1k/mo.
- The deal already cash-flows at list — no discount required.
- Meets the 1% rule at list price ($12k rent vs $850k).
- Recommended offer: $774k (9.0% below list) — sets the bar for market timing.
- Cap rate 10.7% vs local median 3.1% in Suffern — top-decile yield for the area; either an underpriced asset or a hidden risk that comps aren't pricing in. Stress-test before assuming the spread holds.
Location & tenants
- Location reads 68/100 on livability (#546 in NY) — a middle-class / working-renter tenant base. Strengths: employment A+, housing A+, schools B; Watch: amenities F, commute F, cost of living F.
- Suffern Central School District (suburban): math 53% / reading 59% proficiency, ranked #242 of 590 in NY (top 41%) — acceptable for families but not a draw, mixed tenant base, ~2y average lease; only 18% free/reduced lunch — higher-income household profile.
- Market conditions: 225 active listings in the ZIP; 1 comparable units currently listed for rent nearby; solid renter incomes; 429 units permitted in Rockland County in 2024 (231 in 5+ unit buildings).
- At $11,626/mo this rent would consume 129% of the median local household income ($108k/yr) (locally 828% of renters already pay >50% of income on rent) — very limited rent-growth headroom before tenants either downsize or default.
Forward outlook
- Local home prices are declining (-3.0%/yr); year-one equity from $6k of loan paydown is wiped out by about $26k of value loss. Plan a longer hold.
- Rockland County population projected at +7% by 2050 — modest demand growth; plan on rents tracking national, not racing it.
- At projected returns (-3.0% appreciation + 3.0% rent growth), your $238k cash investment doubles in ~8 years — after that, you're playing with house money.
Negotiation context
- It's been on market 106 days — a 9% lower offer ($774k) is reasonable based on typical stale-listing flexibility.
- Current owner paid $550k; list at $850k implies a 55% gain — meaningful room to come down on a strong offer.
Risks & watch-outs
- Watch-outs: built in 1890 — expect roof / HVAC / electrical / plumbing capex.
- Climate carrying-cost: extreme-heat days projected 7→16/yr by 2055 (HVAC capex compounding) — expect insurance premiums to compound above CPI over the hold.
Questions for the listing agent
- It's been on market 106 days. Have you received any prior offers? Is the seller open to a 9% concession, seller financing, or rate buy-down credit?
- Can we see the unit-by-unit rent roll, current vacancy, and any below-market leases? What's the average tenancy length?
- What capital expenditures (roof, boiler, parking lot, exteriors) have been made in the last 5 years, and what's planned in the next 2?
- Built in 1890 — when were the roof, HVAC, electrical panel, plumbing, and water heater last replaced?
- Why hasn't it sold? Are there any deal-killer items the seller is aware of (foundation, flood, title, zoning, code violations)?
- Is there a deadline driving the sale (1031 exchange, divorce, estate, relocation)? That informs how much negotiation room exists.
- Schools are B-rated — typically a magnet for longer-tenancy family renters. What's the average tenant stay here, and is there a school-zone premium baked into asking?
- What's the average days-on-market for RENTAL listings here right now (not sales)? A rising rental-DOM trend means longer vacancies and softer asking-rent achievability than the comps imply.
- What's the recent tenant-quality profile in this submarket — average credit score on applications, eviction rate, late-payment / NSF rate, and stable-employment percentage? A property-management company in the area should have these aggregated.
- How much new apartment / multifamily construction is in the pipeline within 1–3 miles? Heavy new supply (>2% of stock underway) typically softens rents 12–24 months out; light construction supports rent growth.
Investment metrics
- 1% rule
- 1.37% ✓
- Cap rate
- 10.68%
- Cash-on-cash
- 15.68%
- DSCR
- 1.70
- GRM
- 6.1
CMA / ARV
- ARV (median comp)
- $1,105,837
- List price
- $850,000
- Delta
- -23.14%
- Verdict
- UNDERPRICED
- Comps
- 20 within 1.0 mi
Show comp detail 4 sales within ~0.75 mi
| Address | Dist | Beds/Ba | Sqft | Sold | Price | $/sf | Match |
|---|---|---|---|---|---|---|---|
| 78 E Maple Ave | 0.37mi | 6/2.0 (+1) | 2,087 (+2%) | 17mo | $705,000 | $338 | 56 |
| 11 Prairie Ave | 0.48mi | 5/2.0 | 1,975 (-3%) | 17mo | $699,000 | $354 | 54 |
| 88 Washington Ave | 0.47mi | 6/4.0 (+1) | 2,310 (+13%) | 1mo | $850,000 | $368 | 47 |
| 5 Brook St | 0.55mi | 4/3.5 (-1) | 2,308 (+13%) | 15mo | $662,500 | $287 | 33 |
Match score weights: distance 35% · size 25% · config 20% · recency 20%. Top-matched comps best support the ARV.
Projected returns pro-forma
-3.0% appreciation · 3.0% rent growth · sell at horizon
- IRR
- 6.5%
- Equity multiple
- 1.25×
- Total profit
- $60,598
- Equity at exit
- $126,738
- IRR
- 15.9%
- Equity multiple
- 2.30×
- Total profit
- $308,984
- Equity at exit
- $73,492
Cash invested: $238,000 (down + closing). Projections, not guarantees.
Landlord ↔ Tenant lean methodology
- Overall (STATE)
- 15 Strongly Tenant-Friendly
- State New York
- 15 Strongly Tenant-Friendly · D+10
- County
- — inherits STATE
- City
- — inherits STATE
ZIP-level market 10901
- Active inventory
- 225
- Price-to-rent
- 18.3×
Monthly cashflow live
- Estimated rent
- $11,626 medium interval (Pro) →
- Mortgage (P&I)
- −$4,457
- Tax from tax record
- −$1,264 /mo · $15,163/yr
- Insurance
- −$354
- HOA
- −$0
- Vacancy / Maint / Mgmt
- −$2,441
- Net cashflow
- $3,109
Break-even live
3-unit breakdown (identical units grouped — click to expand)
| Units | Beds | Baths | Est. rent |
|---|---|---|---|
| 3× units | 5 | 3 | $11,625 |
| #1 | 5 | 3 | $3,875 |
| #2 | 5 | 3 | $3,875 |
| #3 | 5 | 3 | $3,875 |
| Total (3 units) | $11,626 | ||
UW: 25.0% down · 7.5% · 30yr · 1.5% tax · 5.0% vac · 8.0% maint · 8.0% mgmt
Financing live
Cash to close
- Down payment
- $212,500
- Closing costs
- $25,500
- Reserves months
- —
- Total cash needed
- —
Loan-product check · same deal, 3 products live
Conventional
25% down · 7.5% · 30yr
- Down + closing
- —
- Monthly P&I
- —
- Monthly cashflow
- —
- DSCR
- —
- Eligible?
- —
Personal DTI + credit; lowest rate.
DSCR
20% down · 8.5% · 30yr
- Down + closing
- —
- Monthly P&I
- —
- Monthly cashflow
- —
- DSCR
- —
- Eligible?
- —
No personal income docs; deal must DSCR.
Hard money
10% down · 12.0% · 12mo
- Down + closing
- —
- Monthly P&I
- —
- Monthly cashflow
- —
- DSCR
- —
- Eligible?
- —
Short-term bridge; refi at stabilization.
Rent comps 1 comps
| Address | Beds | Baths | Sqft | Rent | $/sqft | DOM | Units | Dist |
|---|---|---|---|---|---|---|---|---|
| 10 Millbury St Suffern, NY | 6.0 | 2.5 | 2578 | $6,500 | $2.52 | 43d | 1 | 1.43mi |
Listing history 15 events
-
2026-06-18days on market $850,000 Active 106 DOM
-
2026-06-17days on market $850,000 Active 105 DOM
-
2026-06-16days on market $850,000 Active 104 DOM
-
2026-06-15days on market $850,000 Active 103 DOM
-
2026-06-13days on market $850,000 Active 101 DOM
-
2026-06-09days on market $850,000 Active 97 DOM
-
2026-06-08days on market $850,000 Active 96 DOM
-
2026-06-07days on market $850,000 Active 95 DOM
-
2026-06-04days on market $850,000 Active 92 DOM
-
2026-06-03days on market $850,000 Active 91 DOM
-
2026-06-02days on market $850,000 Active 90 DOM
-
2026-06-01days on market $850,000 Active 89 DOM
-
2026-05-31days on market $850,000 Active 88 DOM
-
2026-03-04$850,000 Active 609-char remark
Show marketing remark (609 chars)
Whether you’re an investor seeking strong rental demand or an owner-occupant looking to offset expense, this triplex represent a compelling opportunity in one of Rockland County’s most sought after location. The home boasts plenty of off street parking, a valuable amenity in this highly desirable area. Perfectly situated just minutes from shops, dining and everyday convenience, this property also provides exceptional commuter access . It is close to the train station in Suffern, major highways, Orange County and New Jersey. *PARCEL DEAL - Must also buy lot and building at 42 & 44 Wayne.
-
2012-10-04soldstatus $550,000
ⓘ Source: listings_history table (triggers on properties + properties_extension) + one-shot
backfill from property_details.listing_events for pre-trigger history.
Tax reassessment forecast NY · Partial reset (capped growth)
- Current annual tax
- $15,163 · $1,264/mo
- Projected year-2 tax
- $15,163 · $1,264/mo
- Expected delta
- $0/yr ($0/mo · 0.0%)
ⓘ Screening estimate from a state-policy table — verify with the county assessor before closing.
Climate risk First Street
- Flood 1/10 Low FEMA zone X (unshaded) · 0% chance over 30 yrs
- Wildfire 4/10 Moderate
- Heat 6/10 Major 7 d/yr ≥98°F today · 16 d/yr by 30 yrs out
- Wind 4/10 Moderate 19% chance of damaging wind over 30 yrs
- Air quality 3/10 Moderate 2 unhealthy d/yr today · 3 by 30 yrs out
Nearby sold comps map
Loading sold comps map…
Walkable amenities ~0.75 mi
Loading nearby amenities…
Taxation est. · year 1
- Rental income
- $139,512
- − Mortgage interest
- −$47,613
- − Property taxes
- −$15,163
- − Insurance
- −$4,250
- − Repairs & maintenance
- −$11,161
- − Management
- −$11,161
- − Depreciation
- −$24,727
- Taxable income
- $25,437
- Est. tax owed @ 24.0%
- −$6,105
- After-tax cash flow
- $31,207/yr
For passive investors: Depreciation is non-cash, so a rental often shows a tax loss while cash-flowing — sheltering income. Rental losses are passive: they offset passive income freely, and up to $25,000/yr can offset ordinary (W-2) income if you actively participate and your MAGI is under $100k (phasing out to $0 by $150k); unused losses carry forward. On sale, claimed depreciation is recaptured at up to 25%, and gains may owe capital-gains tax (a 1031 exchange can defer both). Figures are a year-1 estimate at your 24.0% rate — not tax advice; consult a CPA.
Schools (NCES district)
- District
- Suffern Central School District
- NCES district ID
- 3628320
- Math proficiency
- 53% ▼ -17.00%
- Reading proficiency
- 59% ▼ -4.00%
- Median HH income
- $85,871
- Composite
- 51.17/100
- National rank
- #1758
- State rank
- #242 of 590 in NY
Livability — Suffern
- Score
- 68/100
- State rank
- #546
- US rank
- #9788
Category grades
Schools grade is shown separately in the Schools card above.
Census & demographics
- Census place
- Suffern, NY
- County
- Rockland County · 98,828 people
- Metro
- New York-Newark-Jersey City, NY-NJ-PA
- Population (ZIP)
- 27,095
- Household income
- $108,041
- Rent vs Own
- Severe rent burden
- 828.0
Population outlook (Rockland County) Hauer SSP2
- Today (2025)
- 339,642 people
- By 2030
- 345,987 · +1.9%
- By 2040
- 357,178 · +5.2%
- By 2050
- 362,456 · +6.7%
- By 2075
- 367,281 · +8.1%
- By 2100
- 328,211 · -3.4%
Race, ethnicity, and origin ACS 2023
- Neighborhood character
- Predominantly White (69%)
- Race & ethnicity
- White 69% Hispanic / Latino 13% Black 10% Two or more races 6% Asian 5%
- Hispanic origin (detail)
- Mexican 5% Puerto Rican 3% Dominican 2%
- Common ancestry
- Romanian 8% Scotch-Irish 4% Hispanic 4%
- Foreign-born
- 18% · Canada, China, South Korea
- Languages at home
- 69% English-only · Spanish 10% German/W. Germanic 5% French/Haitian/Cajun 3%
Political lean MEDSL · Rockland
- 2024 margin
- R (+11.8) · D 44.1% · R 55.9%
- 2008→2024 swing
- -17.7pp toward R · 2008: 5.9pp · 2024: -11.8pp
- All cycles
- 2024: R+11.8 2020: D+1.7 2016: D+5.1 2012: D+6.6 2008: D+5.9
Not yet ingested
- Civics
- —
Market trends
- HPI YoY
- ▼ -582.29%
- Current HPI
- 282.4798
- Rent YoY
- —
- Metro
- New York-Newark-Jersey City, NY-NJ-PA
- State GDP YoY
- ▲ 2.60%
- F500 in state
- 92
Industry mix (Fortune 500 HQ in NY)
| Industry | F500 HQs | Revenue |
|---|---|---|
| Financial Services | 10 | $950B |
|
||
| Consumer Goods | 9 | $162B |
|
||
| Insurance | 4 | $225B |
|
||
| Telecommunications | 2 | $144B |
|
||
| Pharmaceuticals | 2 | $112B |
|
||
| Media / Entertainment | 2 | $69B |
|
||
Price history
+54.5% since first listed2 events — show timeline
- 2026-03-04 Listed $850,000 OneKey® MLS as Distributed by MLS Grid
- 2012-10-04 Sold (Public Records) $550,000 Public Records
Property tax history
+3.2%/yrLatest (2025): $15,163 · +23.5% YoY. Source: county tax records.
Cash-flow waterfall
monthlySold comps — $/sqft
last 12 mo · ≤1 miLoading sold comps…