1800 Donaldson Ave · Anthony, NM
Flood risk 1/10 · Minimal
- FEMA flood zone
- X (unshaded)
- Chance of flooding over 30 yrs
- 0.0%
- Est. flood insurance / yr
- $507 – $1,088
Fire risk 4/10 · Minor
- Est. fire insurance / yr
- $706 – $1,312
Heat risk 6/10 · Moderate
- Hot days now (above 100°F)
- 7 days/yr
- Hot days in 30 yrs
- 24 days/yr
Wind risk 1/10 · Minimal
- Chance of severe wind over 30 yrs
- —
Air-quality risk 2/10 · Minimal
- Unhealthy air days now
- 1 days/yr
- Unhealthy air days in 30 yrs
- 1 days/yr
Risk factors via First Street. Map © Google.
Why this score? — see what drove the B grade
The composite is a weighted blend of 9 inputs, each scored 0–100. Each bar is that input's sub-score; the figure is the points it added to the 100-point composite (weight × sub-score).
- Cash flow +28.7/30.0
- DSCR +10.0/10.0
- 1% rule +8.0/10.0
- ARV discount +7.5/15.0
- Appreciation +6.3/10.0
- Livability +2.7/5.0
- Rent growth +2.5/5.0
- Condition / age +2.5/5.0
- Schools +2.2/10.0
$129,000
🖨 Deal sheet 📄 Offer letter ✓ Due diligence
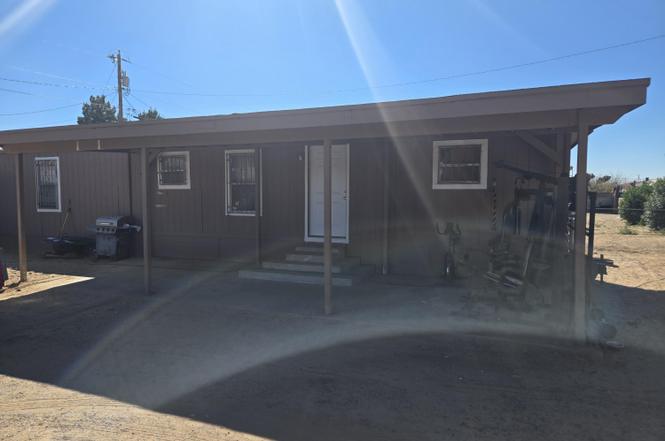
Listing remarks
Please take a moment to examine this property positioned in front of the school. It's an excellent choice for anyone looking for an entry-level home.
Key facts
- 7,980 sq ft lot
- Built 1986
- Listed 27 days
Property features AI
Finance
- HOA & community: No HOA fees
Exterior
- Utilities: No pool
- Home design: Manufactured home
- Construction: Building area about 1,036 total
- Exterior features: Skirting; Fenced yard; Shingle roof
Interior
- Kitchen: Convection oven
- Flooring: Laminate flooring
- Bathrooms: 2 full bathrooms
- Heating & cooling: Natural gas heating; Evaporative cooling
- Interior features: Pantry; Single-pane windows
Neighborhood map
What this means for you Summary
Snapshot
- This is a 3-bed/2.0-bath other listed at $129k.
Deal economics
- At list price, monthly cash flow is $430 ($5k/yr) — positive.
- The deal already cash-flows at list — no discount required.
- Meets the 1% rule at list price ($2k rent vs $129k).
- Recommended offer: $127k (1.5% below list) — sets the bar for market timing.
Location & tenants
- Location reads 53/100 on livability (#238 in NM) — a working-class tenant base; expect higher turnover. Strengths: crime A+, cost of living A+, housing A-; Watch: amenities F, commute F, employment F.
- Gadsden Independent Schools (rural): math 20% / reading 34% proficiency, ranked #21 of 29 in NM (top 72%) — low school quality limits family demand, transient renter base, plan for 1-2y turnover; 95% free/reduced lunch — lower-income household profile, screen leases tightly.
- Zoned schools: Anthony Elementary (324 students, 100% FRL); Gadsden Middle (math 10% / reading 10%, grade F, #26 of 27 statewide, top 100%, 661 students, 100% FRL); Gadsden High (math 22% / reading 37%, grade F, #78 of 110 statewide, top 74%, 1,322 students, 100% FRL) — zoned schools at 100% FRL track the district average.
- Market conditions: 54 active listings in the ZIP; 964 units permitted in Doña Ana County in 2024 (0 in 5+ unit buildings).
Forward outlook
- In year one you build about $4k of equity ($892 loan paydown + $3k appreciation (2.5% local appreciation)).
- At projected returns (2.5% appreciation + 3.0% rent growth), your $36k cash investment doubles in ~4 years — after that, you're playing with house money.
- By year 8, paydown + projected appreciation supports a ~$31k cash-out refi (75% LTV) — recoverable capital for the next deal without selling this one.
Negotiation context
- It's been on market 28 days — a 2% lower offer ($127k) is reasonable based on typical stale-listing flexibility.
- 3 sale attempts with the ask held roughly flat each time — persistent listings suggest the price (not the market) is what's stuck; bring a comps-based counter.
Risks & watch-outs
- Climate carrying-cost: extreme-heat days projected 7→24/yr by 2055 (HVAC capex compounding) — expect insurance premiums to compound above CPI over the hold.
Questions for the listing agent
- Is there a deadline driving the sale (1031 exchange, divorce, estate, relocation)? That informs how much negotiation room exists.
- Schools are F-rated, which usually means shorter tenancies and higher turnover. Who's the typical renter profile here, and what's been the actual vacancy rate?
- What's the average days-on-market for RENTAL listings here right now (not sales)? A rising rental-DOM trend means longer vacancies and softer asking-rent achievability than the comps imply.
- What's the recent tenant-quality profile in this submarket — average credit score on applications, eviction rate, late-payment / NSF rate, and stable-employment percentage? A property-management company in the area should have these aggregated.
- How much new for-sale + rental construction is in the pipeline within 1–3 miles? Heavy new supply typically softens prices + rents 12–24 months out; constrained supply supports both.
Investment metrics
- 1% rule
- 1.30% ✓
- Cap rate
- 10.29%
- Cash-on-cash
- 14.27%
- DSCR
- 1.63
- GRM
- 6.4
CMA / ARV
No comps found within radius.
Projected returns pro-forma
2.51% appreciation · 3.0% rent growth · sell at horizon
- IRR
- 19.8%
- Equity multiple
- 2.10×
- Total profit
- $39,630
- Equity at exit
- $54,503
- IRR
- 21.4%
- Equity multiple
- 3.96×
- Total profit
- $106,971
- Equity at exit
- $81,368
Cash invested: $36,120 (down + closing). Projections, not guarantees.
Landlord ↔ Tenant lean methodology
- Overall (STATE)
- 55 Moderately Landlord-Leaning
- State New Mexico
- 55 Moderately Landlord-Leaning · D+3
- County
- — inherits STATE
- City
- — inherits STATE
ZIP-level market 88021
- Home prices YoY
- 0.9%
- Active inventory
- 54
- Price-to-rent
- 6.4×
Monthly cashflow live
- Estimated rent
- $1,672 medium interval (Pro) →
- Mortgage (P&I)
- −$676
- Tax est. 1.5%
- −$161 /mo · $1,935/yr
- Insurance
- −$54
- HOA
- −$0
- Vacancy / Maint / Mgmt
- −$351
- Net cashflow
- $430
Break-even live
UW: 25.0% down · 7.5% · 30yr · 1.5% tax · 5.0% vac · 8.0% maint · 8.0% mgmt
Financing live
Cash to close
- Down payment
- $32,250
- Closing costs
- $3,870
- Reserves months
- —
- Total cash needed
- —
Loan-product check · same deal, 3 products live
Conventional
25% down · 7.5% · 30yr
- Down + closing
- —
- Monthly P&I
- —
- Monthly cashflow
- —
- DSCR
- —
- Eligible?
- —
Personal DTI + credit; lowest rate.
DSCR
20% down · 8.5% · 30yr
- Down + closing
- —
- Monthly P&I
- —
- Monthly cashflow
- —
- DSCR
- —
- Eligible?
- —
No personal income docs; deal must DSCR.
Hard money
10% down · 12.0% · 12mo
- Down + closing
- —
- Monthly P&I
- —
- Monthly cashflow
- —
- DSCR
- —
- Eligible?
- —
Short-term bridge; refi at stabilization.
Listing history 14 events
-
2026-06-19days on market $129,000 Active 28 DOM
-
2026-06-18days on market $129,000 Active 27 DOM
-
2026-06-17days on market $129,000 Active 26 DOM
-
2026-06-16days on market $129,000 Active 25 DOM
-
2026-06-15days on market $129,000 Active 24 DOM
-
2026-06-14days on market $129,000 Active 22 DOM
-
2026-06-13days on market $129,000 Active 21 DOM
-
2026-06-10days on market $129,000 Active 19 DOM
-
2026-06-09days on market $129,000 Active 18 DOM
-
2026-06-08days on market $129,000 Active 17 DOM
-
2026-06-07days on market $129,000 Active 16 DOM
-
2026-06-05days on market $129,000 Active 13 DOM
-
2026-06-02remarks 149-char remark
-
2026-06-02$129,000 Active 11 DOM
ⓘ Source: listings_history table (triggers on properties + properties_extension) + one-shot
backfill from property_details.listing_events for pre-trigger history.
Climate risk First Street
- Flood 1/10 Low FEMA zone X (unshaded) · 0% chance over 30 yrs
- Wildfire 4/10 Moderate
- Heat 6/10 Major 7 d/yr ≥100°F today · 24 d/yr by 30 yrs out
- Wind 1/10 Low
- Air quality 2/10 Low 1 unhealthy d/yr today · 1 by 30 yrs out
Nearby sold comps map
Loading sold comps map…
Walkable amenities ~0.75 mi
Loading nearby amenities…
Taxation est. · year 1
- Rental income
- $20,066
- − Mortgage interest
- −$7,226
- − Property taxes
- −$1,935
- − Insurance
- −$645
- − Repairs & maintenance
- −$1,605
- − Management
- −$1,605
- − Depreciation
- −$3,753
- Taxable income
- $3,297
- Est. tax owed @ 24.0%
- −$791
- After-tax cash flow
- $4,363/yr
For passive investors: Depreciation is non-cash, so a rental often shows a tax loss while cash-flowing — sheltering income. Rental losses are passive: they offset passive income freely, and up to $25,000/yr can offset ordinary (W-2) income if you actively participate and your MAGI is under $100k (phasing out to $0 by $150k); unused losses carry forward. On sale, claimed depreciation is recaptured at up to 25%, and gains may owe capital-gains tax (a 1031 exchange can defer both). Figures are a year-1 estimate at your 24.0% rate — not tax advice; consult a CPA.
Schools (NCES district)
- District
- Gadsden Independent Schools
- NCES district ID
- 3501080
- Math proficiency
- 20% ▼ -2.00%
- Reading proficiency
- 34% ▼ -3.00%
- Median HH income
- $28,461
- Composite
- 21.6/100
- National rank
- #8298
- State rank
- #21 of 29 in NM
Livability — Anthony
- Score
- 53/100
- State rank
- #238
- US rank
- #24342
Category grades
Schools grade is shown separately in the Schools card above.
Census & demographics
- Census place
- Anthony, NM
- Population (ZIP)
- 16,102
Population outlook (Doña Ana County) Hauer SSP2
- Today (2025)
- 219,177 people
- By 2030
- 220,967 · +0.8%
- By 2040
- 222,775 · +1.6%
- By 2050
- 223,576 · +2.0%
- By 2075
- 228,461 · +4.2%
- By 2100
- 214,536 · -2.1%
Race, ethnicity, and origin ACS 2023
- Neighborhood character
- Predominantly Hispanic (94%)
- Race & ethnicity
- Hispanic / Latino 94% Two or more races 32% White 5%
- Hispanic origin (detail)
- Mexican 87%
- Foreign-born
- 26% · Canada
- Languages at home
- 19% English-only · Spanish 81%
Political lean MEDSL · Doña Ana
- 2024 margin
- Lean D (+9.8) · D 53.8% · R 44.0% · Other 2.2%
- 2008→2024 swing
- -7.9pp toward R · 2008: 17.6pp · 2024: 9.8pp
- All cycles
- 2024: D+9.8 2020: D+18.3 2016: D+18.0 2012: D+14.9 2008: D+17.6
Not yet ingested
- Civics
- —
Market trends
- HPI YoY
- ▲ 2.51%
- Current HPI
- 278.827
- Rent YoY
- —
- Metro
- —
- State GDP YoY
- —
- F500 in state
- 0
Price history
7 events — show timeline
- 2026-06-02 Relisted — GEPARMLS
- 2026-03-31 Relisted — GEPARMLS
- 2026-03-15 Pending — GEPARMLS
- 2026-03-15 Listing Removed — GEPARMLS
- 2026-03-04 Listed $129,000 GEPARMLS
- 2025-12-02 Sold (Public Records) — Public Records
- 2014-02-06 Sold (Public Records) — Public Records
Property tax history
+2.5%/yrLatest (2025): $238 · +11.1% YoY. Source: county tax records.
Cash-flow waterfall
monthlySold comps — $/sqft
last 12 mo · ≤1 miLoading sold comps…