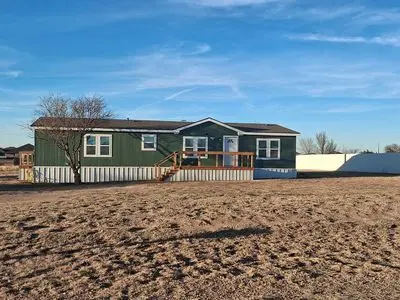
1910 County Road 7230 · Lubbock, TX
Flood risk 1/10 · Minimal
- FEMA flood zone
- X (unshaded)
- Chance of flooding over 30 yrs
- 0.0%
- Est. flood insurance / yr
- $507 – $1,088
Fire risk 3/10 · Minor
- Est. fire insurance / yr
- $1,222 – $2,270
Heat risk 5/10 · Moderate
- Hot days now (above 99°F)
- 7 days/yr
- Hot days in 30 yrs
- 21 days/yr
Wind risk 2/10 · Minimal
- Chance of severe wind over 30 yrs
- 0.0%
Air-quality risk 2/10 · Minimal
- Unhealthy air days now
- 1 days/yr
- Unhealthy air days in 30 yrs
- 1 days/yr
Risk factors via First Street. Map © Google.
Why this score? — see what drove the C- grade
The composite is a weighted blend of 9 inputs, each scored 0–100. Each bar is that input's sub-score; the figure is the points it added to the 100-point composite (weight × sub-score).
- Cash flow +19.1/30.0
- ARV discount +7.5/15.0
- DSCR +6.0/10.0
- Schools +4.8/10.0
- 1% rule +4.0/10.0
- Livability +4.0/5.0
- Rent growth +3.0/5.0
- Condition / age +2.5/5.0
- Appreciation +0.0/10.0
$180,000
🖨 Deal sheet 📄 Offer letter ✓ Due diligence
Listing remarks MLS
Investor Special or Equity Builder! Welcome to your next opportunity in Cooper ISD, where value meets potential. This 3-bedroom, 2-bathroom home sits on over half an acre—a rare find still being conveniently located "in town. " while having plenty of land to do as you please! With 1,624 sq. ft. to work with, the layout features a built-in office nook with tons of shelving, an island and breakfast bar in the kitchen, a walk-in pantry, fireplace in the living room and a spacious master suite complete with a walk-in closet, walk-in shower, standalone tub, and double vanity. This property is priced at just $90K, offering a fantastic opportunity for investors, flippers, or buyers ready to roll up their sleeves and build equity fast. Whether you're looking for your next project or a primary home with room to grow, this blank slate is ready for your vision.
Key facts
- New flooring
- Updated bathrooms
- New countertops
Tags
Neighborhood map
What this means for you Summary
Snapshot
- This is a 3-bed/2.0-bath manufactured listed at $180k.
Deal economics
- At list price, monthly cash flow is $191 ($2k/yr) — positive.
- The deal already cash-flows at list — no discount required.
- To meet the 1% rule (rent ≥ 1% of price), the offer needs to be $162k (9.8% below list).
- Recommended offer: $162k (9.8% below list) — sets the bar for 1% rule.
Location & tenants
- Location reads 80/100 on livability (#37 in TX, #1,749 nationally) — a professional / high-income tenant draw. Strengths: commute A+, cost of living A+, housing A+; Watch: employment C-, schools D+, crime F.
- Lubbock-Cooper ISD (rural): math 54% / reading 52% proficiency, ranked #98 of 826 in TX (top 12%) — acceptable for families but not a draw, mixed tenant base, ~2y average lease.
- Market conditions: Rents rising (+2.1%/yr); 663 active listings in the ZIP; 33 comparable units currently listed for rent nearby; rentals at typical pace (median 21d on market — plan ~3-4 weeks tenant-placement turnaround); solid renter incomes; 2,219 units permitted in Lubbock County in 2024 (252 in 5+ unit buildings).
Forward outlook
- Local home prices are declining (-3.0%/yr); year-one equity from $1k of loan paydown is wiped out by about $5k of value loss. Plan a longer hold.
- Lubbock County population projected at +39% by 2050 — long-run rental-demand tailwind backs the buy-and-hold thesis.
Negotiation context
- Only 9 days on market — expect competitive offers; lowballing is unlikely to land.
- 2 sale attempts with the ask held roughly flat each time — persistent listings suggest the price (not the market) is what's stuck; bring a comps-based counter.
Risks & watch-outs
- Climate carrying-cost: extreme-heat days projected 7→21/yr by 2055 (HVAC capex compounding) — expect insurance premiums to compound above CPI over the hold.
Questions for the listing agent
- Is there a deadline driving the sale (1031 exchange, divorce, estate, relocation)? That informs how much negotiation room exists.
- Schools are D-rated, which usually means shorter tenancies and higher turnover. Who's the typical renter profile here, and what's been the actual vacancy rate?
- Crime grade is F in this area — have there been break-ins, vandalism, or insurance claims at this property in the last 3 years? What carrier currently insures it and at what premium?
- What's the average days-on-market for RENTAL listings here right now (not sales)? A rising rental-DOM trend means longer vacancies and softer asking-rent achievability than the comps imply.
- What's the recent tenant-quality profile in this submarket — average credit score on applications, eviction rate, late-payment / NSF rate, and stable-employment percentage? A property-management company in the area should have these aggregated.
- How much new for-sale + rental construction is in the pipeline within 1–3 miles? Heavy new supply typically softens prices + rents 12–24 months out; constrained supply supports both.
Investment metrics
- 1% rule
- 0.90% ✗
- Cap rate
- 7.56%
- Cash-on-cash
- 4.54%
- DSCR
- 1.20
- GRM
- 9.2
CMA / ARV
No comps found within radius.
Projected returns pro-forma
-3.0% appreciation · 2.13% rent growth · sell at horizon
- IRR
- -10.1%
- Equity multiple
- 0.63×
- Total profit
- $-18,504
- Equity at exit
- $26,839
- IRR
- -2.0%
- Equity multiple
- 0.87×
- Total profit
- $-6,440
- Equity at exit
- $15,563
Cash invested: $50,400 (down + closing). Projections, not guarantees.
Landlord ↔ Tenant lean methodology
- Overall (STATE)
- 87 Strongly Landlord-Friendly
- State Texas
- 87 Strongly Landlord-Friendly · R+5
- County
- — inherits STATE
- City
- — inherits STATE
ZIP-level market 79423
- Rents YoY
- 2.1%
- Active inventory
- 663
- Price-to-rent
- 9.2×
Monthly cashflow live
- Estimated rent
- $1,624 high interval (Pro) →
- Mortgage (P&I)
- −$944
- Tax from tax record
- −$73 /mo · $878/yr
- Insurance
- −$75
- HOA
- −$0
- Vacancy / Maint / Mgmt
- −$341
- Net cashflow
- $191
Break-even live
UW: 25.0% down · 7.5% · 30yr · 1.5% tax · 5.0% vac · 8.0% maint · 8.0% mgmt
Financing live
Cash to close
- Down payment
- $45,000
- Closing costs
- $5,400
- Reserves months
- —
- Total cash needed
- —
Loan-product check · same deal, 3 products live
Conventional
25% down · 7.5% · 30yr
- Down + closing
- —
- Monthly P&I
- —
- Monthly cashflow
- —
- DSCR
- —
- Eligible?
- —
Personal DTI + credit; lowest rate.
DSCR
20% down · 8.5% · 30yr
- Down + closing
- —
- Monthly P&I
- —
- Monthly cashflow
- —
- DSCR
- —
- Eligible?
- —
No personal income docs; deal must DSCR.
Hard money
10% down · 12.0% · 12mo
- Down + closing
- —
- Monthly P&I
- —
- Monthly cashflow
- —
- DSCR
- —
- Eligible?
- —
Short-term bridge; refi at stabilization.
Rent comps 33 comps
| Address | Beds | Baths | Sqft | Rent | $/sqft | DOM | Units | Dist |
|---|---|---|---|---|---|---|---|---|
| 1717 102nd St Unit A Lubbock, TX | 3.0 | 2.0 | 1407 | $1,550 | $1.10 | 21d | 1 | 0.13mi |
| 1705 102nd St Lubbock, TX | 3.0 | 2.0 | 1487 | $1,499 | $1.01 | 44d | 1 | 0.14mi |
| 1702 102nd St Lubbock, TX | 3.0 | 2.0 | 1487 | $1,499 | $1.01 | 21d | 1 | 0.18mi |
| 2011 100th St Lubbock, TX | 4.0 | 2.0 | 1698 | $1,750 | $1.03 | 14d | 1 | 0.27mi |
| 2022 102nd St Unit B Lubbock, TX | 3.0 | 2.0 | 1500 | $1,550 | $1.03 | 14d | 1 | 0.29mi |
| 10317 Vernon Dr Lubbock, TX | 3.0 | 2.0 | 1786 | $2,800 | $1.57 | 21d | 1 | 0.30mi |
| 9803 Uvalde Ave Unit A Lubbock, TX | 2.0 | 2.0 | 1474 | $1,425 | $0.97 | 14d | 1 | 0.46mi |
| 9803 Avenue V Unit A Lubbock, TX | 3.0 | 2.0 | 1500 | $1,500 | $1.00 | 21d | 1 | 0.50mi |
| 9702 Avenue U Lubbock, TX | 3.0 | 2.0 | 1265 | $1,195 | $0.94 | 44d | 1 | 0.51mi |
| 2204 93rd St Lubbock, TX | 3.0 | 2.0 | 1258 | $1,325 | $1.05 | 13d | 1 | 0.84mi |
| 2501 111th St Lubbock, TX | 3.0 | 2.0 | 1365 | $1,475 | $1.08 | 21d | 1 | 0.90mi |
| 2530 107th Dr Lubbock, TX | 3.0 | 2.0 | 1265 | $1,449 | $1.15 | 44d | 1 | 0.93mi |
| 2510 112th St Unit A Lubbock, TX | 3.0 | 2.0 | 1365 | $1,475 | $1.08 | 21d | 1 | 0.96mi |
| 2523 110th St Lubbock, TX | 3.0 | 2.0 | 1127 | $1,500 | $1.33 | 44d | 1 | 0.97mi |
| 2518 111th St Lubbock, TX | 3.0 | 2.0 | 1400 | $1,450 | $1.04 | 21d | 1 | 0.99mi |
| 2415 93rd St Lubbock, TX | 3.0 | 2.0 | 1692 | $1,650 | $0.98 | 21d | 1 | 1.03mi |
| 2108 88th St Lubbock, TX | 4.0 | 3.0 | 2130 | $1,850 | $0.87 | 13d | 1 | 1.07mi |
| 2623 113th St Lubbock, TX | 3.0 | 2.0 | 1608 | $1,599 | $0.99 | 14d | 1 | 1.16mi |
| 2218 88th St Lubbock, TX | 3.0 | 2.0 | 1311 | $1,450 | $1.11 | 44d | 1 | 1.17mi |
| 2403 87th St Unit B Lubbock, TX | 3.0 | 2.0 | 1158 | $1,300 | $1.12 | 13d | 1 | 1.25mi |
| 2909 106th St Lubbock, TX | 4.0 | 2.0 | 1646 | $1,750 | $1.06 | 21d | 1 | 1.26mi |
| 8217 Avenue U Lubbock, TX | 1.0–2.0 | 1.0–2.0 | 873 | $1,570 | $1.80 | 13d | 28 | 1.28mi |
| 3101 99th St Unit 1 Lubbock, TX | 3.0 | 2.0 | 1694 | $1,350 | $0.80 | 44d | 1 | 1.31mi |
| 2303 84th St Lubbock, TX | 3.0 | 1.5 | 1128 | $1,100 | $0.98 | 21d | 1 | 1.36mi |
| 8108 Sherman Ave Lubbock, TX | 3.0 | 2.0 | 1306 | $1,400 | $1.07 | 44d | 1 | 1.42mi |
| 1606 82nd St Lubbock, TX | 1.0–2.0 | 1.0–2.0 | 843 | $1,580 | $1.87 | 13d | 16 | 1.45mi |
| 3102 110th St Unit B Lubbock, TX | 3.0 | 2.0 | 1200 | $1,250 | $1.04 | 21d | 1 | 1.47mi |
| 3101 110th St Unit A Lubbock, TX | 3.0 | 2.0 | 1193 | $1,225 | $1.03 | 21d | 1 | 1.48mi |
| 1118 82nd St Unit A Lubbock, TX | 3.0 | 2.0 | 1243 | $950 | $0.76 | 44d | 1 | 1.48mi |
| 1116 82nd St Unit B Lubbock, TX | 3.0 | 2.0 | 1243 | $950 | $0.76 | 44d | 1 | 1.49mi |
| 1112 82nd St Unit B Lubbock, TX | 3.0 | 2.0 | 1243 | $950 | $0.76 | 44d | 1 | 1.49mi |
| 3106 110th St Lubbock, TX | 3.0 | 2.0 | 1151 | $1,275 | $1.11 | 14d | 1 | 1.50mi |
| 1108 82nd St Unit A Lubbock, TX | 3.0 | 2.0 | 1243 | $950 | $0.76 | 44d | 1 | 1.50mi |
Listing history 8 events
-
2026-06-18days on market $180,000 Active 9 DOM
-
2026-06-17days on market $180,000 Active 8 DOM
-
2026-06-16days on market $180,000 Active 7 DOM
-
2026-06-15days on market $180,000 Active 6 DOM
-
2026-06-14days on market $180,000 Active 4 DOM
-
2026-06-13days on market $180,000 Active 3 DOM
-
2026-06-10remarks 667-char remark
-
2026-06-10$180,000 Active 1 DOM
ⓘ Source: listings_history table (triggers on properties + properties_extension) + one-shot
backfill from property_details.listing_events for pre-trigger history.
Tax reassessment forecast TX · Resets to sale price
- Current annual tax
- $878 · $73/mo
- Projected year-2 tax
- $3,294 · $274/mo
- Expected delta
- +$2,416/yr (+$201/mo · 275.2%)
ⓘ Screening estimate from a state-policy table — verify with the county assessor before closing.
Climate risk First Street
- Flood 1/10 Low FEMA zone X (unshaded) · 0% chance over 30 yrs
- Wildfire 3/10 Moderate
- Heat 5/10 Major 7 d/yr ≥99°F today · 21 d/yr by 30 yrs out
- Wind 2/10 Low 0% chance of damaging wind over 30 yrs
- Air quality 2/10 Low 1 unhealthy d/yr today · 1 by 30 yrs out
Nearby sold comps map
Loading sold comps map…
Walkable amenities ~0.75 mi
Loading nearby amenities…
Taxation est. · year 1
- Rental income
- $19,485
- − Mortgage interest
- −$10,083
- − Property taxes
- −$878
- − Insurance
- −$900
- − Repairs & maintenance
- −$1,559
- − Management
- −$1,559
- − Depreciation
- −$5,236
- Taxable loss
- −$730
- Est. tax savings @ 24.0%
- +$175
- After-tax cash flow
- $2,463/yr
For passive investors: Depreciation is non-cash, so a rental often shows a tax loss while cash-flowing — sheltering income. Rental losses are passive: they offset passive income freely, and up to $25,000/yr can offset ordinary (W-2) income if you actively participate and your MAGI is under $100k (phasing out to $0 by $150k); unused losses carry forward. On sale, claimed depreciation is recaptured at up to 25%, and gains may owe capital-gains tax (a 1031 exchange can defer both). Figures are a year-1 estimate at your 24.0% rate — not tax advice; consult a CPA.
Schools (NCES district)
- District
- Lubbock-Cooper ISD
- NCES district ID
- 4815180
- Math proficiency
- 54% ▼ -7.00%
- Reading proficiency
- 52% ▼ -3.00%
- Median HH income
- $77,347
- Composite
- 47.9/100
- National rank
- #2214
- State rank
- #98 of 826 in TX
Livability — Lubbock
- Score
- 80/100
- State rank
- #37
- US rank
- #1749
Category grades
Schools grade is shown separately in the Schools card above.
Census & demographics
- County
- Lubbock County · 293,542 people
- City population
- 283,030
- Metro
- Lubbock, TX
- Population (ZIP)
- 46,998
- Household income
- $84,933
- Rent vs Own
- Severe rent burden
- 1385.0
Population outlook (Lubbock County) Hauer SSP2
- Today (2025)
- 345,960 people
- By 2030
- 371,449 · +7.4%
- By 2040
- 424,539 · +22.7%
- By 2050
- 481,150 · +39.1%
- By 2075
- 633,467 · +83.1%
- By 2100
- 746,853 · +115.9%
Race, ethnicity, and origin ACS 2023
- Neighborhood character
- Majority White (61%)
- Race & ethnicity
- White 61% Hispanic / Latino 31% Two or more races 15% Black 4% Asian 2%
- Hispanic origin (detail)
- Mexican 26%
- Common ancestry
- Slovak 1% Italian 1% Serbian 1%
- Foreign-born
- 5% · Canada
- Languages at home
- 84% English-only · Spanish 13% Tagalog/Filipino 1% Other Asian/Pacific 1%
Political lean MEDSL · Lubbock
- 2024 margin
- Solid R (+39.5) · D 29.7% · R 69.2% · Other 1.0%
- 2008→2024 swing
- -2.8pp toward R · 2008: -36.7pp · 2024: -39.5pp
- All cycles
- 2024: R+39.5 2020: R+32.2 2016: R+38.4 2012: R+40.9 2008: R+36.7
Not yet ingested
- Civics
- —
Market trends
- HPI YoY
- ▼ -155.00%
- Current HPI
- 213.6491
- Rent YoY
- ▲ 2.13%
- Metro
- Lubbock, TX
- State GDP YoY
- ▲ 3.95%
- F500 in state
- 110
Industry mix (Fortune 500 HQ in TX)
| Industry | F500 HQs | Revenue |
|---|---|---|
| Energy | 16 | $1,198B |
|
||
| Technology | 5 | $198B |
|
||
| Engineering / Construction | 4 | $72B |
|
||
| Energy Services | 3 | $60B |
|
||
| Utilities | 3 | $41B |
|
||
| Healthcare | 2 | $330B |
|
||
Price history
+80.0% since first listed6 events — show timeline
- 2026-06-09 Listed $180,000 FSBO.com
- 2025-09-04 Sold (MLS) — LARMLS
- 2025-08-26 Pending — LARMLS
- 2025-08-14 Price Changed $90,000 LARMLS
- 2025-07-29 Listed $100,000 LARMLS
- 2022-12-01 Sold (Public Records) — Public Records
Property tax history
+1.9%/yrLatest (2025): $878 · +64.0% YoY. Source: county tax records.
Cash-flow waterfall
monthlySold comps — $/sqft
last 12 mo · ≤1 miLoading sold comps…