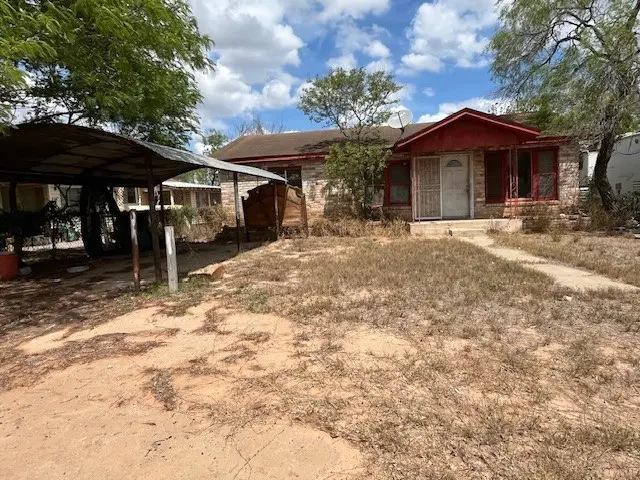
310 W Tilley St · Hebbronville, TX
Flood risk 1/10 · Minimal
- FEMA flood zone
- —
- Chance of flooding over 30 yrs
- 0.0%
- Est. flood insurance / yr
- —
Fire risk 5/10 · Moderate
- Est. fire insurance / yr
- $1,222 – $2,270
Heat risk 9/10 · Severe
- Hot days now (above 111°F)
- 7 days/yr
- Hot days in 30 yrs
- 19 days/yr
Wind risk 8/10 · Major
- Chance of severe wind over 30 yrs
- 93.0%
Air-quality risk 1/10 · Minimal
- Unhealthy air days now
- 0 days/yr
- Unhealthy air days in 30 yrs
- 0 days/yr
Risk factors via First Street. Map © Google.
Why this score? — see what drove the A- grade
The composite is a weighted blend of 9 inputs, each scored 0–100. Each bar is that input's sub-score; the figure is the points it added to the 100-point composite (weight × sub-score).
- Cash flow +30.0/30.0
- ARV discount +15.0/15.0
- 1% rule +10.0/10.0
- DSCR +10.0/10.0
- Appreciation +4.5/10.0
- Livability +3.1/5.0
- Schools +2.6/10.0
- Rent growth +2.5/5.0
- Condition / age +2.5/5.0
$39,500
🖨 Deal sheet 📄 Offer letter ✓ Due diligence
Listing remarks
3-bedroom, 1-bath home situated on a spacious lot. This property features pier-and-beam construction with a brick exterior, offering classic durability and easy maintenance. A one-car carport provides convenient covered parking. In the back, you’ll find a separate building previously used as a beauty shop—perfect for storage, a hobby space, or potential conversion depending on your needs. A solid opportunity for homeowners or investors looking for a versatile property with room to grow.
Key facts
- Brick exterior
- Separate building
- One-car carport
Tags
Property features AI
Exterior
- Parking: Carport; Detached parking; Front entry parking; On-street parking; Total of 1 parking space
- Utilities: Public water available; Public sewer available
- Home design: Single-story home
- Construction: Brick and wood siding exterior; Shingle roof; Pillar/post/pier foundation
- Exterior features: Storage building/area; Chain link and partial fencing; Interior lot; All-weather road and city street frontage; Lot dimensions approximately 50' x 140'
Interior
- Flooring: Hardwood; Tile; Vinyl
- Bathrooms: 1 full bathroom
- Interior features: Primary bedroom located on the downstairs level; Hardwood, tile, and vinyl flooring
- Laundry & utility: Washer hookup; Dryer hookup
Neighborhood map
What this means for you Summary
Snapshot
- This is a 3-bed/1.0-bath single-family listed at $40k.
Deal economics
- At list price, monthly cash flow is $322 ($4k/yr) — positive.
- The deal already cash-flows at list — no discount required.
- Meets the 1% rule at list price ($836 rent vs $40k).
- Recommended offer: $38k (3.0% below list) — sets the bar for market timing.
Location & tenants
- Location reads 61/100 on livability (#1,032 in TX) — a middle-class / working-renter tenant base. Strengths: cost of living A+, housing A+; Watch: crime D+, schools D-, amenities F.
- Jim Hogg County ISD (town): math 31% / reading 31% proficiency, ranked #622 of 826 in TX (top 75%) — families likely to look elsewhere, expect single-tenant / working-renter base with shorter leases.
- Market conditions: 36 active listings in the ZIP.
Forward outlook
- Local home prices are declining (-0.9%/yr); year-one equity from $273 of loan paydown is wiped out by about $377 of value loss. Plan a longer hold.
- Jim Hogg County population projected at -10% by 2050 — secular population decline; favor cash flow + early exit over multi-decade hold.
- At projected returns (-0.9% appreciation + 3.0% rent growth), your $11k cash investment doubles in ~3 years — after that, you're playing with house money.
Negotiation context
- It's been on market 56 days — a 3% lower offer ($38k) is reasonable based on typical stale-listing flexibility.
Risks & watch-outs
- Watch-outs: property tax is 3.5% of price.
- Climate carrying-cost: severe wind risk, 93% chance of damaging wind over 30y; moderate wildfire risk; extreme-heat days projected 7→19/yr by 2055 (HVAC capex compounding) — expect insurance premiums to compound above CPI over the hold.
Questions for the listing agent
- It's been on market 56 days. Have you received any prior offers? Is the seller open to a 3% concession, seller financing, or rate buy-down credit?
- Built in 1964 — when were the roof, HVAC, electrical panel, plumbing, and water heater last replaced?
- Property tax is high relative to price — has the assessment been appealed recently, and will the sale trigger a re-assessment?
- Is there a deadline driving the sale (1031 exchange, divorce, estate, relocation)? That informs how much negotiation room exists.
- Schools are D-rated, which usually means shorter tenancies and higher turnover. Who's the typical renter profile here, and what's been the actual vacancy rate?
- Crime grade is D in this area — have there been break-ins, vandalism, or insurance claims at this property in the last 3 years? What carrier currently insures it and at what premium?
- What's the average days-on-market for RENTAL listings here right now (not sales)? A rising rental-DOM trend means longer vacancies and softer asking-rent achievability than the comps imply.
- What's the recent tenant-quality profile in this submarket — average credit score on applications, eviction rate, late-payment / NSF rate, and stable-employment percentage? A property-management company in the area should have these aggregated.
- How much new for-sale + rental construction is in the pipeline within 1–3 miles? Heavy new supply typically softens prices + rents 12–24 months out; constrained supply supports both.
Investment metrics
- 1% rule
- 2.12% ✓
- Cap rate
- 16.06%
- Cash-on-cash
- 34.88%
- DSCR
- 2.55
- GRM
- 3.9
CMA / ARV
- ARV (median comp)
- $57,157
- List price
- $39,500
- Delta
- -30.89%
- Verdict
- UNDERPRICED
- Comps
- 15 within 1.0 mi
Show comp detail 5 sales within ~0.75 mi
| Address | Dist | Beds/Ba | Sqft | Sold | Price | $/sf | Match |
|---|---|---|---|---|---|---|---|
| 303 E Texas St | 0.37mi | 3/2.0 | 957 (-2%) | 1mo | $54,900 | $57 | 75 |
| 103 E David St | 0.64mi | 2/1.0 (-1) | 1,072 (+10%) | 4mo | $42,500 | $40 | 45 |
| 711 Marcos Hinojosa Ave | 0.71mi | 3/1.0 | 874 (-10%) | 8mo | $50,000 | $57 | 43 |
| 1001 N Elm Ave | 0.62mi | 2/1.5 (-1) | 856 (-12%) | 2mo | $49,500 | $58 | 42 |
| 402 E Kohler St | 0.73mi | 2/2.0 (-1) | 920 (-6%) | 14mo | $78,500 | $85 | 36 |
Match score weights: distance 35% · size 25% · config 20% · recency 20%. Top-matched comps best support the ARV.
Projected returns pro-forma
-0.95% appreciation · 3.0% rent growth · sell at horizon
- IRR
- 34.1%
- Equity multiple
- 2.59×
- Total profit
- $17,635
- Equity at exit
- $9,619
- IRR
- 38.6%
- Equity multiple
- 5.09×
- Total profit
- $45,238
- Equity at exit
- $10,173
Cash invested: $11,060 (down + closing). Projections, not guarantees.
Landlord ↔ Tenant lean methodology
- Overall (STATE)
- 87 Strongly Landlord-Friendly
- State Texas
- 87 Strongly Landlord-Friendly · R+5
- County
- — inherits STATE
- City
- — inherits STATE
ZIP-level market 78361
- Home prices YoY
- -0.9%
- Active inventory
- 36
- Price-to-rent
- 3.9×
Monthly cashflow live
- Estimated rent
- $836 medium interval (Pro) →
- Mortgage (P&I)
- −$207
- Tax from tax record
- −$115 /mo · $1,380/yr
- Insurance
- −$16
- HOA
- −$0
- Vacancy / Maint / Mgmt
- −$175
- Net cashflow
- $322
Break-even live
UW: 25.0% down · 7.5% · 30yr · 1.5% tax · 5.0% vac · 8.0% maint · 8.0% mgmt
Financing live
Cash to close
- Down payment
- $9,875
- Closing costs
- $1,185
- Reserves months
- —
- Total cash needed
- —
Loan-product check · same deal, 3 products live
Conventional
25% down · 7.5% · 30yr
- Down + closing
- —
- Monthly P&I
- —
- Monthly cashflow
- —
- DSCR
- —
- Eligible?
- —
Personal DTI + credit; lowest rate.
DSCR
20% down · 8.5% · 30yr
- Down + closing
- —
- Monthly P&I
- —
- Monthly cashflow
- —
- DSCR
- —
- Eligible?
- —
No personal income docs; deal must DSCR.
Hard money
10% down · 12.0% · 12mo
- Down + closing
- —
- Monthly P&I
- —
- Monthly cashflow
- —
- DSCR
- —
- Eligible?
- —
Short-term bridge; refi at stabilization.
Listing history 15 events
-
2026-06-18days on market $39,500 Active 56 DOM
-
2026-06-17days on market $39,500 Active 55 DOM
-
2026-06-16days on market $39,500 Active 54 DOM
-
2026-06-15days on market $39,500 Active 53 DOM
-
2026-06-13days on market $39,500 Active 51 DOM
-
2026-06-12days on market $39,500 Active 50 DOM
-
2026-06-10days on market $39,500 Active 47 DOM
-
2026-06-08days on market $39,500 Active 46 DOM
-
2026-06-08days on market $39,500 Active 45 DOM
-
2026-06-05days on market $39,500 Active 43 DOM
-
2026-06-03days on market $39,500 Active 41 DOM
-
2026-06-02days on market $39,500 Active 40 DOM
-
2026-06-01days on market $39,500 Active 39 DOM
-
2026-05-31days on market $39,500 Active 38 DOM
-
2026-04-22$39,500 Active 503-char remark
ⓘ Source: listings_history table (triggers on properties + properties_extension) + one-shot
backfill from property_details.listing_events for pre-trigger history.
Tax reassessment forecast TX · Resets to sale price
- Current annual tax
- $1,380 · $115/mo
- Projected year-2 tax
- $1,380 · $115/mo
- Expected delta
- $0/yr ($0/mo · 0.0%)
ⓘ Screening estimate from a state-policy table — verify with the county assessor before closing.
Climate risk First Street
- Flood 1/10 Low 0% chance over 30 yrs
- Wildfire 5/10 Major
- Heat 9/10 Extreme 7 d/yr ≥111°F today · 19 d/yr by 30 yrs out
- Wind 8/10 Severe 93% chance of damaging wind over 30 yrs
- Air quality 1/10 Low 0 unhealthy d/yr today · 0 by 30 yrs out
Nearby sold comps map
Loading sold comps map…
Walkable amenities ~0.75 mi
Loading nearby amenities…
Taxation est. · year 1
- Rental income
- $10,027
- − Mortgage interest
- −$2,213
- − Property taxes
- −$1,380
- − Insurance
- −$198
- − Repairs & maintenance
- −$802
- − Management
- −$802
- − Depreciation
- −$1,149
- Taxable income
- $3,483
- Est. tax owed @ 24.0%
- −$836
- After-tax cash flow
- $3,022/yr
For passive investors: Depreciation is non-cash, so a rental often shows a tax loss while cash-flowing — sheltering income. Rental losses are passive: they offset passive income freely, and up to $25,000/yr can offset ordinary (W-2) income if you actively participate and your MAGI is under $100k (phasing out to $0 by $150k); unused losses carry forward. On sale, claimed depreciation is recaptured at up to 25%, and gains may owe capital-gains tax (a 1031 exchange can defer both). Figures are a year-1 estimate at your 24.0% rate — not tax advice; consult a CPA.
Schools (NCES district)
- District
- Jim Hogg County ISD
- NCES district ID
- 4824750
- Math proficiency
- 31% ▼ -15.00%
- Reading proficiency
- 31% ▼ -2.00%
- Median HH income
- $35,870
- Composite
- 25.69/100
- National rank
- #7391
- State rank
- #622 of 826 in TX
Livability — Hebbronville
- Score
- 61/100
- State rank
- #1032
- US rank
- #18361
Category grades
Schools grade is shown separately in the Schools card above.
Census & demographics
- Census place
- Hebbronville, TX
- Population (ZIP)
- 4,764
Population outlook (Jim Hogg County) Hauer SSP2
- Today (2025)
- 5,023 people
- By 2030
- 4,897 · -2.5%
- By 2040
- 4,722 · -6.0%
- By 2050
- 4,510 · -10.2%
- By 2075
- 3,827 · -23.8%
- By 2100
- 2,794 · -44.4%
Race, ethnicity, and origin ACS 2023
- Neighborhood character
- Predominantly Hispanic (78%)
- Race & ethnicity
- Hispanic / Latino 78% Two or more races 40% White 21%
- Hispanic origin (detail)
- Mexican 76%
- Foreign-born
- 1% · Canada
- Languages at home
- 41% English-only · Spanish 58% Tagalog/Filipino 1%
Political lean MEDSL · Jim Hogg
- 2024 margin
- Lean D (+8.3) · D 54.0% · R 45.7%
- 2008→2024 swing
- -39.3pp toward R · 2008: 47.6pp · 2024: 8.3pp
- All cycles
- 2024: D+8.3 2020: D+17.9 2016: D+56.9 2012: D+56.7 2008: D+47.6
Not yet ingested
- Civics
- —
Market trends
- HPI YoY
- ▼ -0.95%
- Current HPI
- 99.0946
- Rent YoY
- —
- Metro
- —
- State GDP YoY
- ▲ 3.95%
- F500 in state
- 110
Industry mix (Fortune 500 HQ in TX)
| Industry | F500 HQs | Revenue |
|---|---|---|
| Energy | 16 | $1,198B |
|
||
| Technology | 5 | $198B |
|
||
| Engineering / Construction | 4 | $72B |
|
||
| Energy Services | 3 | $60B |
|
||
| Utilities | 3 | $41B |
|
||
| Healthcare | 2 | $330B |
|
||
Price history
1 event — show timeline
- 2026-04-22 Listed $39,500 CBMLS
Property tax history
+5.8%/yrLatest (2025): $1,380 · -3.2% YoY. Source: county tax records.
Cash-flow waterfall
monthlySold comps — $/sqft
last 12 mo · ≤1 miLoading sold comps…