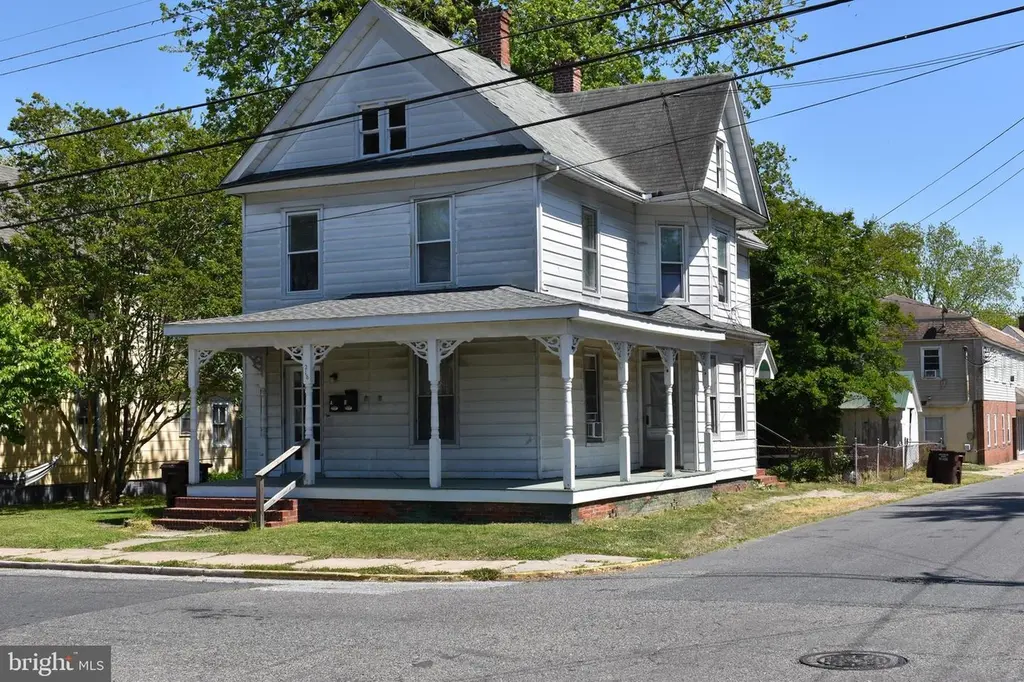
218 W End Ave · Cambridge, MD
Flood risk 1/10 · Minimal
- FEMA flood zone
- X (unshaded)
- Chance of flooding over 30 yrs
- 0.0%
- Est. flood insurance / yr
- $507 – $1,088
Fire risk 2/10 · Minimal
- Est. fire insurance / yr
- $755 – $1,403
Heat risk 9/10 · Severe
- Hot days now (above 105°F)
- 7 days/yr
- Hot days in 30 yrs
- 16 days/yr
Wind risk 6/10 · Moderate
- Chance of severe wind over 30 yrs
- 70.0%
Air-quality risk 3/10 · Minor
- Unhealthy air days now
- 2 days/yr
- Unhealthy air days in 30 yrs
- 3 days/yr
Risk factors via First Street. Map © Google.
Why this score? — see what drove the C- grade
The composite is a weighted blend of 9 inputs, each scored 0–100. Each bar is that input's sub-score; the figure is the points it added to the 100-point composite (weight × sub-score).
- Cash flow +26.4/30.0
- DSCR +9.0/10.0
- 1% rule +6.5/10.0
- Livability +3.2/5.0
- Rent growth +2.5/5.0
- Condition / age +2.5/5.0
- Schools +1.5/10.0
- ARV discount +0.0/15.0
- Appreciation +0.0/10.0
$210,000
🖨 Deal sheet (PDF) 📄 Offer letter ✓ Due diligence
Listing remarks
Victorian Duplex Investment Opportunity in Historic Cambridge, MD – Value-Add Cash Flow Potential! This classic Victorian home in Cambridge’s historic district is currently configured as a duplex and offers a strong value-add investment for investors looking to create immediate and long-term cash flow on Maryland’s Eastern Shore. The property features two separately metered units with private entrances. Unit 1 includes 2 bedrooms and 1 bath, while Unit 2 offers 2 bedrooms and 1 bath. While the home requires some updates, it presents an excellent opportunity in a solid rental market.
Key facts
- Victorian duplex
- Private entrances
- Strong rental market
Tags
Property features AI
Finance
- Other: Fee simple ownership; Two total units; Above-grade finished area approximately 2,017 (estimated)
Exterior
- Parking: On-street parking; Off-street parking; Garage(s)
- Utilities: 200+ amp electric service; Public water; Public sewer
- Home design: Detached structure; Architectural shingle roof; Vinyl siding; Double-pane windows
- Construction: Vinyl siding construction; Architectural shingle roof; Foundation: Other; Utility building on site
- Exterior features: Outbuilding(s); Sidewalks; Corner lot
Interior
- Kitchen: Refrigerator; Six-burner stove; Stove
- Bedrooms: Two 2-bedroom units (multi-family)
- Flooring: Carpet; Hardwood
- Heating & cooling: Hot water: Electric
- Interior features: Drywall interior walls and ceilings; Other interior features
Neighborhood map
What this means for you Summary
Snapshot
- This is a 4-bed/2.0-bath single-family listed at $210k.
Deal economics
- At list price, monthly cash flow is $549 ($7k/yr) — positive.
- The deal already cash-flows at list — no discount required.
- Meets the 1% rule at list price ($2k rent vs $210k).
- Recommended offer: $204k (3.0% below list) — sets the bar for market timing.
- Cap rate 9.4% vs local median 4.2% in Cambridge — top-decile yield for the area; either an underpriced asset or a hidden risk that comps aren't pricing in. Stress-test before assuming the spread holds.
Location & tenants
- Location reads 65/100 on livability (#255 in MD) — a middle-class / working-renter tenant base. Strengths: cost of living A+, health & safety A+, housing B+; Watch: amenities D, schools F, crime F.
- Dorchester County Public Schools (rural): math 10% / reading 23% proficiency, ranked #23 of 24 in MD (top 96%) — low school quality limits family demand, transient renter base, plan for 1-2y turnover.
- Market conditions: 294 active listings in the ZIP; 3 comparable units currently listed for rent nearby; rentals lingering (median 44d on market — plan ~5-8 weeks vacancy on turnover, expect pricing pressure); 100% of comp listings sitting > 30 days — soft ceiling on asking rent; 81 units permitted in Dorchester County in 2024 (0 in 5+ unit buildings).
Forward outlook
- Local home prices are declining (-3.0%/yr); year-one equity from $1k of loan paydown is wiped out by about $6k of value loss. Plan a longer hold.
- Dorchester County population projected to shrink 10% by 2050 — rents likely to lag national; underwrite the cash flow, not the appreciation.
- At projected returns (-3.0% appreciation + 3.0% rent growth), your $59k cash investment doubles in ~10 years — after that, you're playing with house money.
Negotiation context
- It's been on market 43 days — a 3% lower offer ($204k) is reasonable based on typical stale-listing flexibility.
- 2 sale attempts since 5y ago with the ask held roughly flat each time — persistent listings suggest the price (not the market) is what's stuck; bring a comps-based counter.
- Current owner paid $72k; list at $210k implies a 190% gain — meaningful room to come down on a strong offer.
Risks & watch-outs
- Watch-outs: built in 1914 — expect roof / HVAC / electrical / plumbing capex.
- Climate carrying-cost: major wind risk, 70% chance of damaging wind over 30y; extreme-heat days projected 7→16/yr by 2055 (HVAC capex compounding) — expect insurance premiums to compound above CPI over the hold.
Questions for the listing agent
- It's been on market 43 days. Have you received any prior offers? Is the seller open to a 3% concession, seller financing, or rate buy-down credit?
- Built in 1914 — when were the roof, HVAC, electrical panel, plumbing, and water heater last replaced?
- Is there a deadline driving the sale (1031 exchange, divorce, estate, relocation)? That informs how much negotiation room exists.
- Schools are F-rated, which usually means shorter tenancies and higher turnover. Who's the typical renter profile here, and what's been the actual vacancy rate?
- Crime grade is F in this area — have there been break-ins, vandalism, or insurance claims at this property in the last 3 years? What carrier currently insures it and at what premium?
- What's the average days-on-market for RENTAL listings here right now (not sales)? A rising rental-DOM trend means longer vacancies and softer asking-rent achievability than the comps imply.
- What's the recent tenant-quality profile in this submarket — average credit score on applications, eviction rate, late-payment / NSF rate, and stable-employment percentage? A property-management company in the area should have these aggregated.
- How much new for-sale + rental construction is in the pipeline within 1–3 miles? Heavy new supply typically softens prices + rents 12–24 months out; constrained supply supports both.
Investment metrics
- 1% rule
- 1.15% ✓
- Cap rate
- 9.43%
- Cash-on-cash
- 11.20%
- DSCR
- 1.50
- GRM
- 7.2
CMA / ARV
- ARV (median comp)
- $166,314
- List price
- $210,000
- Delta
- 26.27%
- Verdict
- OVERPRICED
- Comps
- 13 within 1.0 mi
Show comp detail 12 sales within ~0.75 mi
| Address | Dist | Beds/Ba | Sqft | Sold | Price | $/sf | Match |
|---|---|---|---|---|---|---|---|
| 123 Choptank Ave | 0.09mi | 5/2.0 (+1) | 2,097 (+4%) | 1mo | $85,000 | $41 | 83 |
| 306 Oakley St | 0.12mi | 4/2.0 | 1,905 (-6%) | 6mo | $415,000 | $218 | 80 |
| 109 Willis St | 0.16mi | 3/2.5 (-1) | 2,032 (+1%) | 6mo | $295,000 | $145 | 79 |
| 113 Talbot Ave | 0.40mi | 4/2.0 | 1,953 (-3%) | 5mo | $200,000 | $102 | 72 |
| 5 Willis St | 0.22mi | 3/2.0 (-1) | 1,863 (-8%) | 1mo | $270,000 | $145 | 71 |
| 107 W End Ave | 0.16mi | 3/2.0 (-1) | 1,836 (-9%) | 4mo | $275,000 | $150 | 69 |
| 210 Choptank Ave | 0.06mi | 3/1.5 (-1) | 1,744 (-14%) | 2mo | $245,000 | $140 | 66 |
| 417 Talbot Ave | 0.49mi | 4/2.5 | 2,112 (+5%) | 6mo | $375,000 | $178 | 62 |
| 107 Somerset Ave | 0.49mi | 4/2.0 | 1,900 (-6%) | 8mo | $389,900 | $205 | 60 |
| 412 Talbot Ave | 0.45mi | 3/2.0 (-1) | 1,809 (-10%) | 7mo | $325,000 | $180 | 51 |
| 314 Muir St | 0.57mi | 3/1.5 (-1) | 1,796 (-11%) | 1mo | $76,500 | $43 | 47 |
| 601 Edlon Park Dr | 0.70mi | 3/2.5 (-1) | 1,860 (-8%) | 3mo | $270,000 | $145 | 45 |
Match score weights: distance 35% · size 25% · config 20% · recency 20%. Top-matched comps best support the ARV.
Projected returns pro-forma
-3.0% appreciation · 3.0% rent growth · sell at horizon
- IRR
- 0.4%
- Equity multiple
- 1.02×
- Total profit
- $913
- Equity at exit
- $31,312
- IRR
- 10.0%
- Equity multiple
- 1.78×
- Total profit
- $45,738
- Equity at exit
- $18,157
Cash invested: $58,800 (down + closing). Projections, not guarantees.
Landlord ↔ Tenant lean methodology
- Overall (STATE)
- 27 Tenant-Leaning
- State Maryland
- 27 Tenant-Leaning · D+14
- County
- — inherits STATE
- City
- — inherits STATE
ZIP-level market 21613
- Home prices YoY
- -25.1%
- Active inventory
- 294
- Price-to-rent
- 7.2×
Monthly cashflow live
- Estimated rent
- $2,419 medium interval (Pro) →
- Mortgage (P&I)
- −$1,101
- Tax from tax record
- −$173 /mo · $2,081/yr
- Insurance
- −$88
- HOA
- −$0
- Vacancy / Maint / Mgmt
- −$508
- Net cashflow
- $549
Break-even live
Sensitivity live
| Price | -10% $668 | -5% $608 | +0% $549 | +5% $489 | +10% $430 |
|---|---|---|---|---|---|
| Rent | -10% $358 | -5% $453 | +0% $549 | +5% $644 | +10% $740 |
| Rate | -1.0pp $655 | -0.5pp $602 | base $549 | +0.5pp $494 | +1.0pp $439 |
UW: 25.0% down · 7.5% · 30yr · 1.5% tax · 5.0% vac · 8.0% maint · 8.0% mgmt
Financing live
Cash to close
- Down payment
- $52,500
- Closing costs
- $6,300
- Reserves months
- —
- Total cash needed
- —
Loan-product check · same deal, 3 products live
Conventional
25% down · 7.5% · 30yr
- Down + closing
- —
- Monthly P&I
- —
- Monthly cashflow
- —
- DSCR
- —
- Eligible?
- —
Personal DTI + credit; lowest rate.
DSCR
20% down · 8.5% · 30yr
- Down + closing
- —
- Monthly P&I
- —
- Monthly cashflow
- —
- DSCR
- —
- Eligible?
- —
No personal income docs; deal must DSCR.
Hard money
10% down · 12.0% · 12mo
- Down + closing
- —
- Monthly P&I
- —
- Monthly cashflow
- —
- DSCR
- —
- Eligible?
- —
Short-term bridge; refi at stabilization.
Rent comps 3 comps
| Address | Beds | Baths | Sqft | Rent | $/sqft | DOM | Units | Dist |
|---|---|---|---|---|---|---|---|---|
| 414 Waterfield Ct Cambridge, MD | 3.0 | 2.5 | 2000 | $2,395 | $1.20 | 44d | 1 | 0.66mi |
| 401 N Seaway Ct Cambridge, MD | 3.0 | 2.5 | 1867 | $2,600 | $1.39 | 44d | 1 | 0.76mi |
| 318 E Appleby Ave Cambridge, MD | 3.0 | 2.5 | 1536 | $2,100 | $1.37 | 44d | 1 | 1.33mi |
Listing history 21 events
-
2026-06-21days on market $210,000 Active 43 DOM
-
2026-06-18days on market $210,000 Active 41 DOM
-
2026-06-17days on market $210,000 Active 40 DOM
-
2026-06-16days on market $210,000 Active 39 DOM
-
2026-06-15days on market $210,000 Active 38 DOM
-
2026-06-13days on market $210,000 Active 36 DOM
-
2026-06-12days on market $210,000 Active 35 DOM
-
2026-06-09days on market $210,000 Active 32 DOM
-
2026-06-08days on market $210,000 Active 31 DOM
-
2026-06-07days on market $210,000 Active 30 DOM
-
2026-06-07days on market $210,000 Active 29 DOM
-
2026-06-04days on market $210,000 Active 26 DOM
-
2026-06-02days on market $210,000 Active 25 DOM
-
2026-06-01days on market $210,000 Active 24 DOM
-
2026-05-31days on market $210,000 Active 23 DOM
-
2026-05-31days on market $210,000 Active 22 DOM
-
2026-05-08$210,000 Active 608-char remark
-
2022-05-09historical
-
2021-11-29price $194,500
-
2021-11-09$209,500 Active
-
1989-12-27soldstatus $72,500
ⓘ Source: listings_history table (triggers on properties + properties_extension) + one-shot
backfill from property_details.listing_events for pre-trigger history.
Tax reassessment forecast MD · Partial reset (capped growth)
- Current annual tax
- $2,081 · $173/mo
- Projected year-2 tax
- $2,185 · $182/mo
- Expected delta
- +$104/yr (+$9/mo · 5.0%)
ⓘ Screening estimate from a state-policy table — verify with the county assessor before closing.
Climate risk First Street
- Flood 1/10 Low FEMA zone X (unshaded) · 0% chance over 30 yrs
- Wildfire 2/10 Low
- Heat 9/10 Extreme 7 d/yr ≥105°F today · 16 d/yr by 30 yrs out
- Wind 6/10 Major 70% chance of damaging wind over 30 yrs
- Air quality 3/10 Moderate 2 unhealthy d/yr today · 3 by 30 yrs out
Nearby sold comps map
Loading sold comps map…
Walkable amenities ~0.75 mi
Loading nearby amenities…
Taxation est. · year 1
- Rental income
- $29,029
- − Mortgage interest
- −$11,763
- − Property taxes
- −$2,081
- − Insurance
- −$1,050
- − Repairs & maintenance
- −$2,322
- − Management
- −$2,322
- − Depreciation
- −$6,109
- Taxable income
- $3,381
- Est. tax owed @ 24.0%
- −$811
- After-tax cash flow
- $5,775/yr
For passive investors: Depreciation is non-cash, so a rental often shows a tax loss while cash-flowing — sheltering income. Rental losses are passive: they offset passive income freely, and up to $25,000/yr can offset ordinary (W-2) income if you actively participate and your MAGI is under $100k (phasing out to $0 by $150k); unused losses carry forward. On sale, claimed depreciation is recaptured at up to 25%, and gains may owe capital-gains tax (a 1031 exchange can defer both). Figures are a year-1 estimate at your 24.0% rate — not tax advice; consult a CPA.
Schools (NCES district)
- District
- Dorchester County Public Schools
- NCES district ID
- 2400300
- Math proficiency
- 10% ▼ -14.00%
- Reading proficiency
- 23% ▼ -12.00%
- Median HH income
- $46,767
- Composite
- 14.65/100
- National rank
- #9404
- State rank
- #23 of 24 in MD
Livability — Cambridge
- Score
- 65/100
- State rank
- #255
- US rank
- #13046
Category grades
Schools grade is shown separately in the Schools card above.
Census & demographics
- Census place
- Cambridge, MD
- Population (ZIP)
- 18,167
Population outlook (Dorchester County) Hauer SSP2
- Today (2025)
- 31,699 people
- By 2030
- 31,054 · -2.0%
- By 2040
- 29,712 · -6.3%
- By 2050
- 28,618 · -9.7%
- By 2075
- 28,436 · -10.3%
- By 2100
- 28,937 · -8.7%
Race, ethnicity, and origin ACS 2023
- Neighborhood character
- Diverse neighborhood (Simpson 0.62)
- Race & ethnicity
- White 52% Black 33% Two or more races 10% Hispanic / Latino 6% Asian 2%
- Hispanic origin (detail)
- Puerto Rican 3%
- Common ancestry
- Romanian 1% Lithuanian 1% Italian 1%
- Foreign-born
- 4% · Canada
- Languages at home
- 95% English-only · Spanish 3% Other Indo-European 1% German/W. Germanic 1%
Political lean MEDSL · Dorchester
- 2024 margin
- R (+14.6) · D 41.6% · R 56.1% · Other 2.3%
- 2008→2024 swing
- -6.3pp toward R · 2008: -8.2pp · 2024: -14.6pp
- All cycles
- 2024: R+14.6 2020: R+11.9 2016: R+16.0 2012: R+6.6 2008: R+8.2
Not yet ingested
- Civics
- —
Market trends
- HPI YoY
- ▼ -91.03%
- Current HPI
- 271.1127
- Rent YoY
- —
- Metro
- —
- State GDP YoY
- ▲ 2.97%
- F500 in state
- 12
Industry mix (Fortune 500 HQ in MD)
| Industry | F500 HQs | Revenue |
|---|---|---|
| Aerospace / Defense | 1 | $71B |
|
||
| Utilities | 1 | $25B |
|
||
| Hotels | 1 | $24B |
|
||
| Consumer Goods | 1 | $7B |
|
||
| Real Estate | 1 | $6B |
|
||
| Chemicals | 1 | $2B |
|
||
Price history
+189.7% since first listed5 events — show timeline
- 2026-05-08 Listed $210,000 BRIGHT MLS
- 2022-05-09 Listing Removed — BRIGHT MLS
- 2021-11-29 Price Changed $194,500 BRIGHT MLS
- 2021-11-09 Listed $209,500 BRIGHT MLS
- 1989-12-27 Sold (Public Records) $72,500 Public Records
Property tax history
+3.8%/yrLatest (2025): $2,081 · +12.5% YoY. Source: county tax records.
Cash-flow waterfall
monthlySold comps — $/sqft
last 12 mo · ≤1 miLoading sold comps…