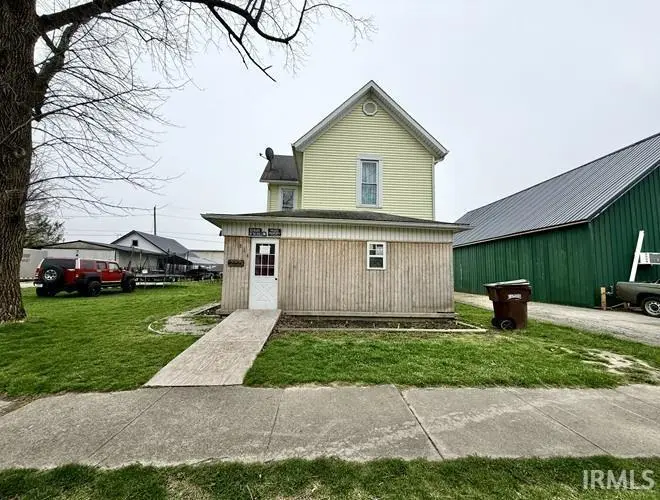
316 N Main St · Lynn, IN
Flood risk 1/10 · Minimal
- FEMA flood zone
- X (unshaded)
- Chance of flooding over 30 yrs
- 0.0%
- Est. flood insurance / yr
- $507 – $1,088
Fire risk 1/10 · Minimal
- Est. fire insurance / yr
- $717 – $1,331
Heat risk 3/10 · Minor
- Hot days now (above 98°F)
- 7 days/yr
- Hot days in 30 yrs
- 18 days/yr
Wind risk 2/10 · Minimal
- Chance of severe wind over 30 yrs
- 1.0%
Air-quality risk 3/10 · Minor
- Unhealthy air days now
- 2 days/yr
- Unhealthy air days in 30 yrs
- 4 days/yr
Risk factors via First Street. Map © Google.
Why this score? — see what drove the C+ grade
The composite is a weighted blend of 9 inputs, each scored 0–100. Each bar is that input's sub-score; the figure is the points it added to the 100-point composite (weight × sub-score).
- Cash flow +20.9/30.0
- ARV discount +10.3/15.0
- Appreciation +10.0/10.0
- DSCR +6.6/10.0
- 1% rule +4.3/10.0
- Livability +3.3/5.0
- Schools +3.1/10.0
- Rent growth +2.5/5.0
- Condition / age +2.5/5.0
$135,000
🖨 Deal sheet 📄 Offer letter ✓ Due diligence
Listing remarks MLS
Spacious 4-5 bedroom, 2.5 bathroom home with a flexible layout. The primary suite features a private full bath, while an additional main-floor bedroom includes an attached half bath. A versatile flex space on the first floor offers the option for a 5th bedroom, home office or den. The home includes two bedrooms on the main level and two upstairs, providing great separation of space. Situated on nearly half an acre in town, the property also features two detached garages - perfect for extra storage, hobbies or parking.
Key facts
- 0.43 acre lot
- 2 garage spots
- Built 1908
Neighborhood map
What this means for you Summary
Snapshot
- This is a 4-bed/3.0-bath single-family listed at $135k.
Deal economics
- At list price, monthly cash flow is $187 ($2k/yr) — positive.
- The deal already cash-flows at list — no discount required.
- To meet the 1% rule (rent ≥ 1% of price), the offer needs to be $125k (7.2% below list).
- Recommended offer: $125k (7.2% below list) — sets the bar for 1% rule.
Location & tenants
- Location reads 66/100 on livability (#285 in IN) — a middle-class / working-renter tenant base. Strengths: crime A+, cost of living A+, housing A; Watch: health & safety C-, schools D+, amenities F.
- Randolph Southern School Corporation (rural): math 33% / reading 39% proficiency, ranked #181 of 301 in IN (top 60%) — families likely to look elsewhere, expect single-tenant / working-renter base with shorter leases.
- Market conditions: 6 active listings in the ZIP; 19 units permitted in Randolph County in 2024 (0 in 5+ unit buildings).
Forward outlook
- In year one you build about $14k of equity ($933 loan paydown + $14k appreciation (10.0% local appreciation)).
- Randolph County population projected at -26% by 2050 — secular population decline; favor cash flow + early exit over multi-decade hold.
- At projected returns (10.0% appreciation + 3.0% rent growth), your $38k cash investment doubles in ~3 years — after that, you're playing with house money.
- By year 3, paydown + projected appreciation supports a ~$37k cash-out refi (75% LTV) — recoverable capital for the next deal without selling this one.
Negotiation context
- It's been on market 63 days — a 6% lower offer ($127k) is reasonable based on typical stale-listing flexibility.
Risks & watch-outs
- Watch-outs: built in 1908 — expect roof / HVAC / electrical / plumbing capex.
Questions for the listing agent
- It's been on market 63 days. Have you received any prior offers? Is the seller open to a 7% concession, seller financing, or rate buy-down credit?
- Built in 1908 — when were the roof, HVAC, electrical panel, plumbing, and water heater last replaced?
- Why hasn't it sold? Are there any deal-killer items the seller is aware of (foundation, flood, title, zoning, code violations)?
- Is there a deadline driving the sale (1031 exchange, divorce, estate, relocation)? That informs how much negotiation room exists.
- Schools are D-rated, which usually means shorter tenancies and higher turnover. Who's the typical renter profile here, and what's been the actual vacancy rate?
- What's the average days-on-market for RENTAL listings here right now (not sales)? A rising rental-DOM trend means longer vacancies and softer asking-rent achievability than the comps imply.
- What's the recent tenant-quality profile in this submarket — average credit score on applications, eviction rate, late-payment / NSF rate, and stable-employment percentage? A property-management company in the area should have these aggregated.
- How much new for-sale + rental construction is in the pipeline within 1–3 miles? Heavy new supply typically softens prices + rents 12–24 months out; constrained supply supports both.
Investment metrics
- 1% rule
- 0.93% ✗
- Cap rate
- 7.95%
- Cash-on-cash
- 5.93%
- DSCR
- 1.26
- GRM
- 9.0
CMA / ARV
- ARV (median comp)
- $144,065
- List price
- $135,000
- Delta
- -6.29%
- Verdict
- FAIR
- Comps
- 20 within 1.0 mi
Show comp detail 3 sales within ~0.75 mi
| Address | Dist | Beds/Ba | Sqft | Sold | Price | $/sf | Match |
|---|---|---|---|---|---|---|---|
| 304 N Main St | 0.07mi | 4/1.0 | 1,860 (-12%) | 20mo | $165,000 | $89 | 53 |
| 209 W Church St | 0.23mi | 3/2.5 (-1) | 1,923 (-9%) | 23mo | $80,000 | $42 | 49 |
| 817 W Church St | 0.64mi | 5/1.0 (+1) | 1,946 (-8%) | 19mo | $259,900 | $134 | 29 |
Match score weights: distance 35% · size 25% · config 20% · recency 20%. Top-matched comps best support the ARV.
Projected returns pro-forma
10.0% appreciation · 3.0% rent growth · sell at horizon
- IRR
- 28.6%
- Equity multiple
- 3.26×
- Total profit
- $85,368
- Equity at exit
- $121,619
- IRR
- 24.8%
- Equity multiple
- 7.40×
- Total profit
- $241,911
- Equity at exit
- $262,275
Cash invested: $37,800 (down + closing). Projections, not guarantees.
Landlord ↔ Tenant lean methodology
- Overall (STATE)
- 90 Strongly Landlord-Friendly
- State Indiana
- 90 Strongly Landlord-Friendly · R+11
- County
- — inherits STATE
- City
- — inherits STATE
ZIP-level market 47355
- Home prices YoY
- 12.3%
- Active inventory
- 6
- Price-to-rent
- 9.0×
Monthly cashflow live
- Estimated rent
- $1,252 medium interval (Pro) →
- Mortgage (P&I)
- −$708
- Tax from tax record
- −$38 /mo · $457/yr
- Insurance
- −$56
- HOA
- −$0
- Vacancy / Maint / Mgmt
- −$263
- Net cashflow
- $187
Break-even live
UW: 25.0% down · 7.5% · 30yr · 1.5% tax · 5.0% vac · 8.0% maint · 8.0% mgmt
Financing live
Cash to close
- Down payment
- $33,750
- Closing costs
- $4,050
- Reserves months
- —
- Total cash needed
- —
Loan-product check · same deal, 3 products live
Conventional
25% down · 7.5% · 30yr
- Down + closing
- —
- Monthly P&I
- —
- Monthly cashflow
- —
- DSCR
- —
- Eligible?
- —
Personal DTI + credit; lowest rate.
DSCR
20% down · 8.5% · 30yr
- Down + closing
- —
- Monthly P&I
- —
- Monthly cashflow
- —
- DSCR
- —
- Eligible?
- —
No personal income docs; deal must DSCR.
Hard money
10% down · 12.0% · 12mo
- Down + closing
- —
- Monthly P&I
- —
- Monthly cashflow
- —
- DSCR
- —
- Eligible?
- —
Short-term bridge; refi at stabilization.
Listing history 10 events
-
2026-06-09days on market $135,000 Active 63 DOM
-
2026-06-08days on market $135,000 Active 62 DOM
-
2026-06-07days on market $135,000 Active 61 DOM
-
2026-06-05days on market $135,000 Active 59 DOM
-
2026-06-04days on market $135,000 Active 57 DOM
-
2026-06-02days on market $135,000 Active 56 DOM
-
2026-06-01days on market $135,000 Active 55 DOM
-
2026-05-31days on market $135,000 Active 54 DOM
-
2026-05-31days on market $135,000 Active 53 DOM
-
2026-04-02$135,000 Active 523-char remark
Show marketing remark (523 chars)
Spacious 4-5 bedroom, 2.5 bathroom home with a flexible layout. The primary suite features a private full bath, while an additional main-floor bedroom includes an attached half bath. A versatile flex space on the first floor offers the option for a 5th bedroom, home office or den. The home includes two bedrooms on the main level and two upstairs, providing great separation of space. Situated on nearly half an acre in town, the property also features two detached garages - perfect for extra storage, hobbies or parking.
ⓘ Source: listings_history table (triggers on properties + properties_extension) + one-shot
backfill from property_details.listing_events for pre-trigger history.
Tax reassessment forecast IN · Partial reset (capped growth)
- Current annual tax
- $457 · $38/mo
- Projected year-2 tax
- $802 · $67/mo
- Expected delta
- +$345/yr (+$29/mo · 75.5%)
ⓘ Screening estimate from a state-policy table — verify with the county assessor before closing.
Climate risk First Street
- Flood 1/10 Low FEMA zone X (unshaded) · 0% chance over 30 yrs
- Wildfire 1/10 Low
- Heat 3/10 Moderate 7 d/yr ≥98°F today · 18 d/yr by 30 yrs out
- Wind 2/10 Low 100% chance of damaging wind over 30 yrs
- Air quality 3/10 Moderate 2 unhealthy d/yr today · 4 by 30 yrs out
Nearby sold comps map
Loading sold comps map…
Walkable amenities ~0.75 mi
Loading nearby amenities…
Taxation est. · year 1
- Rental income
- $15,026
- − Mortgage interest
- −$7,562
- − Property taxes
- −$457
- − Insurance
- −$675
- − Repairs & maintenance
- −$1,202
- − Management
- −$1,202
- − Depreciation
- −$3,927
- Taxable income
- $0
- Est. tax owed @ 24.0%
- −$0
- After-tax cash flow
- $2,243/yr
For passive investors: Depreciation is non-cash, so a rental often shows a tax loss while cash-flowing — sheltering income. Rental losses are passive: they offset passive income freely, and up to $25,000/yr can offset ordinary (W-2) income if you actively participate and your MAGI is under $100k (phasing out to $0 by $150k); unused losses carry forward. On sale, claimed depreciation is recaptured at up to 25%, and gains may owe capital-gains tax (a 1031 exchange can defer both). Figures are a year-1 estimate at your 24.0% rate — not tax advice; consult a CPA.
Schools (NCES district)
- District
- Randolph Southern School Corporation
- NCES district ID
- 1810740
- Math proficiency
- 33% ▼ -12.00%
- Reading proficiency
- 39% ▼ -10.00%
- Median HH income
- $47,369
- Composite
- 30.91/100
- National rank
- #6113
- State rank
- #181 of 301 in IN
Livability — Lynn
- Score
- 66/100
- State rank
- #285
- US rank
- #11678
Category grades
Schools grade is shown separately in the Schools card above.
Census & demographics
- Census place
- Lynn, IN
- Population (ZIP)
- 2,966
Population outlook (Randolph County) Hauer SSP2
- Today (2025)
- 22,998 people
- By 2030
- 21,815 · -5.1%
- By 2040
- 19,360 · -15.8%
- By 2050
- 17,010 · -26.0%
- By 2075
- 12,491 · -45.7%
- By 2100
- 8,986 · -60.9%
Race, ethnicity, and origin ACS 2023
- Neighborhood character
- Predominantly White (87%)
- Race & ethnicity
- White 87% Hispanic / Latino 8% Two or more races 3%
- Hispanic origin (detail)
- Mexican 2%
- Common ancestry
- Slovak 3% Iranian 2% Serbian 2%
- Foreign-born
- 1% · Canada
- Languages at home
- 97% English-only · Spanish 2% German/W. Germanic 1%
Political lean MEDSL · Randolph
- 2024 margin
- Solid R (+53.7) · D 22.3% · R 75.9% · Other 1.8%
- 2008→2024 swing
- -44.9pp toward R · 2008: -8.8pp · 2024: -53.7pp
- All cycles
- 2024: R+53.7 2020: R+52.4 2016: R+48.5 2012: R+24.1 2008: R+8.8
Not yet ingested
- Civics
- —
Market trends
- HPI YoY
- ▲ 26.80%
- Current HPI
- 245.0558
- Rent YoY
- —
- Metro
- —
- State GDP YoY
- ▲ 2.90%
- F500 in state
- 18
Industry mix (Fortune 500 HQ in IN)
| Industry | F500 HQs | Revenue |
|---|---|---|
| Industrial Machinery | 2 | $37B |
|
||
| Healthcare | 1 | $177B |
|
||
| Pharmaceuticals | 1 | $45B |
|
||
| Metals / Steel | 1 | $18B |
|
||
| Agriculture | 1 | $17B |
|
||
| Packaging | 1 | $12B |
|
||
Price history
1 event — show timeline
- 2026-04-02 Listed $135,000 IRMLS
Property tax history
-10.0%/yrLatest (2024): $457 · +7.5% YoY. Source: county tax records.
Cash-flow waterfall
monthlySold comps — $/sqft
last 12 mo · ≤1 miLoading sold comps…