 Triplex
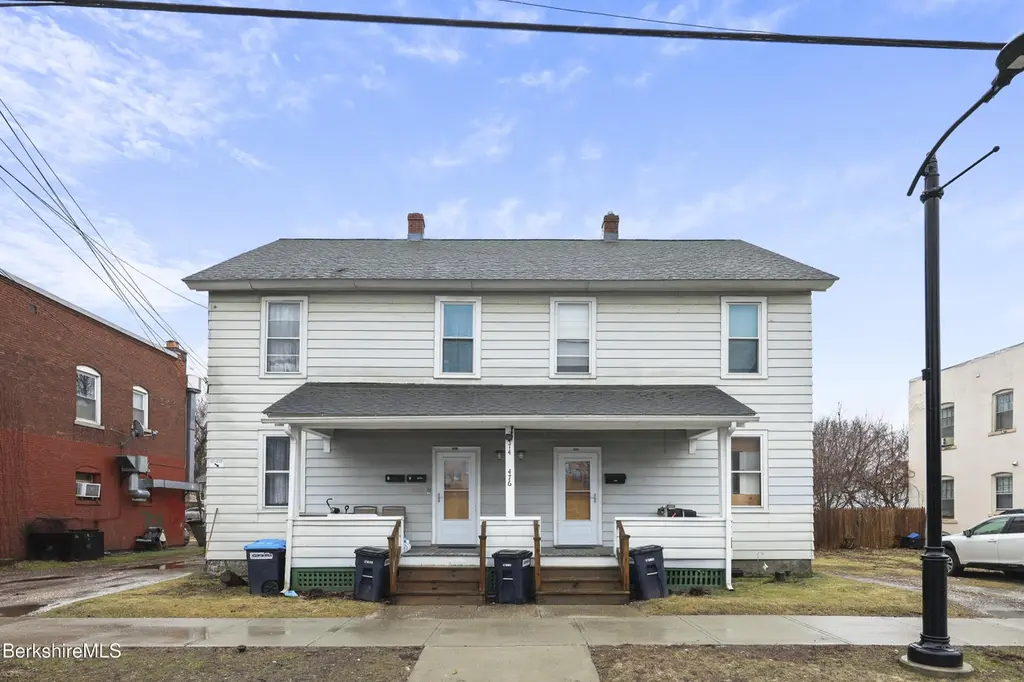
474 Tyler St · Pittsfield, MA
Flood risk 1/10 · Minimal
- FEMA flood zone
- X
- Chance of flooding over 30 yrs
- 0.0%
- Est. flood insurance / yr
- $473 – $860
Fire risk 1/10 · Minimal
- Est. fire insurance / yr
- $915 – $1,699
Heat risk 2/10 · Minimal
- Hot days now (above 92°F)
- 7 days/yr
- Hot days in 30 yrs
- 16 days/yr
Wind risk 4/10 · Minor
- Chance of severe wind over 30 yrs
- 10.0%
Air-quality risk 2/10 · Minimal
- Unhealthy air days now
- 1 days/yr
- Unhealthy air days in 30 yrs
- 1 days/yr
Risk factors via First Street. Map © Google.
Why this score? — see what drove the B grade
The composite is a weighted blend of 9 inputs, each scored 0–100. Each bar is that input's sub-score; the figure is the points it added to the 100-point composite (weight × sub-score).
- Cash flow +30.0/30.0
- DSCR +10.0/10.0
- 1% rule +9.3/10.0
- ARV discount +8.8/15.0
- Rent growth +4.4/5.0
- Livability +3.8/5.0
- Condition / age +2.5/5.0
- Schools +2.3/10.0
- Appreciation +0.0/10.0
$315,000
🖨 Deal sheet 📄 Offer letter ✓ Due diligence
Multi-family units
County records classify this as Multi-Family (2-4 Unit). Listing-text estimate: 3 units. confirmed
Listing remarks MLS
Tyler Street Multifamily. 3 Family home walking distance to churches and restaurants. This property offers 2 one bedroom flats and 1 three bedroom apt (up and downstairs). Off street parking and on bus line. Great opportunity for an owner-occupied and/or investor.
Key facts
- Separate utilities
- Multi-family home
- Off-street parking
Tags
Neighborhood map
What this means for you Summary
Snapshot
- This is a 2×1bd/1ba + 1×3bd/2ba units multifamily listed at $315k.
Deal economics
- At list price, monthly cash flow is $2k ($18k/yr) — positive. Per door: $514/mo.
- The deal already cash-flows at list — no discount required.
- Meets the 1% rule at list price ($4k rent vs $315k).
- Cap rate 12.2% vs local median 3.6% in Pittsfield — top-decile yield for the area; either an underpriced asset or a hidden risk that comps aren't pricing in. Stress-test before assuming the spread holds.
Location & tenants
- Location reads 75/100 on livability (#70 in MA, #3,820 nationally) — a middle-class / working-renter tenant base. Strengths: commute A+, housing A+, health & safety A+; Watch: employment C-, amenities D+, crime D.
- Pittsfield (urban): math 19% / reading 34% proficiency, ranked #272 of 302 in MA (top 90%) — low school quality limits family demand, transient renter base, plan for 1-2y turnover.
- Zoned schools: Morningside Community School (math 8% / reading 22%, grade F, #854 of 938 statewide, top 93%, 355 students, 0% FRL); John T Reid Middle (math 7% / reading 17%, grade F, #283 of 305 statewide, top 93%, 450 students, 0% FRL); Taconic High (math 27% / reading 37%, grade F, #255 of 343 statewide, top 77%, 860 students, 0% FRL) — zoned schools average 0% FRL vs 50% district-wide (50 pts lower); this property's tenant base skews higher-income than the district average.
- Market conditions: Rents rising fast (+7.7%/yr); 275 active listings in the ZIP; 130 units permitted in Berkshire County in 2024 (10 in 5+ unit buildings).
- At $4,499/mo this rent would consume 76% of the median local household income ($71k/yr) (locally 1580% of renters already pay >50% of income on rent) — very limited rent-growth headroom before tenants either downsize or default.
Forward outlook
- Local home prices are declining (-3.0%/yr); year-one equity from $2k of loan paydown is wiped out by about $9k of value loss. Plan a longer hold.
- Berkshire County population projected at -24% by 2050 — secular population decline; favor cash flow + early exit over multi-decade hold.
- At projected returns (-3.0% appreciation + 7.7% rent growth), your $88k cash investment doubles in ~5 years — after that, you're playing with house money.
Negotiation context
- Only 7 days on market — expect competitive offers; lowballing is unlikely to land.
- 2 sale attempts since 5y ago with the ask held roughly flat each time — persistent listings suggest the price (not the market) is what's stuck; bring a comps-based counter.
- Current owner paid $155k; list at $315k implies a 103% gain — meaningful room to come down on a strong offer.
Risks & watch-outs
- Watch-outs: built in 1850 — expect roof / HVAC / electrical / plumbing capex.
Questions for the listing agent
- Can we see the unit-by-unit rent roll, current vacancy, and any below-market leases? What's the average tenancy length?
- What capital expenditures (roof, boiler, parking lot, exteriors) have been made in the last 5 years, and what's planned in the next 2?
- Built in 1850 — when were the roof, HVAC, electrical panel, plumbing, and water heater last replaced?
- Is there a deadline driving the sale (1031 exchange, divorce, estate, relocation)? That informs how much negotiation room exists.
- Schools are D-rated, which usually means shorter tenancies and higher turnover. Who's the typical renter profile here, and what's been the actual vacancy rate?
- Crime grade is D in this area — have there been break-ins, vandalism, or insurance claims at this property in the last 3 years? What carrier currently insures it and at what premium?
- What's the average days-on-market for RENTAL listings here right now (not sales)? A rising rental-DOM trend means longer vacancies and softer asking-rent achievability than the comps imply.
- What's the recent tenant-quality profile in this submarket — average credit score on applications, eviction rate, late-payment / NSF rate, and stable-employment percentage? A property-management company in the area should have these aggregated.
- How much new apartment / multifamily construction is in the pipeline within 1–3 miles? Heavy new supply (>2% of stock underway) typically softens rents 12–24 months out; light construction supports rent growth.
Investment metrics
- 1% rule
- 1.43% ✓
- Cap rate
- 12.16%
- Cash-on-cash
- 20.97%
- DSCR
- 1.93
- GRM
- 5.8
CMA / ARV
- ARV (on-the-fly)
- $324,324
- Comps found
- 12
Show comp detail 12 sales within ~0.75 mi
| Address | Dist | Beds/Ba | Sqft | Sold | Price | $/sf | Match |
|---|---|---|---|---|---|---|---|
| 474 Tyler St | 0.00mi | 5/4.0 (-1) | 3,276 (0%) | 1mo | $345,000 | $105 | 94 |
| 10 Cherry St | 0.28mi | 6/4.0 | 3,320 (+1%) | 2mo | $295,000 | $89 | 83 |
| 76-78 Stoddard Ave | 0.19mi | 7/3.0 (+1) | 3,120 (-5%) | 4mo | $275,000 | $88 | 71 |
| 91 Dalton Ave | 0.56mi | 6/3.0 | 3,276 (0%) | 3mo | $375,000 | $114 | 68 |
| 30 Lenox Ave | 0.57mi | 7/3.0 (+1) | 3,360 (+3%) | 1mo | $125,000 | $37 | 60 |
| 21 Pleasant St | 0.36mi | 7/4.0 (+1) | 2,951 (-10%) | 10mo | $375,000 | $127 | 54 |
| 1 Rostone Pl | 0.60mi | 7/3.0 (+1) | 3,180 (-3%) | 6mo | $380,000 | $119 | 53 |
| 10-12 Stoddard Ave | 0.38mi | 6/2.5 | 2,840 (-13%) | 6mo | $152,000 | $54 | 49 |
| 303 Springside Ave | 0.42mi | 5/4.5 (-1) | 2,912 (-11%) | 11mo | $365,000 | $125 | 46 |
| 62-64 Dalton Ave | 0.49mi | 6/6.0 | 3,627 (+11%) | 10mo | $260,000 | $72 | 43 |
| 25-27 Root Pl | 0.75mi | 6/2.0 | 2,946 (-10%) | 11mo | $135,000 | $46 | 32 |
| 119 Lenox Ave Unit 1 & 2 | 0.71mi | 5/2.0 (-1) | 2,940 (-10%) | 7mo | $292,000 | $99 | 31 |
Match score weights: distance 35% · size 25% · config 20% · recency 20%. Top-matched comps best support the ARV.
Projected returns pro-forma
-3.0% appreciation · 7.72% rent growth · sell at horizon
- IRR
- 18.4%
- Equity multiple
- 1.79×
- Total profit
- $69,463
- Equity at exit
- $46,968
- IRR
- 29.8%
- Equity multiple
- 4.27×
- Total profit
- $288,020
- Equity at exit
- $27,235
Cash invested: $88,200 (down + closing). Projections, not guarantees.
Landlord ↔ Tenant lean methodology
- Overall (STATE)
- 20 Strongly Tenant-Friendly
- State Massachusetts
- 20 Strongly Tenant-Friendly · D+15
- County
- — inherits STATE
- City
- — inherits STATE
ZIP-level market 01201
- Rents YoY
- 7.7%
- Active inventory
- 275
- Price-to-rent
- 19.7×
Monthly cashflow live
- Estimated rent
- $4,499 high interval (Pro) →
- Mortgage (P&I)
- −$1,652
- Tax from tax record
- −$230 /mo · $2,759/yr
- Insurance
- −$131
- HOA
- −$0
- Vacancy / Maint / Mgmt
- −$945
- Net cashflow
- $1,541
Break-even live
3-unit breakdown (identical units grouped — click to expand)
| Units | Beds | Baths | Est. rent |
|---|---|---|---|
| 2× units | 1 | 1 | $2,662 |
| #1 | 1 | 1 | $1,331 |
| #2 | 1 | 1 | $1,331 |
| 1× unit | 3 | 2 | $1,838 |
| Total (3 units) | $4,499 | ||
UW: 25.0% down · 7.5% · 30yr · 1.5% tax · 5.0% vac · 8.0% maint · 8.0% mgmt
Financing live
Cash to close
- Down payment
- $78,750
- Closing costs
- $9,450
- Reserves months
- —
- Total cash needed
- —
Loan-product check · same deal, 3 products live
Conventional
25% down · 7.5% · 30yr
- Down + closing
- —
- Monthly P&I
- —
- Monthly cashflow
- —
- DSCR
- —
- Eligible?
- —
Personal DTI + credit; lowest rate.
DSCR
20% down · 8.5% · 30yr
- Down + closing
- —
- Monthly P&I
- —
- Monthly cashflow
- —
- DSCR
- —
- Eligible?
- —
No personal income docs; deal must DSCR.
Hard money
10% down · 12.0% · 12mo
- Down + closing
- —
- Monthly P&I
- —
- Monthly cashflow
- —
- DSCR
- —
- Eligible?
- —
Short-term bridge; refi at stabilization.
Listing history 4 events
-
2026-04-13status Pending
-
2026-03-27$315,000 Active
-
2022-03-04soldstatus $154,900 270-char remark
Show marketing remark (270 chars)
Tyler Street Multifamily. 3 Family home walking distance to churches and restaurants. This property offers 2 one bedroom flats and 1 three bedroom apt (up and downstairs). Off street parking and on bus line. Great opportunity for an owner-occupied and/or investor.
-
2021-10-20$149,900 270-char remark
Show marketing remark (270 chars)
Tyler Street Multifamily. 3 Family home walking distance to churches and restaurants. This property offers 2 one bedroom flats and 1 three bedroom apt (up and downstairs). Off street parking and on bus line. Great opportunity for an owner-occupied and/or investor.
ⓘ Source: listings_history table (triggers on properties + properties_extension) + one-shot
backfill from property_details.listing_events for pre-trigger history.
Tax reassessment forecast MA · Partial reset (capped growth)
- Current annual tax
- $2,759 · $230/mo
- Projected year-2 tax
- $3,317 · $276/mo
- Expected delta
- +$558/yr (+$46/mo · 20.2%)
ⓘ Screening estimate from a state-policy table — verify with the county assessor before closing.
Climate risk First Street
- Flood 1/10 Low FEMA zone X · 0% chance over 30 yrs
- Wildfire 1/10 Low
- Heat 2/10 Low 7 d/yr ≥92°F today · 16 d/yr by 30 yrs out
- Wind 4/10 Moderate 10% chance of damaging wind over 30 yrs
- Air quality 2/10 Low 1 unhealthy d/yr today · 1 by 30 yrs out
Nearby sold comps map
Loading sold comps map…
Walkable amenities ~0.75 mi
Loading nearby amenities…
Taxation est. · year 1
- Rental income
- $53,988
- − Mortgage interest
- −$17,645
- − Property taxes
- −$2,759
- − Insurance
- −$1,575
- − Repairs & maintenance
- −$4,319
- − Management
- −$4,319
- − Depreciation
- −$9,164
- Taxable income
- $14,207
- Est. tax owed @ 24.0%
- −$3,410
- After-tax cash flow
- $15,084/yr
For passive investors: Depreciation is non-cash, so a rental often shows a tax loss while cash-flowing — sheltering income. Rental losses are passive: they offset passive income freely, and up to $25,000/yr can offset ordinary (W-2) income if you actively participate and your MAGI is under $100k (phasing out to $0 by $150k); unused losses carry forward. On sale, claimed depreciation is recaptured at up to 25%, and gains may owe capital-gains tax (a 1031 exchange can defer both). Figures are a year-1 estimate at your 24.0% rate — not tax advice; consult a CPA.
Schools (NCES district)
- District
- Pittsfield
- NCES district ID
- 2509630
- Math proficiency
- 19% ▼ -10.00%
- Reading proficiency
- 34% ▼ -2.00%
- Median HH income
- $44,032
- Composite
- 22.67/100
- National rank
- #8046
- State rank
- #272 of 302 in MA
Livability — Pittsfield
- Score
- 75/100
- State rank
- #70
- US rank
- #3820
Category grades
Schools grade is shown separately in the Schools card above.
Census & demographics
- Census place
- Pittsfield, MA
- County
- Berkshire County · 44,848 people
- City population
- 44,848
- Metro
- Pittsfield, MA
- Population (ZIP)
- 44,848
- Household income
- $71,093
- Rent vs Own
- Severe rent burden
- 1580.0
Population outlook (Berkshire County) Hauer SSP2
- Today (2025)
- 119,723 people
- By 2030
- 114,608 · -4.3%
- By 2040
- 102,806 · -14.1%
- By 2050
- 91,305 · -23.7%
- By 2075
- 71,517 · -40.3%
- By 2100
- 57,988 · -51.6%
Race, ethnicity, and origin ACS 2023
- Neighborhood character
- Predominantly White (78%)
- Race & ethnicity
- White 78% Two or more races 10% Hispanic / Latino 9% Black 5% Asian 1%
- Hispanic origin (detail)
- Puerto Rican 3%
- Common ancestry
- Lithuanian 8% Romanian 6% Slovak 2%
- Foreign-born
- 7% · Canada, Jamaica
- Languages at home
- 90% English-only · Spanish 6% Other Indo-European 1% Russian/Polish/Slavic 1%
Political lean MEDSL · Berkshire
- 2024 margin
- Solid D (+39.9) · D 68.9% · R 29.0% · Other 2.1%
- 2008→2024 swing
- -12.5pp toward R · 2008: 52.4pp · 2024: 39.9pp
- All cycles
- 2024: D+39.9 2020: D+47.1 2016: D+41.5 2012: D+53.7 2008: D+52.4
Not yet ingested
- Civics
- —
Market trends
- HPI YoY
- ▼ -199.88%
- Current HPI
- 283.3421
- Rent YoY
- ▲ 7.72%
- Metro
- Pittsfield, MA
- State GDP YoY
- ▲ 2.28%
- F500 in state
- 38
Industry mix (Fortune 500 HQ in MA)
| Industry | F500 HQs | Revenue |
|---|---|---|
| Technology | 3 | $17B |
|
||
| Insurance | 2 | $84B |
|
||
| Retail | 2 | $76B |
|
||
| Life Sciences | 1 | $43B |
|
||
| Energy Technology | 1 | $31B |
|
||
| Aerospace / Defense | 1 | $18B |
|
||
Price history
+110.1% since first listed4 events — show timeline
- 2026-04-13 Pending — BCMLS
- 2026-03-27 Listed $315,000 BCMLS
- 2022-03-04 Sold (MLS) $154,900 BCMLS
- 2021-10-20 Listed $149,900 BCMLS
Property tax history
+3.0%/yrLatest (2023): $2,759 · +24.3% YoY. Source: county tax records.
Cash-flow waterfall
monthlySold comps — $/sqft
last 12 mo · ≤1 miLoading sold comps…