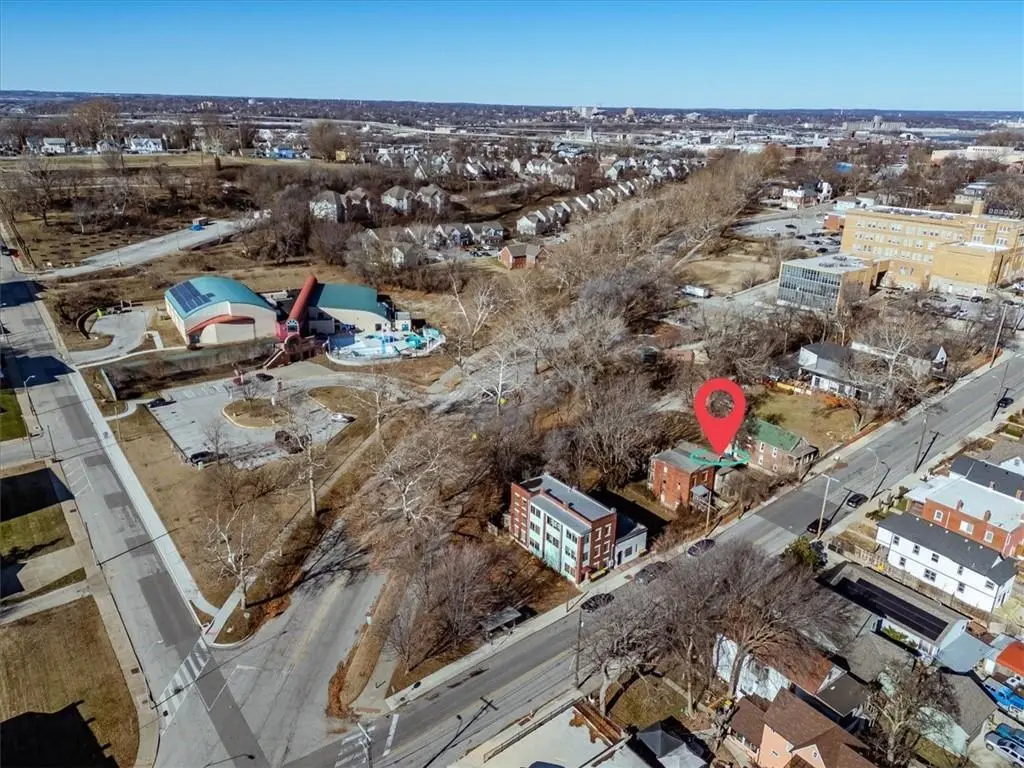
2020 Summit St · Kansas City, MO
Flood risk 7/10 · Major
- FEMA flood zone
- X (unshaded)
- Chance of flooding over 30 yrs
- 0.78%
- Est. flood insurance / yr
- $473 – $860
Fire risk 1/10 · Minimal
- Est. fire insurance / yr
- $1,054 – $1,958
Heat risk 4/10 · Minor
- Hot days now (above 106°F)
- 7 days/yr
- Hot days in 30 yrs
- 17 days/yr
Wind risk 2/10 · Minimal
- Chance of severe wind over 30 yrs
- —
Air-quality risk 3/10 · Minor
- Unhealthy air days now
- 2 days/yr
- Unhealthy air days in 30 yrs
- 3 days/yr
Risk factors via First Street. Map © Google.
Why this score? — see what drove the C- grade
The composite is a weighted blend of 9 inputs, each scored 0–100. Each bar is that input's sub-score; the figure is the points it added to the 100-point composite (weight × sub-score).
- Cash flow +18.5/30.0
- ARV discount +15.0/15.0
- DSCR +5.8/10.0
- Livability +3.9/5.0
- 1% rule +3.8/10.0
- Rent growth +2.6/5.0
- Condition / age +2.5/5.0
- Schools +1.5/10.0
- Appreciation +0.0/10.0
$360,000
🖨 Deal sheet (PDF) 📄 Offer letter ✓ Due diligence
Listing remarks MLS
Location, location, location! Whether looking for a complete renovation project on a large brick structure, or a scrape, this property is it! This is your opportunity to renovate or build your dream home in the coveted Westside neighborhood of Kansas City. New construction homes in the area are selling for $665k-$1MM+, leaving plenty of options to make this lot your piece of paradise. Seller is also selling the three additional parcels (2018, 2024 & 2026), develop the entire plot, or just one parcel! Great location nearby highway access, local restaurants, community center and parks.
Key facts
- Community center
- Highway access
- Local restaurants
Tags
Neighborhood map
What this means for you Summary
Snapshot
- This is a 4-bed/2.0-bath single-family listed at $360k.
Deal economics
- At list price, monthly cash flow is $289 ($3k/yr) — positive.
- The deal already cash-flows at list — no discount required.
- To meet the 1% rule (rent ≥ 1% of price), the offer needs to be $316k (12.3% below list).
- Recommended offer: $316k (12.3% below list) — sets the bar for 1% rule.
- Cap rate 7.4% vs local median 3.9% in Kansas City — top-decile yield for the area; either an underpriced asset or a hidden risk that comps aren't pricing in. Stress-test before assuming the spread holds.
Location & tenants
- Location reads 78/100 on livability (#28 in MO, #2,671 nationally) — a middle-class / working-renter tenant base. Strengths: amenities A+, commute A+, cost of living A+; Watch: schools C-, crime F.
- Kansas City 33 (urban): math 12% / reading 24% proficiency, ranked #308 of 324 in MO (top 95%) — low school quality limits family demand, transient renter base, plan for 1-2y turnover; 75% free/reduced lunch — lower-income household profile, screen leases tightly.
- Market conditions: Rents flat; 96 active listings in the ZIP; 2 comparable units currently listed for rent nearby; solid renter incomes; 4,002 units permitted in Jackson County in 2024 (2,271 in 5+ unit buildings).
- At $3,155/mo this rent would consume 47% of the median local household income ($81k/yr) (locally 864% of renters already pay >50% of income on rent) — very limited rent-growth headroom before tenants either downsize or default.
Forward outlook
- Local home prices are declining (-3.0%/yr); year-one equity from $2k of loan paydown is wiped out by about $11k of value loss. Plan a longer hold.
- Jackson County population projected at +4% by 2050 — modest demand growth; plan on rents tracking national, not racing it.
Negotiation context
- It's been on market 309 days — a 12% lower offer ($317k) is reasonable based on typical stale-listing flexibility.
Risks & watch-outs
- Watch-outs: flood insurance adds $56/mo; built in 1890 — expect roof / HVAC / electrical / plumbing capex.
- Climate carrying-cost: major flood risk — expect insurance premiums to compound above CPI over the hold.
Questions for the listing agent
- It's been on market 309 days. Have you received any prior offers? Is the seller open to a 12% concession, seller financing, or rate buy-down credit?
- Built in 1890 — when were the roof, HVAC, electrical panel, plumbing, and water heater last replaced?
- What's the actual annual flood-insurance premium (NFIP or private), and is the property in a SFHA with mandatory coverage?
- Why hasn't it sold? Are there any deal-killer items the seller is aware of (foundation, flood, title, zoning, code violations)?
- Is there a deadline driving the sale (1031 exchange, divorce, estate, relocation)? That informs how much negotiation room exists.
- Crime grade is F in this area — have there been break-ins, vandalism, or insurance claims at this property in the last 3 years? What carrier currently insures it and at what premium?
- What's the average days-on-market for RENTAL listings here right now (not sales)? A rising rental-DOM trend means longer vacancies and softer asking-rent achievability than the comps imply.
- What's the recent tenant-quality profile in this submarket — average credit score on applications, eviction rate, late-payment / NSF rate, and stable-employment percentage? A property-management company in the area should have these aggregated.
- How much new for-sale + rental construction is in the pipeline within 1–3 miles? Heavy new supply typically softens prices + rents 12–24 months out; constrained supply supports both.
Investment metrics
- 1% rule
- 0.88% ✗
- Cap rate
- 7.44%
- Cash-on-cash
- 4.10%
- DSCR
- 1.18
- GRM
- 9.5
CMA / ARV
- ARV (median comp)
- $520,868
- List price
- $360,000
- Delta
- -30.88%
- Verdict
- UNDERPRICED
- Comps
- 20 within 1.0 mi
Projected returns pro-forma
-3.0% appreciation · 0.44% rent growth · sell at horizon
- IRR
- -13.6%
- Equity multiple
- 0.52×
- Total profit
- $-48,000
- Equity at exit
- $53,677
- IRR
- -8.8%
- Equity multiple
- 0.51×
- Total profit
- $-49,530
- Equity at exit
- $31,126
Cash invested: $100,800 (down + closing). Projections, not guarantees.
Landlord ↔ Tenant lean methodology
- Overall (STATE)
- 81 Strongly Landlord-Friendly
- State Missouri
- 81 Strongly Landlord-Friendly · R+10
- County
- — inherits STATE
- City
- — inherits STATE
ZIP-level market 64108
- Home prices YoY
- -25.2%
- Rents YoY
- 0.4%
- Active inventory
- 96
- Price-to-rent
- 9.5×
Monthly cashflow live
- Estimated rent
- $3,155 medium interval (Pro) →
- Mortgage (P&I)
- −$1,888
- Tax from tax record
- −$111 /mo · $1,328/yr
- Insurance
- −$150
- Flood insurance flood zone
- −$56 /mo · $666/yr
- HOA
- −$0
- Vacancy / Maint / Mgmt
- −$663
- Net cashflow
- $289
Break-even live
Sensitivity live
| Price | -10% $492 | -5% $391 | +0% $289 | +5% $187 | +10% $85 |
|---|---|---|---|---|---|
| Rent | -10% $39 | -5% $164 | +0% $289 | +5% $413 | +10% $538 |
| Rate | -1.0pp $470 | -0.5pp $380 | base $289 | +0.5pp $195 | +1.0pp $101 |
UW: 25.0% down · 7.5% · 30yr · 1.5% tax · 5.0% vac · 8.0% maint · 8.0% mgmt
Financing live
Cash to close
- Down payment
- $90,000
- Closing costs
- $10,800
- Reserves months
- —
- Total cash needed
- —
Loan-product check · same deal, 3 products live
Conventional
25% down · 7.5% · 30yr
- Down + closing
- —
- Monthly P&I
- —
- Monthly cashflow
- —
- DSCR
- —
- Eligible?
- —
Personal DTI + credit; lowest rate.
DSCR
20% down · 8.5% · 30yr
- Down + closing
- —
- Monthly P&I
- —
- Monthly cashflow
- —
- DSCR
- —
- Eligible?
- —
No personal income docs; deal must DSCR.
Hard money
10% down · 12.0% · 12mo
- Down + closing
- —
- Monthly P&I
- —
- Monthly cashflow
- —
- DSCR
- —
- Eligible?
- —
Short-term bridge; refi at stabilization.
Rent comps 2 comps
| Address | Beds | Baths | Sqft | Rent | $/sqft | DOM | Units | Dist |
|---|---|---|---|---|---|---|---|---|
| 311 W 22nd St Kansas City, MO | 3.0 | 1.0–2.0 | 1009 | $4,340 | $4.30 | 2d | 60 | 0.41mi |
| 2705 McGee Trfy Kansas City, MO | 3.0 | 1.0–2.0 | 1000 | $2,881 | $2.88 | 2d | 13 | 1.10mi |
Listing history 17 events
-
2026-06-18days on market $360,000 Active 309 DOM
-
2026-06-17days on market $360,000 Active 308 DOM
-
2026-06-16days on market $360,000 Active 307 DOM
-
2026-06-15days on market $360,000 Active 306 DOM
-
2026-06-13days on market $360,000 Active 304 DOM
-
2026-06-09days on market $360,000 Active 300 DOM
-
2026-06-08days on market $360,000 Active 299 DOM
-
2026-06-07days on market $360,000 Active 298 DOM
-
2026-06-05days on market $360,000 Active 295 DOM
-
2026-06-03days on market $360,000 Active 294 DOM
-
2026-06-02days on market $360,000 Active 293 DOM
-
2026-06-01days on market $360,000 Active 292 DOM
-
2026-05-31days on market $360,000 Active 291 DOM
-
2026-01-19price $360,000 596-char remark
Show marketing remark (596 chars)
Location, location, location! Whether looking for a complete renovation project on a large brick structure, or a scrape, this property is it! This is your opportunity to renovate or build your dream home in the coveted Westside neighborhood of Kansas City. New construction homes in the area are selling for $665k-$1MM+, leaving plenty of options to make this lot your piece of paradise. Seller is also selling the three additional parcels (2018, 2024 & 2026), develop the entire plot, or just one parcel! Great location nearby highway access, local restaurants, community center and parks.
-
2025-08-13$370,000 Active 596-char remark
Show marketing remark (596 chars)
Location, location, location! Whether looking for a complete renovation project on a large brick structure, or a scrape, this property is it! This is your opportunity to renovate or build your dream home in the coveted Westside neighborhood of Kansas City. New construction homes in the area are selling for $665k-$1MM+, leaving plenty of options to make this lot your piece of paradise. Seller is also selling the three additional parcels (2018, 2024 & 2026), develop the entire plot, or just one parcel! Great location nearby highway access, local restaurants, community center and parks.
-
2006-04-03soldstatus
-
1995-02-13soldstatus
ⓘ Source: listings_history table (triggers on properties + properties_extension) + one-shot
backfill from property_details.listing_events for pre-trigger history.
Tax reassessment forecast MO · Resets to sale price
- Current annual tax
- $1,328 · $111/mo
- Projected year-2 tax
- $3,492 · $291/mo
- Expected delta
- +$2,164/yr (+$180/mo · 163.0%)
ⓘ Screening estimate from a state-policy table — verify with the county assessor before closing.
Climate risk First Street
- Flood 7/10 Severe FEMA zone X (unshaded) · 78% chance over 30 yrs
- Wildfire 1/10 Low
- Heat 4/10 Moderate 7 d/yr ≥106°F today · 17 d/yr by 30 yrs out
- Wind 2/10 Low
- Air quality 3/10 Moderate 2 unhealthy d/yr today · 3 by 30 yrs out
Nearby sold comps map
Loading sold comps map…
Walkable amenities ~0.75 mi
Loading nearby amenities…
Taxation est. · year 1
- Rental income
- $37,865
- − Mortgage interest
- −$20,166
- − Property taxes
- −$1,328
- − Insurance
- −$2,466
- − Repairs & maintenance
- −$3,029
- − Management
- −$3,029
- − Depreciation
- −$10,473
- Taxable loss
- −$2,626
- Est. tax savings @ 24.0%
- +$630
- After-tax cash flow
- $4,095/yr
For passive investors: Depreciation is non-cash, so a rental often shows a tax loss while cash-flowing — sheltering income. Rental losses are passive: they offset passive income freely, and up to $25,000/yr can offset ordinary (W-2) income if you actively participate and your MAGI is under $100k (phasing out to $0 by $150k); unused losses carry forward. On sale, claimed depreciation is recaptured at up to 25%, and gains may owe capital-gains tax (a 1031 exchange can defer both). Figures are a year-1 estimate at your 24.0% rate — not tax advice; consult a CPA.
Schools (NCES district)
- District
- Kansas City 33
- NCES district ID
- 2916400
- Math proficiency
- 12% ▼ -8.00%
- Reading proficiency
- 24% ▬ 0.00%
- Median HH income
- $35,227
- Composite
- 14.8/100
- National rank
- #9387
- State rank
- #308 of 324 in MO
Livability — Kansas City
- Score
- 78/100
- State rank
- #28
- US rank
- #2671
Category grades
Schools grade is shown separately in the Schools card above.
Census & demographics
- Census place
- Kansas City, MO
- County
- Jackson County · 687,798 people
- City population
- 439,467
- Metro
- Kansas City, MO-KS
- Population (ZIP)
- 10,495
- Household income
- $80,551
- Rent vs Own
- Severe rent burden
- 864.0
Population outlook (Jackson County) Hauer SSP2
- Today (2025)
- 719,589 people
- By 2030
- 731,456 · +1.6%
- By 2040
- 746,689 · +3.8%
- By 2050
- 749,289 · +4.1%
- By 2075
- 736,227 · +2.3%
- By 2100
- 668,210 · -7.1%
Race, ethnicity, and origin ACS 2023
- Neighborhood character
- Diverse neighborhood (Simpson 0.65)
- Race & ethnicity
- White 50% Black 26% Hispanic / Latino 17% Two or more races 12% Asian 3%
- Hispanic origin (detail)
- Mexican 15%
- Common ancestry
- Italian 2% Lithuanian 2% Slovak 1%
- Foreign-born
- 6% · Canada
- Languages at home
- 88% English-only · Spanish 9% Arabic 1% French/Haitian/Cajun 1%
Political lean MEDSL · Jackson
- 2024 margin
- D (+19.3) · D 58.9% · R 39.5% · Other 1.6%
- 2008→2024 swing
- -6.1pp toward R · 2008: 25.4pp · 2024: 19.3pp
- All cycles
- 2024: D+19.3 2020: D+22.0 2016: D+16.6 2012: D+19.0 2008: D+25.4
Not yet ingested
- Civics
- —
Market trends
- HPI YoY
- ▼ -91.93%
- Current HPI
- 273.3599
- Rent YoY
- ▲ 0.44%
- Metro
- Kansas City, MO-KS
- State GDP YoY
- ▲ 1.84%
- F500 in state
- 20
Industry mix (Fortune 500 HQ in MO)
| Industry | F500 HQs | Revenue |
|---|---|---|
| Healthcare | 1 | $163B |
|
||
| Insurance | 1 | $21B |
|
||
| Industrial Technology | 1 | $17B |
|
||
| Retail | 1 | $16B |
|
||
| Industrial Distribution | 1 | $10B |
|
||
| Utilities | 1 | $9B |
|
||
Price history
-2.7% since first listed4 events — show timeline
- 2026-01-19 Price Changed $360,000 Heartland MLS as Distributed by MLS Grid
- 2025-08-13 Listed $370,000 Heartland MLS as Distributed by MLS Grid
- 2006-04-03 Sold (Public Records) — Public Records
- 1995-02-13 Sold (Public Records) — Public Records
Property tax history
+11.8%/yrLatest (2025): $1,328 · -66.9% YoY. Source: county tax records.
Cash-flow waterfall
monthlySold comps — $/sqft
last 12 mo · ≤1 miLoading sold comps…