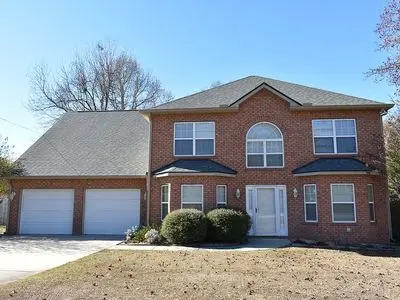
156 Davidson Rd · Warner Robins, GA
Flood risk 1/10 · Minimal
- FEMA flood zone
- X (unshaded)
- Chance of flooding over 30 yrs
- 0.0%
- Est. flood insurance / yr
- $507 – $1,088
Fire risk 3/10 · Minor
- Est. fire insurance / yr
- $963 – $1,789
Heat risk 7/10 · Major
- Hot days now (above 109°F)
- 7 days/yr
- Hot days in 30 yrs
- 19 days/yr
Wind risk 8/10 · Major
- Chance of severe wind over 30 yrs
- 80.0%
Air-quality risk 3/10 · Minor
- Unhealthy air days now
- 3 days/yr
- Unhealthy air days in 30 yrs
- 4 days/yr
Risk factors via First Street. Map © Google.
Why this score? — see what drove the D- grade
The composite is a weighted blend of 9 inputs, each scored 0–100. Each bar is that input's sub-score; the figure is the points it added to the 100-point composite (weight × sub-score).
- ARV discount +15.0/15.0
- Cash flow +7.8/30.0
- Schools +3.9/10.0
- Rent growth +3.6/5.0
- Livability +3.2/5.0
- Condition / age +2.5/5.0
- DSCR +1.9/10.0
- 1% rule +1.5/10.0
- Appreciation +0.0/10.0
$335,000
🖨 Deal sheet (PDF) 📄 Offer letter ✓ Due diligence
Listing remarks MLS
Huge Backyard .69 Acre, all fenced in! Large Bedrooms, 2 Living areas, large Dining Room, great kitchen, w/ all appliances including refrigerator. Full yard sprinkler system, move in ready. Celebrate Christmas this jewel!
Key facts
- Fixed canopy
- Large backyard
- Gas fireplace
Tags
Neighborhood map
What this means for you Summary
Snapshot
- This is a 3-bed/2.5-bath single-family listed at $335k.
Deal economics
- At list price, monthly cash flow is $-374 ($-4k/yr) — negative.
- To cash-flow at today's rent, offer at most $269k (19.7% below list).
- To meet the 1% rule (rent ≥ 1% of price), the offer needs to be $218k (35.0% below list).
- Recommended offer: $218k (35.0% below list) — sets the bar for 1% rule.
Location & tenants
- Location reads 65/100 on livability (#227 in GA) — a middle-class / working-renter tenant base. Strengths: cost of living A+, housing A+, health & safety A+; Watch: employment D+, crime F, amenities F.
- Houston County (urban): math 43% / reading 46% proficiency, ranked #23 of 174 in GA (top 13%) — families likely to look elsewhere, expect single-tenant / working-renter base with shorter leases.
- Zoned schools: Bonaire Elementary School (math 67% / reading 60%, grade B, #99 of 1,228 statewide, top 8%, 529 students, 33% FRL); Bonaire Middle School (math 67% / reading 68%, grade A-, #21 of 470 statewide, top 4%, 1,140 students, 32% FRL); Veterans High School (math 33% / reading 32%, grade F, #104 of 424 statewide, top 25%, 1,914 students, 30% FRL).
- Market conditions: Rents rising fast (+4.5%/yr); 240 active listings in the ZIP; 1 comparable units currently listed for rent nearby; high-income renter base; 1,545 units permitted in Houston County in 2024 (336 in 5+ unit buildings).
Forward outlook
- Local home prices are declining (-3.0%/yr); year-one equity from $2k of loan paydown is wiped out by about $10k of value loss. Plan a longer hold.
- Houston County population projected at +22% by 2050 — long-run rental-demand tailwind backs the buy-and-hold thesis.
Negotiation context
- It's been on market 17 days — a 2% lower offer ($330k) is reasonable based on typical stale-listing flexibility.
- Current owner paid $178k; list at $335k implies a 88% gain — meaningful room to come down on a strong offer.
Risks & watch-outs
- Climate carrying-cost: severe wind risk, 80% chance of damaging wind over 30y; extreme-heat days projected 7→19/yr by 2055 (HVAC capex compounding) — expect insurance premiums to compound above CPI over the hold.
Questions for the listing agent
- What do current leases actually rent for vs. the listed asking? Can we see a recent rent roll and the last 12 months of T-12 income?
- Is there a deadline driving the sale (1031 exchange, divorce, estate, relocation)? That informs how much negotiation room exists.
- Schools are D-rated, which usually means shorter tenancies and higher turnover. Who's the typical renter profile here, and what's been the actual vacancy rate?
- Crime grade is F in this area — have there been break-ins, vandalism, or insurance claims at this property in the last 3 years? What carrier currently insures it and at what premium?
- The area grade is low — what's the realistic commute time and amenity access for the typical tenant pool here? Any planned neighborhood developments (good or bad) we should know about?
- What's the average days-on-market for RENTAL listings here right now (not sales)? A rising rental-DOM trend means longer vacancies and softer asking-rent achievability than the comps imply.
- What's the recent tenant-quality profile in this submarket — average credit score on applications, eviction rate, late-payment / NSF rate, and stable-employment percentage? A property-management company in the area should have these aggregated.
- How much new for-sale + rental construction is in the pipeline within 1–3 miles? Heavy new supply typically softens prices + rents 12–24 months out; constrained supply supports both.
Investment metrics
- 1% rule
- 0.65% ✗
- Cap rate
- 4.95%
- Cash-on-cash
- -4.79%
- DSCR
- 0.79
- GRM
- 12.8
CMA / ARV
- ARV (on-the-fly)
- $424,710
- Comps found
- 12
Show comp detail 12 sales within ~0.75 mi
| Address | Dist | Beds/Ba | Sqft | Sold | Price | $/sf | Match |
|---|---|---|---|---|---|---|---|
| 117 Maisie Way | 0.69mi | 4/2.5 (+1) | 2,599 (+1%) | 1mo | $404,900 | $156 | 60 |
| 117 Maisie Way #232 | 0.69mi | 4/2.5 (+1) | 2,599 (+1%) | 1mo | $404,900 | $156 | 60 |
| 503 Thurston St | 0.41mi | 4/3.0 (+1) | 2,862 (+11%) | 0mo | $395,000 | $138 | 55 |
| 507 Foster Sydney Ct | 0.51mi | 4/2.5 (+1) | 2,297 (-11%) | 2mo | $380,000 | $165 | 52 |
| 130 Maisie Way #201 | 0.69mi | 4/2.5 (+1) | 2,406 (-6%) | 1mo | $407,500 | $169 | 51 |
| 130 Maisie Way | 0.69mi | 4/2.5 (+1) | 2,406 (-6%) | 1mo | $407,500 | $169 | 51 |
| 128 Maisie Way | 0.69mi | 4/2.5 (+1) | 2,379 (-8%) | 0mo | $391,400 | $165 | 50 |
| 128 Maisie Way #202 | 0.69mi | 4/2.5 (+1) | 2,379 (-8%) | 0mo | $391,400 | $165 | 50 |
| 314 Apalachee Way | 0.72mi | 4/3.0 (+1) | 2,697 (+5%) | 2mo | $485,000 | $180 | 50 |
| 511 Foster Sydney Dr Lot 53 | 0.54mi | 4/2.5 (+1) | 2,286 (-11%) | 3mo | $353,130 | $154 | 49 |
| 817 Brittany Nichole Ct Lot 137 | 0.58mi | 4/2.5 (+1) | 2,286 (-11%) | 0mo | $362,511 | $159 | 49 |
| 817 Brittany Nichole Lot 137 Ct Lot 137 | 0.58mi | 4/1.5 (+1) | 2,286 (-11%) | 0mo | $362,511 | $159 | 45 |
Match score weights: distance 35% · size 25% · config 20% · recency 20%. Top-matched comps best support the ARV.
Projected returns pro-forma
-3.0% appreciation · 4.53% rent growth · sell at horizon
- IRR
- -23.0%
- Equity multiple
- 0.20×
- Total profit
- $-74,818
- Equity at exit
- $49,950
- IRR
- -14.4%
- Equity multiple
- 0.13×
- Total profit
- $-81,856
- Equity at exit
- $28,965
Cash invested: $93,800 (down + closing). Projections, not guarantees.
Landlord ↔ Tenant lean methodology
- Overall (STATE)
- 90 Strongly Landlord-Friendly
- State Georgia
- 90 Strongly Landlord-Friendly · R+3
- County
- — inherits STATE
- City
- — inherits STATE
ZIP-level market 31005
- Home prices YoY
- -17.1%
- Rents YoY
- 4.5%
- Active inventory
- 240
- Price-to-rent
- 12.8×
Monthly cashflow live
- Estimated rent
- $2,177 medium interval (Pro) →
- Mortgage (P&I)
- −$1,757
- Tax from tax record
- −$197 /mo · $2,367/yr
- Insurance
- −$140
- HOA
- −$0
- Vacancy / Maint / Mgmt
- −$457
- Net cashflow
- $-374
Break-even live
Sensitivity live
| Price | -10% $-185 | -5% $-279 | +0% $-374 | +5% $-469 | +10% $-564 |
|---|---|---|---|---|---|
| Rent | -10% $-546 | -5% $-460 | +0% $-374 | +5% $-288 | +10% $-202 |
| Rate | -1.0pp $-205 | -0.5pp $-289 | base $-374 | +0.5pp $-461 | +1.0pp $-549 |
UW: 25.0% down · 7.5% · 30yr · 1.5% tax · 5.0% vac · 8.0% maint · 8.0% mgmt
Financing live
Cash to close
- Down payment
- $83,750
- Closing costs
- $10,050
- Reserves months
- —
- Total cash needed
- —
Loan-product check · same deal, 3 products live
Conventional
25% down · 7.5% · 30yr
- Down + closing
- —
- Monthly P&I
- —
- Monthly cashflow
- —
- DSCR
- —
- Eligible?
- —
Personal DTI + credit; lowest rate.
DSCR
20% down · 8.5% · 30yr
- Down + closing
- —
- Monthly P&I
- —
- Monthly cashflow
- —
- DSCR
- —
- Eligible?
- —
No personal income docs; deal must DSCR.
Hard money
10% down · 12.0% · 12mo
- Down + closing
- —
- Monthly P&I
- —
- Monthly cashflow
- —
- DSCR
- —
- Eligible?
- —
Short-term bridge; refi at stabilization.
Rent comps 1 comps
| Address | Beds | Baths | Sqft | Rent | $/sqft | DOM | Units | Dist |
|---|---|---|---|---|---|---|---|---|
| 107 Pocono Ct Bonaire, GA | 4.0 | 2.5 | 2781 | $2,600 | $0.93 | 15d | 1 | 1.34mi |
Listing history 14 events
-
2026-06-21days on market $335,000 Active 17 DOM
-
2026-06-19days on market $335,000 Active 15 DOM
-
2026-06-18days on market $335,000 Active 14 DOM
-
2026-06-17days on market $335,000 Active 13 DOM
-
2026-06-16days on market $335,000 Active 12 DOM
-
2026-06-15days on market $335,000 Active 11 DOM
-
2026-06-14days on market $335,000 Active 9 DOM
-
2026-06-13days on market $335,000 Active 8 DOM
-
2026-06-10days on market $335,000 Active 6 DOM
-
2026-06-09days on market $335,000 Active 5 DOM
-
2026-06-08days on market $335,000 Active 4 DOM
-
2026-06-07days on market $335,000 Active 3 DOM
-
2026-06-05remarks 687-char remark
-
2026-06-05$335,000 Active 1 DOM
ⓘ Source: listings_history table (triggers on properties + properties_extension) + one-shot
backfill from property_details.listing_events for pre-trigger history.
Tax reassessment forecast GA · Resets to sale price
- Current annual tax
- $2,367 · $197/mo
- Projected year-2 tax
- $3,082 · $257/mo
- Expected delta
- +$715/yr (+$60/mo · 30.2%)
ⓘ Screening estimate from a state-policy table — verify with the county assessor before closing.
Climate risk First Street
- Flood 1/10 Low FEMA zone X (unshaded) · 0% chance over 30 yrs
- Wildfire 3/10 Moderate
- Heat 7/10 Severe 7 d/yr ≥109°F today · 19 d/yr by 30 yrs out
- Wind 8/10 Severe 80% chance of damaging wind over 30 yrs
- Air quality 3/10 Moderate 3 unhealthy d/yr today · 4 by 30 yrs out
Nearby sold comps map
Loading sold comps map…
Walkable amenities ~0.75 mi
Loading nearby amenities…
Taxation est. · year 1
- Rental income
- $26,118
- − Mortgage interest
- −$18,765
- − Property taxes
- −$2,367
- − Insurance
- −$1,675
- − Repairs & maintenance
- −$2,089
- − Management
- −$2,089
- − Depreciation
- −$9,745
- Taxable loss
- −$10,614
- Est. tax savings @ 24.0%
- +$2,547
- After-tax cash flow
- $-1,943/yr
For passive investors: Depreciation is non-cash, so a rental often shows a tax loss while cash-flowing — sheltering income. Rental losses are passive: they offset passive income freely, and up to $25,000/yr can offset ordinary (W-2) income if you actively participate and your MAGI is under $100k (phasing out to $0 by $150k); unused losses carry forward. On sale, claimed depreciation is recaptured at up to 25%, and gains may owe capital-gains tax (a 1031 exchange can defer both). Figures are a year-1 estimate at your 24.0% rate — not tax advice; consult a CPA.
Schools (NCES district)
- District
- Houston County
- NCES district ID
- 1302880
- Math proficiency
- 43% ▼ -7.00%
- Reading proficiency
- 46% ▼ -2.00%
- Median HH income
- $54,823
- Composite
- 38.68/100
- National rank
- #4144
- State rank
- #23 of 174 in GA
Livability — Warner Robins
- Score
- 65/100
- State rank
- #227
- US rank
- #13290
Category grades
Schools grade is shown separately in the Schools card above.
Census & demographics
- County
- Houston County · 157,321 people
- City population
- 92,102
- Metro
- Warner Robins, GA
- Population (ZIP)
- 22,063
- Household income
- $110,461
- Rent vs Own
- Severe rent burden
- 212.0
Population outlook (Houston County) Hauer SSP2
- Today (2025)
- 169,502 people
- By 2030
- 178,486 · +5.3%
- By 2040
- 194,642 · +14.8%
- By 2050
- 207,119 · +22.2%
- By 2075
- 231,480 · +36.6%
- By 2100
- 235,034 · +38.7%
Race, ethnicity, and origin ACS 2023
- Neighborhood character
- Diverse neighborhood (Simpson 0.57)
- Race & ethnicity
- White 61% Black 23% Two or more races 11% Hispanic / Latino 8% Asian 1%
- Hispanic origin (detail)
- Mexican 3% Puerto Rican 1% Salvadoran 1%
- Common ancestry
- Italian 3% Lithuanian 2% Serbian 1%
- Foreign-born
- 5% · Canada
- Languages at home
- 96% English-only · Spanish 2% French/Haitian/Cajun 1% German/W. Germanic 1%
Political lean MEDSL · Houston
- 2024 margin
- R (+11.3) · D 44.0% · R 55.3%
- 2008→2024 swing
- +8.9pp toward D · 2008: -20.2pp · 2024: -11.3pp
- All cycles
- 2024: R+11.3 2020: R+12.4 2016: R+21.6 2012: R+20.7 2008: R+20.2
Not yet ingested
- Civics
- —
Market trends
- HPI YoY
- ▼ -43.85%
- Current HPI
- 213.0605
- Rent YoY
- ▲ 4.53%
- Metro
- Warner Robins, GA
- State GDP YoY
- ▲ 2.66%
- F500 in state
- 28
Industry mix (Fortune 500 HQ in GA)
| Industry | F500 HQs | Revenue |
|---|---|---|
| Paper / Packaging | 2 | $29B |
|
||
| Retail | 1 | $160B |
|
||
| Transportation / Logistics | 1 | $91B |
|
||
| Airlines | 1 | $62B |
|
||
| Consumer Goods | 1 | $47B |
|
||
| Utilities | 1 | $25B |
|
||
Price history
+86.9% since first listed4 events — show timeline
- 2026-06-05 Listed $335,000 FSBO.com
- 2014-06-04 Sold (Public Records) $178,000 Public Records
- 2014-05-23 Sold (MLS) $178,000 GAMLS
- 2004-07-01 Sold (Public Records) $179,250 Public Records
Property tax history
+2.8%/yrLatest (2025): $2,367 · +35.8% YoY. Source: county tax records.
Cash-flow waterfall
monthlySold comps — $/sqft
last 12 mo · ≤1 miLoading sold comps…