367 Roxbury Park Plan · Goshen, IN
Flood risk No data
- FEMA flood zone
- —
- Chance of flooding over 30 yrs
- —
- Est. flood insurance / yr
- —
Fire risk No data
- Est. fire insurance / yr
- —
Heat risk No data
- Hot days now (above threshold)
- —
- Hot days in 30 yrs
- —
Wind risk No data
- Chance of severe wind over 30 yrs
- —
Air-quality risk No data
- Unhealthy air days now
- —
- Unhealthy air days in 30 yrs
- —
Risk factors via First Street. Map © Google.
Why this score? — see what drove the B- grade
The composite is a weighted blend of 9 inputs, each scored 0–100. Each bar is that input's sub-score; the figure is the points it added to the 100-point composite (weight × sub-score).
- Cash flow +30.0/30.0
- 1% rule +10.0/10.0
- DSCR +10.0/10.0
- ARV discount +7.5/15.0
- Livability +4.2/5.0
- Schools +3.0/10.0
- Rent growth +2.5/5.0
- Condition / age +1.0/5.0
- Appreciation +0.0/10.0
$81,995
🖨 Deal sheet 📄 Offer letter ✓ Due diligence
Listing remarks
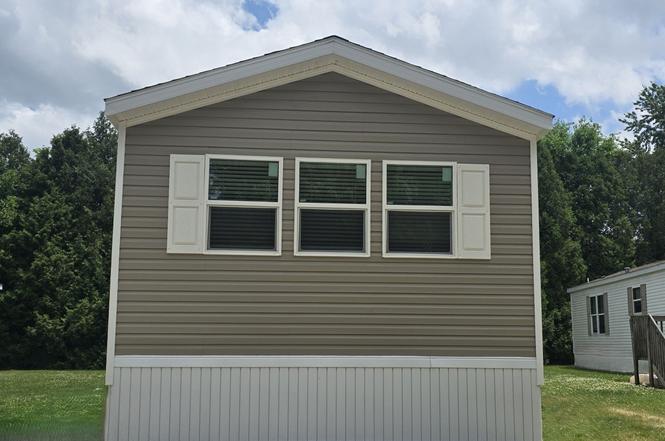
BRAND NEW & MOVE-IN READY! 1,056 Sq. Ft. Modern Living Step into your dream home! This brand-new, 3-bedroom, 2-bathroom manufactured home offers the perfect blend of style, space, and affordability. Step inside to an expansive, sun-drenched open floor plan combining the main living area, dining space, and kitchen. The contemporary kitchen comes fully equipped with brand-new, energy-efficient appliances, stylish cabinetry, and ample counter space.
Key facts
- Stylish cabinetry
- Open floor plan
- Contemporary kitchen
Tags
Property features AI
Finance
- Financial info: List price $81,995
Exterior
- Home design: Single-family plan home; Inventory type: Plan
- Construction: Living area approximately 1,056
- Exterior features: Located at 403 Post Rd, Goshen, IN 46526
Interior
- Bedrooms: 3 bedrooms
- Bathrooms: 2 bathrooms (full)
- Interior features: Plan home (367 Roxbury Park)
Neighborhood map
What this means for you Summary
Snapshot
- This is a 3-bed/2.0-bath manufactured listed at $82k. Condition is rated poor.
Deal economics
- At list price, monthly cash flow is $410 ($5k/yr) — positive.
- The deal already cash-flows at list — no discount required.
- Meets the 1% rule at list price ($1k rent vs $82k).
- Cap rate 12.3% vs local median 3.2% in Goshen — top-decile yield for the area; either an underpriced asset or a hidden risk that comps aren't pricing in. Stress-test before assuming the spread holds.
Location & tenants
- Location reads 85/100 on livability (#4 in IN, #622 nationally) — a professional / high-income tenant draw. Strengths: commute A+, cost of living A+, housing A+; Watch: schools D+, employment D+.
- Goshen Community Schools (urban): math 31% / reading 40% proficiency, ranked #190 of 301 in IN (top 63%) — families likely to look elsewhere, expect single-tenant / working-renter base with shorter leases.
- Market conditions: 101 active listings in the ZIP; 9 comparable units currently listed for rent nearby; rentals at typical pace (median 21d on market — plan ~3-4 weeks tenant-placement turnaround); 484 units permitted in Elkhart County in 2024 (136 in 5+ unit buildings).
Forward outlook
- Local home prices are declining (-3.0%/yr); year-one equity from $567 of loan paydown is wiped out by about $2k of value loss. Plan a longer hold.
- Elkhart County population projected at +7% by 2050 — modest demand growth; plan on rents tracking national, not racing it.
- At projected returns (-3.0% appreciation + 3.0% rent growth), your $23k cash investment doubles in ~6 years — after that, you're playing with house money.
Negotiation context
- Only 8 days on market — expect competitive offers; lowballing is unlikely to land.
Questions for the listing agent
- Have any recent inspections been done? Can we get a copy of the seller's disclosures and any deferred-maintenance estimates?
- Is there a deadline driving the sale (1031 exchange, divorce, estate, relocation)? That informs how much negotiation room exists.
- Schools are D-rated, which usually means shorter tenancies and higher turnover. Who's the typical renter profile here, and what's been the actual vacancy rate?
- What's the average days-on-market for RENTAL listings here right now (not sales)? A rising rental-DOM trend means longer vacancies and softer asking-rent achievability than the comps imply.
- What's the recent tenant-quality profile in this submarket — average credit score on applications, eviction rate, late-payment / NSF rate, and stable-employment percentage? A property-management company in the area should have these aggregated.
- How much new for-sale + rental construction is in the pipeline within 1–3 miles? Heavy new supply typically softens prices + rents 12–24 months out; constrained supply supports both.
Investment metrics
- 1% rule
- 1.51% ✓
- Cap rate
- 12.29%
- Cash-on-cash
- 21.41%
- DSCR
- 1.95
- GRM
- 5.5
CMA / ARV
No comps found within radius.
Projected returns pro-forma
-3.0% appreciation · 3.0% rent growth · sell at horizon
- IRR
- 14.0%
- Equity multiple
- 1.56×
- Total profit
- $12,817
- Equity at exit
- $12,226
- IRR
- 22.8%
- Equity multiple
- 2.95×
- Total profit
- $44,826
- Equity at exit
- $7,089
Cash invested: $22,959 (down + closing). Projections, not guarantees.
Landlord ↔ Tenant lean methodology
- Overall (STATE)
- 90 Strongly Landlord-Friendly
- State Indiana
- 90 Strongly Landlord-Friendly · R+11
- County
- — inherits STATE
- City
- — inherits STATE
ZIP-level market 46526
- Home prices YoY
- -28.8%
- Active inventory
- 101
- Price-to-rent
- 5.5×
Monthly cashflow live
- Estimated rent
- $1,236 high interval (Pro) →
- Mortgage (P&I)
- −$430
- Tax est. 1.5%
- −$102 /mo · $1,230/yr
- Insurance
- −$34
- HOA
- −$0
- Vacancy / Maint / Mgmt
- −$259
- Net cashflow
- $410
Break-even live
UW: 25.0% down · 7.5% · 30yr · 1.5% tax · 5.0% vac · 8.0% maint · 8.0% mgmt
Financing live
Cash to close
- Down payment
- $20,499
- Closing costs
- $2,460
- Reserves months
- —
- Total cash needed
- —
Loan-product check · same deal, 3 products live
Conventional
25% down · 7.5% · 30yr
- Down + closing
- —
- Monthly P&I
- —
- Monthly cashflow
- —
- DSCR
- —
- Eligible?
- —
Personal DTI + credit; lowest rate.
DSCR
20% down · 8.5% · 30yr
- Down + closing
- —
- Monthly P&I
- —
- Monthly cashflow
- —
- DSCR
- —
- Eligible?
- —
No personal income docs; deal must DSCR.
Hard money
10% down · 12.0% · 12mo
- Down + closing
- —
- Monthly P&I
- —
- Monthly cashflow
- —
- DSCR
- —
- Eligible?
- —
Short-term bridge; refi at stabilization.
Rent comps 9 comps
| Address | Beds | Baths | Sqft | Rent | $/sqft | DOM | Units | Dist |
|---|---|---|---|---|---|---|---|---|
| 403 Post Rd Goshen, IN | 2.0 | 2.0 | 960 | $1,249 | $1.30 | 21d | 1 | 0.02mi |
| 217 Tanglewood Dr Unit 217-D Tanglewood Goshen, IN | 2.0 | 1.0 | 982 | $925 | $0.94 | 21d | 1 | 0.31mi |
| 220 Tanglewood Dr Goshen, IN | 3.0 | 2.0 | 1100 | $1,600 | $1.45 | 21d | 1 | 0.34mi |
| 61108 Old County Road 17 Goshen, IN | 3.0 | 2.0 | 1216 | $1,249 | $1.03 | 21d | 1 | 0.86mi |
| 1227 Briarwood Blvd Goshen, IN | 1.0–2.0 | 1.0–1.5 | 1161 | $1,350 | $1.16 | 21d | 1 | 0.93mi |
| 1816 Tiffany Ct Unit 1816-C Goshen, IN | 2.0 | 1.0 | 840 | $925 | $1.10 | 43d | 1 | 1.21mi |
| 212 S Silverwood Ln Unit 212-A Goshen, IN | 2.0 | 1.0 | 825 | $995 | $1.21 | 43d | 1 | 1.22mi |
| 521 S Silverwood Ln Unit F Goshen, IN | 2.0 | 1.5 | 900 | $925 | $1.03 | 21d | 1 | 1.24mi |
| 2011 W Wilden Ave Goshen, IN | 1.0–3.0 | 1.0–2.0 | 1022 | $1,100 | $1.08 | 21d | 1 | 1.29mi |
Listing history 8 events
-
2026-06-19days on market $81,995 Active 8 DOM
-
2026-06-18days on market $81,995 Active 7 DOM
-
2026-06-17days on market $81,995 Active 6 DOM
-
2026-06-16days on market $81,995 Active 5 DOM
-
2026-06-15days on market $81,995 Active 4 DOM
-
2026-06-14days on market $81,995 Active 2 DOM
-
2026-06-13remarks 452-char remark
-
2026-06-13$81,995 Active 1 DOM
ⓘ Source: listings_history table (triggers on properties + properties_extension) + one-shot
backfill from property_details.listing_events for pre-trigger history.
Nearby sold comps map
Loading sold comps map…
Walkable amenities ~0.75 mi
Loading nearby amenities…
Taxation est. · year 1
- Rental income
- $14,829
- − Mortgage interest
- −$4,593
- − Property taxes
- −$1,230
- − Insurance
- −$410
- − Repairs & maintenance
- −$1,186
- − Management
- −$1,186
- − Depreciation
- −$2,385
- Taxable income
- $3,838
- Est. tax owed @ 24.0%
- −$921
- After-tax cash flow
- $3,994/yr
For passive investors: Depreciation is non-cash, so a rental often shows a tax loss while cash-flowing — sheltering income. Rental losses are passive: they offset passive income freely, and up to $25,000/yr can offset ordinary (W-2) income if you actively participate and your MAGI is under $100k (phasing out to $0 by $150k); unused losses carry forward. On sale, claimed depreciation is recaptured at up to 25%, and gains may owe capital-gains tax (a 1031 exchange can defer both). Figures are a year-1 estimate at your 24.0% rate — not tax advice; consult a CPA.
Condition & rehab AI · 1 photo
This manufactured home requires extensive repairs and updates to its roof, exterior, flooring, interior walls, bathrooms, kitchen, HVAC/mechanical systems, and landscaping. Significant investment is needed to bring it up to a move-in-ready condition.
Repairs flagged
- Major roof — No visible roof in the satellite image.
- Major exterior — No visible exterior in the satellite image.
- Major flooring — No visible flooring in the satellite image.
- Major interior walls/paint — No visible interior walls/paint in the satellite image.
- Major bathrooms — No visible bathrooms in the satellite image.
- Major kitchen — No visible kitchen in the satellite image.
- Major systems — No visible systems in the satellite image.
- Major HVAC/mechanicals — No visible HVAC/mechanicals in the satellite image.
- Major landscaping/curb appeal — No visible landscaping/curb appeal in the satellite image.
Value-add opportunities
- Both roof replacement — A new roof would significantly improve the home's appearance and value.
- Both exterior painting/staining — A fresh coat of paint/staining would enhance curb appeal and value.
- Both flooring replacement — New flooring would improve the home's condition and value.
- Both interior painting — Fresh paint would improve the home's condition and value.
- Both bathroom updates — Updated bathrooms would improve the home's condition and value.
- Both kitchen updates — Updated kitchen would improve the home's condition and value.
- Both HVAC/mechanical upgrades — Upgraded HVAC/mechanical systems would improve the home's condition and value.
- Both landscaping — Landscaping would improve the home's curb appeal and value.
Renovation cost estimate screening
| Repair item | Severity | Est. cost |
|---|---|---|
| roof · No visible roof in the satellite image. | Major | $15,000–50,000 |
| exterior · No visible exterior in the satellite image. | Major | $15,000–50,000 |
| flooring · No visible flooring in the satellite image. | Major | $15,000–50,000 |
| interior walls/paint · No visible interior walls/paint in the satellite image. | Major | $15,000–50,000 |
| bathrooms · No visible bathrooms in the satellite image. | Major | $15,000–50,000 |
| kitchen · No visible kitchen in the satellite image. | Major | $15,000–50,000 |
| systems · No visible systems in the satellite image. | Major | $15,000–50,000 |
| HVAC/mechanicals · No visible HVAC/mechanicals in the satellite image. | Major | $15,000–50,000 |
| landscaping/curb appeal · No visible landscaping/curb appeal in the satellite image. | Major | $15,000–50,000 |
| Total estimated repair cost · 9 items | $135,000–450,000 |
Value-add ROI direction
- Both roof replacement — A new roof would significantly improve the home's appearance and value. ↑
- Both exterior painting/staining — A fresh coat of paint/staining would enhance curb appeal and value. ↑
- Both flooring replacement — New flooring would improve the home's condition and value. ↑
- Both interior painting — Fresh paint would improve the home's condition and value. ↑
- Both bathroom updates — Updated bathrooms would improve the home's condition and value. ↑
- Both kitchen updates — Updated kitchen would improve the home's condition and value. ↑
- Both HVAC/mechanical upgrades — Upgraded HVAC/mechanical systems would improve the home's condition and value. ↑
- Both landscaping — Landscaping would improve the home's curb appeal and value. ↑
ⓘ Cost ranges are severity-bucket heuristics (US national rule-of-thumb). Get contractor quotes + a written scope before underwriting a rehab budget.
Schools (NCES district)
- District
- Goshen Community Schools
- NCES district ID
- 1803930
- Math proficiency
- 31% ▼ -11.00%
- Reading proficiency
- 40% ▼ -4.00%
- Median HH income
- $44,892
- Composite
- 30.24/100
- National rank
- #6292
- State rank
- #190 of 301 in IN
Livability — Goshen
- Score
- 85/100
- State rank
- #4
- US rank
- #622
Category grades
Schools grade is shown separately in the Schools card above.
Census & demographics
- Census place
- Goshen, IN
- County
- Elkhart County · 107,928 people
- City population
- 33,668
- Metro
- Elkhart-Goshen, IN
- Population (ZIP)
- 33,668
- Household income
- $67,461
- Rent vs Own
- Severe rent burden
- 934.0
Population outlook (Elkhart County) Hauer SSP2
- Today (2025)
- 213,761 people
- By 2030
- 218,103 · +2.0%
- By 2040
- 225,381 · +5.4%
- By 2050
- 229,447 · +7.3%
- By 2075
- 232,856 · +8.9%
- By 2100
- 214,088 · +0.2%
Race, ethnicity, and origin ACS 2023
- Neighborhood character
- Predominantly White (67%)
- Race & ethnicity
- White 67% Hispanic / Latino 26% Two or more races 12% Black 2% Asian 1%
- Hispanic origin (detail)
- Mexican 16% Puerto Rican 4%
- Common ancestry
- Romanian 2% Italian 2% Lithuanian 2%
- Foreign-born
- 14% · Canada, China
- Languages at home
- 73% English-only · Spanish 21% German/W. Germanic 4%
Political lean MEDSL · Elkhart
- 2024 margin
- Solid R (+32.4) · D 33.1% · R 65.5% · Other 1.4%
- 2008→2024 swing
- -21.2pp toward R · 2008: -11.2pp · 2024: -32.4pp
- All cycles
- 2024: R+32.4 2020: R+28.1 2016: R+32.4 2012: R+26.5 2008: R+11.2
Not yet ingested
- Civics
- —
Market trends
- HPI YoY
- ▼ -89.57%
- Current HPI
- 221.643
- Rent YoY
- —
- Metro
- Elkhart-Goshen, IN
- State GDP YoY
- ▲ 2.90%
- F500 in state
- 18
Industry mix (Fortune 500 HQ in IN)
| Industry | F500 HQs | Revenue |
|---|---|---|
| Industrial Machinery | 2 | $37B |
|
||
| Healthcare | 1 | $177B |
|
||
| Pharmaceuticals | 1 | $45B |
|
||
| Metals / Steel | 1 | $18B |
|
||
| Agriculture | 1 | $17B |
|
||
| Packaging | 1 | $12B |
|
||
Cash-flow waterfall
monthlySold comps — $/sqft
last 12 mo · ≤1 miLoading sold comps…