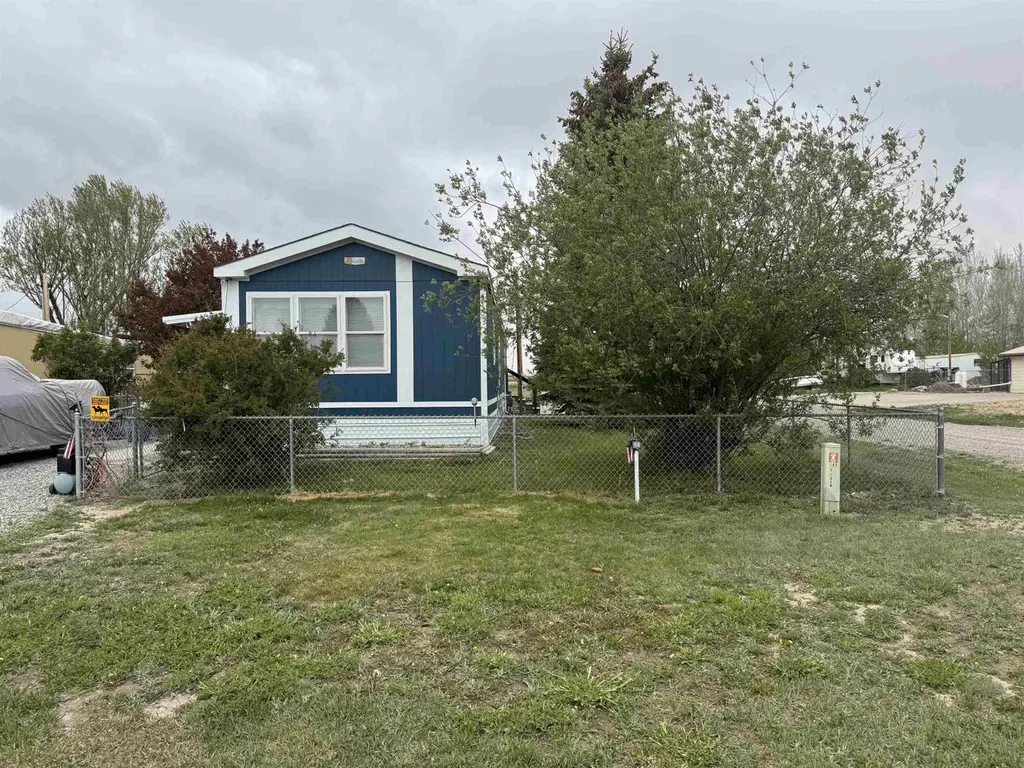
302 S Main St. St · Pavillion, WY
Flood risk 1/10 · Minimal
- FEMA flood zone
- D
- Chance of flooding over 30 yrs
- 0.0%
- Est. flood insurance / yr
- $544 – $1,084
Fire risk 6/10 · Moderate
- Est. fire insurance / yr
- $564 – $1,046
Heat risk 2/10 · Minimal
- Hot days now (above 89°F)
- 7 days/yr
- Hot days in 30 yrs
- 17 days/yr
Wind risk 1/10 · Minimal
- Chance of severe wind over 30 yrs
- —
Air-quality risk 2/10 · Minimal
- Unhealthy air days now
- 1 days/yr
- Unhealthy air days in 30 yrs
- 3 days/yr
Risk factors via First Street. Map © Google.
Why this score? — see what drove the C- grade
The composite is a weighted blend of 9 inputs, each scored 0–100. Each bar is that input's sub-score; the figure is the points it added to the 100-point composite (weight × sub-score).
- Cash flow +20.0/30.0
- Appreciation +6.5/10.0
- DSCR +6.4/10.0
- 1% rule +5.3/10.0
- Schools +3.9/10.0
- Livability +3.2/5.0
- Rent growth +2.5/5.0
- Condition / age +2.5/5.0
- ARV discount +0.0/15.0
$113,999
🖨 Deal sheet 📄 Offer letter ✓ Due diligence
Key facts
- Covered deck
- Spacious yard
- Open floor plan
Tags
Property features AI
Exterior
- Parking: No garage
- Utilities: Public water; Public sewer; Natural gas available
- Home design: Single family residence; Residential property
- Construction: Composition roof
- Exterior features: Deck; Chain link fencing
Interior
- Kitchen: Dishwasher; Range; Oven; Refrigerator
- Flooring: Carpet; Vinyl
- Heating & cooling: Central air; Forced air heating
- Interior features: Dishwasher; Dryer; Refrigerator; Range; Oven; Washer
- Laundry & utility: Washer; Dryer
Neighborhood map
What this means for you Summary
Snapshot
- This is a 3-bed/2.0-bath single-family listed at $114k.
Deal economics
- At list price, monthly cash flow is $141 ($2k/yr) — positive.
- The deal already cash-flows at list — no discount required.
- Meets the 1% rule at list price ($1k rent vs $114k).
- Recommended offer: $112k (1.5% below list) — sets the bar for market timing.
Location & tenants
- Location reads 65/100 on livability (#86 in WY) — a middle-class / working-renter tenant base. Strengths: cost of living A+, housing A+, schools B+; Watch: employment D, amenities F, commute F.
- Fremont County School District # 6 (rural): math 41% / reading 49% proficiency, ranked #34 of 41 in WY (top 83%) — families likely to look elsewhere, expect single-tenant / working-renter base with shorter leases.
- Market conditions: 3 active listings in the ZIP; 22 units permitted in Fremont County in 2024 (0 in 5+ unit buildings).
Forward outlook
- In year one you build about $4k of equity ($788 loan paydown + $3k appreciation (2.9% local appreciation)).
- Fremont County population projected at -13% by 2050 — secular population decline; favor cash flow + early exit over multi-decade hold.
- At projected returns (2.9% appreciation + 3.0% rent growth), your $32k cash investment doubles in ~5 years — after that, you're playing with house money.
- By year 8, paydown + projected appreciation supports a ~$31k cash-out refi (75% LTV) — recoverable capital for the next deal without selling this one.
Negotiation context
- It's been on market 20 days — a 2% lower offer ($112k) is reasonable based on typical stale-listing flexibility.
Risks & watch-outs
- Climate carrying-cost: major wildfire risk — expect insurance premiums to compound above CPI over the hold.
Questions for the listing agent
- Is there a deadline driving the sale (1031 exchange, divorce, estate, relocation)? That informs how much negotiation room exists.
- Schools are B-rated — typically a magnet for longer-tenancy family renters. What's the average tenant stay here, and is there a school-zone premium baked into asking?
- What's the average days-on-market for RENTAL listings here right now (not sales)? A rising rental-DOM trend means longer vacancies and softer asking-rent achievability than the comps imply.
- What's the recent tenant-quality profile in this submarket — average credit score on applications, eviction rate, late-payment / NSF rate, and stable-employment percentage? A property-management company in the area should have these aggregated.
- How much new for-sale + rental construction is in the pipeline within 1–3 miles? Heavy new supply typically softens prices + rents 12–24 months out; constrained supply supports both.
Investment metrics
- 1% rule
- 1.03% ✓
- Cap rate
- 7.77%
- Cash-on-cash
- 5.28%
- DSCR
- 1.24
- GRM
- 8.1
CMA / ARV
- ARV (on-the-fly)
- $80,256
- Comps found
- 4
Show comp detail 4 sales within ~0.75 mi
| Address | Dist | Beds/Ba | Sqft | Sold | Price | $/sf | Match |
|---|---|---|---|---|---|---|---|
| 304 S Cherry | 0.07mi | 3/2.0 | 1,216 (0%) | 13mo | $99,900 | $82 | 86 |
| 109 N Cherry St | 0.21mi | 3/1.0 | 1,200 (-1%) | 1mo | $72,500 | $60 | 83 |
| 309 S Cherry St | 0.11mi | 3/2.0 | 1,050 (-14%) | 11mo | $69,000 | $66 | 63 |
| 309 N Pine Pne | 0.33mi | 2/1.0 (-1) | 1,273 (+5%) | 20mo | $57,500 | $45 | 51 |
Match score weights: distance 35% · size 25% · config 20% · recency 20%. Top-matched comps best support the ARV.
Projected returns pro-forma
2.93% appreciation · 3.0% rent growth · sell at horizon
- IRR
- 12.3%
- Equity multiple
- 1.70×
- Total profit
- $22,307
- Equity at exit
- $50,841
- IRR
- 14.4%
- Equity multiple
- 3.11×
- Total profit
- $67,401
- Equity at exit
- $78,029
Cash invested: $31,920 (down + closing). Projections, not guarantees.
Landlord ↔ Tenant lean methodology
- Overall (STATE)
- 90 Strongly Landlord-Friendly
- State Wyoming
- 90 Strongly Landlord-Friendly · R+25
- County
- — inherits STATE
- City
- — inherits STATE
ZIP-level market 82523
- Home prices YoY
- 1.7%
- Active inventory
- 3
- Price-to-rent
- 8.1×
Monthly cashflow live
- Estimated rent
- $1,175 medium interval (Pro) →
- Mortgage (P&I)
- −$598
- Tax est. 1.5%
- −$142 /mo · $1,710/yr
- Insurance
- −$47
- HOA
- −$0
- Vacancy / Maint / Mgmt
- −$247
- Net cashflow
- $141
Break-even live
UW: 25.0% down · 7.5% · 30yr · 1.5% tax · 5.0% vac · 8.0% maint · 8.0% mgmt
Financing live
Cash to close
- Down payment
- $28,500
- Closing costs
- $3,420
- Reserves months
- —
- Total cash needed
- —
Loan-product check · same deal, 3 products live
Conventional
25% down · 7.5% · 30yr
- Down + closing
- —
- Monthly P&I
- —
- Monthly cashflow
- —
- DSCR
- —
- Eligible?
- —
Personal DTI + credit; lowest rate.
DSCR
20% down · 8.5% · 30yr
- Down + closing
- —
- Monthly P&I
- —
- Monthly cashflow
- —
- DSCR
- —
- Eligible?
- —
No personal income docs; deal must DSCR.
Hard money
10% down · 12.0% · 12mo
- Down + closing
- —
- Monthly P&I
- —
- Monthly cashflow
- —
- DSCR
- —
- Eligible?
- —
Short-term bridge; refi at stabilization.
Listing history 15 events
-
2026-06-19days on market $113,999 Active 20 DOM
-
2026-06-18days on market $113,999 Active 19 DOM
-
2026-06-17days on market $113,999 Active 18 DOM
-
2026-06-16days on market $113,999 Active 17 DOM
-
2026-06-15days on market $113,999 Active 16 DOM
-
2026-06-14days on market $113,999 Active 14 DOM
-
2026-06-12days on market $113,999 Active 13 DOM
-
2026-06-09days on market $113,999 Active 10 DOM
-
2026-06-08days on market $113,999 Active 9 DOM
-
2026-06-07days on market $113,999 Active 8 DOM
-
2026-06-05days on market $113,999 Active 6 DOM
-
2026-06-04days on market $113,999 Active 4 DOM
-
2026-06-02days on market $113,999 Active 3 DOM
-
2026-06-01days on market $113,999 Active 2 DOM
-
2026-05-31$113,999 Active 1 DOM
ⓘ Source: listings_history table (triggers on properties + properties_extension) + one-shot
backfill from property_details.listing_events for pre-trigger history.
Climate risk First Street
- Flood 1/10 Low FEMA zone D · 0% chance over 30 yrs
- Wildfire 6/10 Major
- Heat 2/10 Low 7 d/yr ≥89°F today · 17 d/yr by 30 yrs out
- Wind 1/10 Low
- Air quality 2/10 Low 1 unhealthy d/yr today · 3 by 30 yrs out
Nearby sold comps map
Loading sold comps map…
Walkable amenities ~0.75 mi
Loading nearby amenities…
Taxation est. · year 1
- Rental income
- $14,101
- − Mortgage interest
- −$6,386
- − Property taxes
- −$1,710
- − Insurance
- −$570
- − Repairs & maintenance
- −$1,128
- − Management
- −$1,128
- − Depreciation
- −$3,316
- Taxable loss
- −$137
- Est. tax savings @ 24.0%
- +$33
- After-tax cash flow
- $1,719/yr
For passive investors: Depreciation is non-cash, so a rental often shows a tax loss while cash-flowing — sheltering income. Rental losses are passive: they offset passive income freely, and up to $25,000/yr can offset ordinary (W-2) income if you actively participate and your MAGI is under $100k (phasing out to $0 by $150k); unused losses carry forward. On sale, claimed depreciation is recaptured at up to 25%, and gains may owe capital-gains tax (a 1031 exchange can defer both). Figures are a year-1 estimate at your 24.0% rate — not tax advice; consult a CPA.
Schools (NCES district)
- District
- Fremont County School District # 6
- NCES district ID
- 5602830
- Math proficiency
- 41% ▼ -12.00%
- Reading proficiency
- 49% ▼ -12.00%
- Median HH income
- $50,976
- Composite
- 38.71/100
- National rank
- #4140
- State rank
- #34 of 41 in WY
Livability — Pavillion
- Score
- 65/100
- State rank
- #86
- US rank
- #13504
Category grades
Schools grade is shown separately in the Schools card above.
Census & demographics
- Census place
- Pavillion, WY
- Population (ZIP)
- 993
Population outlook (Fremont County) Hauer SSP2
- Today (2025)
- 39,368 people
- By 2030
- 38,412 · -2.4%
- By 2040
- 36,224 · -8.0%
- By 2050
- 34,314 · -12.8%
- By 2075
- 30,353 · -22.9%
- By 2100
- 25,821 · -34.4%
Race, ethnicity, and origin ACS 2023
- Neighborhood character
- Predominantly White (81%)
- Race & ethnicity
- White 81% Two or more races 10% Hispanic / Latino 5% Native American 4% Pacific Islander 3%
- Common ancestry
- Iranian 5% Slovak 4% Serbian 4%
- Foreign-born
- 3% · Canada
- Languages at home
- 92% English-only · German/W. Germanic 3% Other Asian/Pacific 3% Spanish 1%
Political lean MEDSL · Fremont
- 2024 margin
- Solid R (+37.4) · D 30.4% · R 67.7% · Other 1.9%
- 2008→2024 swing
- -8.6pp toward R · 2008: -28.8pp · 2024: -37.4pp
- All cycles
- 2024: R+37.4 2020: R+35.8 2016: R+42.1 2012: R+34.1 2008: R+28.8
Not yet ingested
- Civics
- —
Market trends
- HPI YoY
- ▲ 2.93%
- Current HPI
- 175.3679
- Rent YoY
- —
- Metro
- —
- State GDP YoY
- —
- F500 in state
- 0
Price history
1 event — show timeline
- 2026-05-30 Listed $113,999 WMLS
Property tax history
-1.7%/yrLatest (2025): $99 · -22.2% YoY. Source: county tax records.
Cash-flow waterfall
monthlySold comps — $/sqft
last 12 mo · ≤1 miLoading sold comps…