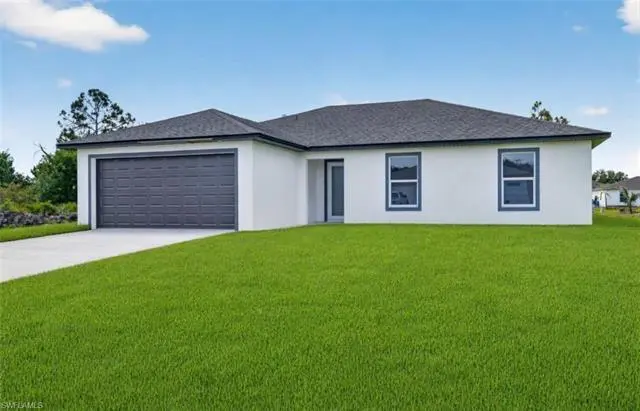
704 Carbon St E · Lehigh Acres, FL
Flood risk No data
- FEMA flood zone
- —
- Chance of flooding over 30 yrs
- —
- Est. flood insurance / yr
- —
Fire risk No data
- Est. fire insurance / yr
- —
Heat risk No data
- Hot days now (above threshold)
- —
- Hot days in 30 yrs
- —
Wind risk No data
- Chance of severe wind over 30 yrs
- —
Air-quality risk No data
- Unhealthy air days now
- —
- Unhealthy air days in 30 yrs
- —
Risk factors via First Street. Map © Google.
Why this score? — see what drove the D- grade
The composite is a weighted blend of 9 inputs, each scored 0–100. Each bar is that input's sub-score; the figure is the points it added to the 100-point composite (weight × sub-score).
- Appreciation +10.0/10.0
- Cash flow +7.6/30.0
- ARV discount +7.5/15.0
- Schools +4.1/10.0
- Livability +3.0/5.0
- Condition / age +2.5/5.0
- 1% rule +2.2/10.0
- DSCR +1.7/10.0
- Rent growth +1.3/5.0
$294,000
🖨 Deal sheet 📄 Offer letter ✓ Due diligence
Listing remarks
BRAND NEW 2026 This move-in-ready property in Lehigh Acres, Florida, boasts several attractive features: Impact Windows and Doors: The home is equipped with impact windows and doors throughout, a significant advantage in Florida's climate. Modern Appliances: It includes stainless steel appliances, suggesting a modern and convenient living space.
Key facts
- Modern appliances
- 0.24 acre lot
- 2 garage spots
Tags
Property features AI
Finance
- Other: Lot approx. 0.2402 acres (1915 sq ft lot area); Canal width between 81-120 feet; Lot described as regular; frontage ~97 ft
- HOA & community: No HOA maintenance; Non-gated community; No community amenities
Exterior
- Parking: Attached 2-car garage; Driveway (paved) with 2+ spaces
- Security: Impact resistant doors and windows; Smoke detectors
- Utilities: Well water; Septic sewer; Electric service (central)
- Home design: Residential single-family home; 1 story / ranch; Rear exposure faces north; Located in Lehigh Acres development
- Construction: Concrete block construction; Built in 2026
- Exterior features: Room for pool; Automatic sprinkler system; Impact resistant windows and doors; Stucco exterior; Shingle roof; Canal waterfront; Landscaped area view; Paved road access
Interior
- Kitchen: Cooktop - Electric; Dishwasher; Microwave; Refrigerator
- Bedrooms: 4 bedrooms; First-floor bedroom; Split bedroom floor plan
- Flooring: Tile
- Bathrooms: 2 full bathrooms; Master bathroom with dual sinks and shower (no tub)
- Heating & cooling: Central electric heating; Central electric cooling
- Interior features: Built-in cabinets; Coffered ceiling; Smoke detectors; Den (study); Dining (living); Unfurnished; Laundry in residence; Auto garage door
- Laundry & utility: Washer/dryer hookup
Neighborhood map
What this means for you Summary
Snapshot
- This is a 4-bed/2.0-bath land listed at $294k.
Deal economics
- At list price, monthly cash flow is $-355 ($-4k/yr) — negative.
- To cash-flow at today's rent, offer at most $243k (17.5% below list).
- To meet the 1% rule (rent ≥ 1% of price), the offer needs to be $212k (27.8% below list).
- Recommended offer: $212k (27.8% below list) — sets the bar for 1% rule.
Location & tenants
- Location reads 59/100 on livability (#826 in FL) — a working-class tenant base; expect higher turnover. Strengths: cost of living A+, housing A+; Watch: crime C-, employment D+, schools D-.
- Lee (suburban): math 47% / reading 50% proficiency, ranked #42 of 73 in FL (top 58%) — families likely to look elsewhere, expect single-tenant / working-renter base with shorter leases.
- Market conditions: Rents falling (-4.7%/yr); 2460 active listings in the ZIP; 40 comparable units currently listed for rent nearby; rentals at typical pace (median 16d on market — plan ~3-4 weeks tenant-placement turnaround); 15,411 units permitted in Lee County in 2024 (4,686 in 5+ unit buildings).
- This rent runs 35% of the median local income ($72k/yr) — at the standard rent-burdened threshold; future hikes will face affordability resistance.
Forward outlook
- In year one you build about $31k of equity ($2k loan paydown + $29k appreciation (10.0% local appreciation)).
- Lee County population projected at +44% by 2050 — long-run rental-demand tailwind backs the buy-and-hold thesis.
- By year 2, paydown + projected appreciation supports a ~$51k cash-out refi (75% LTV) — recoverable capital for the next deal without selling this one.
Negotiation context
- It's been on market 58 days — a 3% lower offer ($285k) is reasonable based on typical stale-listing flexibility.
- Current owner paid $22k; list at $294k implies a 1236% gain — meaningful room to come down on a strong offer.
Questions for the listing agent
- What do current leases actually rent for vs. the listed asking? Can we see a recent rent roll and the last 12 months of T-12 income?
- It's been on market 58 days. Have you received any prior offers? Is the seller open to a 28% concession, seller financing, or rate buy-down credit?
- Is there a deadline driving the sale (1031 exchange, divorce, estate, relocation)? That informs how much negotiation room exists.
- Schools are D-rated, which usually means shorter tenancies and higher turnover. Who's the typical renter profile here, and what's been the actual vacancy rate?
- The area grade is low — what's the realistic commute time and amenity access for the typical tenant pool here? Any planned neighborhood developments (good or bad) we should know about?
- What's the average days-on-market for RENTAL listings here right now (not sales)? A rising rental-DOM trend means longer vacancies and softer asking-rent achievability than the comps imply.
- What's the recent tenant-quality profile in this submarket — average credit score on applications, eviction rate, late-payment / NSF rate, and stable-employment percentage? A property-management company in the area should have these aggregated.
- How much new for-sale + rental construction is in the pipeline within 1–3 miles? Heavy new supply typically softens prices + rents 12–24 months out; constrained supply supports both.
Investment metrics
- 1% rule
- 0.72% ✗
- Cap rate
- 4.85%
- Cash-on-cash
- -5.17%
- DSCR
- 0.77
- GRM
- 11.5
CMA / ARV
No comps found within radius.
Projected returns pro-forma
10.0% appreciation · 0.0% rent growth · sell at horizon
- IRR
- 19.8%
- Equity multiple
- 2.60×
- Total profit
- $131,339
- Equity at exit
- $264,858
- IRR
- 17.6%
- Equity multiple
- 5.78×
- Total profit
- $393,463
- Equity at exit
- $571,177
Cash invested: $82,320 (down + closing). Projections, not guarantees.
Landlord ↔ Tenant lean methodology
- Overall (STATE)
- 87 Strongly Landlord-Friendly
- State Florida
- 87 Strongly Landlord-Friendly · R+3
- County
- — inherits STATE
- City
- — inherits STATE
ZIP-level market 33974
- Home prices YoY
- 5.8%
- Rents YoY
- -4.7%
- Active inventory
- 2460
- Price-to-rent
- 11.5×
Monthly cashflow live
- Estimated rent
- $2,123 high interval (Pro) →
- Mortgage (P&I)
- −$1,542
- Tax est. 1.5%
- −$368 /mo · $4,410/yr
- Insurance
- −$122
- HOA
- −$0
- Vacancy / Maint / Mgmt
- −$446
- Net cashflow
- $-355
Break-even live
UW: 25.0% down · 7.5% · 30yr · 1.5% tax · 5.0% vac · 8.0% maint · 8.0% mgmt
Financing live
Cash to close
- Down payment
- $73,500
- Closing costs
- $8,820
- Reserves months
- —
- Total cash needed
- —
Loan-product check · same deal, 3 products live
Conventional
25% down · 7.5% · 30yr
- Down + closing
- —
- Monthly P&I
- —
- Monthly cashflow
- —
- DSCR
- —
- Eligible?
- —
Personal DTI + credit; lowest rate.
DSCR
20% down · 8.5% · 30yr
- Down + closing
- —
- Monthly P&I
- —
- Monthly cashflow
- —
- DSCR
- —
- Eligible?
- —
No personal income docs; deal must DSCR.
Hard money
10% down · 12.0% · 12mo
- Down + closing
- —
- Monthly P&I
- —
- Monthly cashflow
- —
- DSCR
- —
- Eligible?
- —
Short-term bridge; refi at stabilization.
Rent comps 40 comps
| Address | Beds | Baths | Sqft | Rent | $/sqft | DOM | Units | Dist |
|---|---|---|---|---|---|---|---|---|
| 713 Cardinal St E Lehigh Acres, FL | 3.0 | 2.0 | 1100 | $1,635 | $1.49 | 3d | 1 | 0.11mi |
| 727 Cane St E Lehigh Acres, FL | 3.0 | 2.0 | 1582 | $2,000 | $1.26 | 23d | 1 | 0.24mi |
| 404 Chalet Ave S Lehigh Acres, FL | 3.0 | 2.0 | 1200 | $1,850 | $1.54 | 23d | 1 | 0.28mi |
| 406 Chalet Ave S Lehigh Acres, FL | 3.0 | 2.0 | 1200 | $1,850 | $1.54 | 23d | 1 | 0.28mi |
| 750 Cane St E Lehigh Acres, FL | 4.0 | 3.0 | 1537 | $2,800 | $1.82 | 3d | 1 | 0.33mi |
| 720 Chavers St Lehigh Acres, FL | 3.0 | 2.0 | 1547 | $2,200 | $1.42 | 23d | 1 | 0.34mi |
| 759 Cane St E Lehigh Acres, FL | 3.0 | 2.0 | 1169 | $1,950 | $1.67 | 3d | 1 | 0.40mi |
| 397 Carrillon Ave S Lehigh Acres, FL | 3.0 | 2.0 | 1200 | $1,550 | $1.29 | 3d | 1 | 0.43mi |
| 388 Bell Blvd S Lehigh Acres, FL | 3.0 | 2.0 | 1200 | $1,780 | $1.48 | 23d | 1 | 0.43mi |
| 455 Bell Blvd Unit 1 Lehigh Acres, FL | 3.0 | 2.0 | 1142 | $1,600 | $1.40 | 23d | 1 | 0.49mi |
| 374 Compese Ave S Lehigh Acres, FL | 3.0 | 2.0 | 1200 | $1,750 | $1.46 | 16d | 1 | 0.49mi |
| 346 Bell Blvd S Lehigh Acres, FL | 3.0 | 2.0 | 1185 | $1,495 | $1.26 | 14d | 1 | 0.50mi |
| 346 Bell Blvd S Lehigh Acres, FL | 3.0 | 2.0 | 1185 | $1,495 | $1.26 | 3d | 1 | 0.50mi |
| 350 Limerick Ave S Lehigh Acres, FL | 3.0 | 2.0 | 1199 | $1,800 | $1.50 | 3d | 1 | 0.55mi |
| 508 Bell Blvd S Lehigh Acres, FL | 3.0 | 2.0 | 1200 | $1,800 | $1.50 | 23d | 1 | 0.56mi |
| 825 Carbon St E Lehigh Acres, FL | 3.0 | 2.0 | 1582 | $2,300 | $1.45 | 23d | 1 | 0.57mi |
| 333 Bell Blvd S Lehigh Acres, FL | 3.0 | 2.0 | 1114 | $1,300 | $1.17 | 3d | 1 | 0.57mi |
| 270 Silent Lake Dr Lehigh Acres, FL | 4.0 | 2.0 | 1800 | $1,895 | $1.05 | 11d | 1 | 0.65mi |
| 230 E Malden Ave S Lehigh Acres, FL | 4.0 | 2.0 | 1833 | $1,875 | $1.02 | 23d | 1 | 0.67mi |
| 541 Chalet Ave S Lehigh Acres, FL | 4.0 | 3.0 | 1650 | $2,400 | $1.45 | 23d | 1 | 0.72mi |
| 515 Croydon Ave S Lehigh Acres, FL | 3.0 | 3.0 | 1253 | $2,200 | $1.76 | 3d | 1 | 0.78mi |
| 718 Sunrise Blvd Lehigh Acres, FL | 3.0 | 2.0 | 1100 | $1,610 | $1.46 | 23d | 1 | 0.78mi |
| 510 Caywood Ave S Lehigh Acres, FL | 3.0 | 2.0 | 1582 | $2,664 | $1.68 | 23d | 1 | 0.81mi |
| 219 Beckley Dr Lehigh Acres, FL | 3.0 | 2.5 | 1548 | $1,890 | $1.22 | 16d | 1 | 0.81mi |
| 573 Bell Blvd S Lehigh Acres, FL | 3.0 | 2.0 | 1218 | $1,900 | $1.56 | 14d | 1 | 0.83mi |
| 567 Charwood Ave S Lehigh Acres, FL | 3.0 | 2.0 | 1564 | $1,900 | $1.21 | 14d | 1 | 0.89mi |
| 286 Justene Cir Lehigh Acres, FL | 3.0 | 2.0 | 1839 | $1,900 | $1.03 | 23d | 1 | 0.90mi |
| 546 Whispering Wind Bnd Lehigh Acres, FL | 3.0 | 2.0 | 1437 | $1,950 | $1.36 | 2d | 1 | 0.93mi |
| 20055 Lake Vista Cir N Lehigh Acres, FL | 3.0 | 2.0 | 1442 | $1,700 | $1.18 | 23d | 1 | 0.93mi |
| 532 Ilaria Ct Lehigh Acres, FL | 4.0 | 2.0 | 1598 | $2,300 | $1.44 | 16d | 1 | 0.95mi |
| 459 Lockport Ave S Lehigh Acres, FL | 3.0 | 2.0 | 1650 | $2,000 | $1.21 | 23d | 1 | 0.98mi |
| 606 Morningmist Ln Lehigh Acres, FL | 4.0 | 2.5 | 1817 | $2,295 | $1.26 | 3d | 1 | 1.02mi |
| 598 Aston Lake Ct Lehigh Acres, FL | 3.0 | 2.0 | 1703 | $2,395 | $1.41 | 21d | 1 | 1.05mi |
| 202 Eaglesmere Dr Lehigh Acres, FL | 3.0 | 2.0 | 1443 | $1,600 | $1.11 | 3d | 1 | 1.05mi |
| 202 Eaglesmere Dr Lehigh Acres, FL | 3.0 | 2.0 | 1443 | $1,695 | $1.17 | 23d | 1 | 1.05mi |
| 604 Thomas Sherwin Ave S Lehigh Acres, FL | 4.0 | 2.0 | 1493 | $2,200 | $1.47 | 3d | 1 | 1.07mi |
| 382 McArthur Blvd Lehigh Acres, FL | 3.0 | 2.0 | 1055 | $2,200 | $2.09 | 23d | 1 | 1.08mi |
| 20190 Caroline Creek Pl Unit 250 Lehigh Acres, FL | 3.0 | 2.0 | 1448 | $1,900 | $1.31 | 3d | 1 | 1.12mi |
| 20190 Caroline Creek Pl Unit 250 Lehigh Acres, FL | 3.0 | 2.0 | 1448 | $2,200 | $1.52 | 23d | 1 | 1.12mi |
| 217 Jayview Ave Lehigh Acres, FL | 3.0 | 2.0 | 1491 | $1,600 | $1.07 | 14d | 1 | 1.14mi |
Listing history 15 events
-
2026-06-17days on market $294,000 Active 58 DOM
-
2026-06-16days on market $294,000 Active 57 DOM
-
2026-06-15days on market $294,000 Active 56 DOM
-
2026-06-13days on market $294,000 Active 54 DOM
-
2026-06-10days on market $294,000 Active 51 DOM
-
2026-06-09days on market $294,000 Active 50 DOM
-
2026-06-07days on market $294,000 Active 48 DOM
-
2026-06-03days on market $294,000 Active 44 DOM
-
2026-06-02pricedays on market $294,000 Active 43 DOM
-
2026-06-01days on market $299,000 Active 42 DOM
-
2026-05-31days on market $299,000 Active 41 DOM
-
2026-05-19price $299,000
-
2026-05-07price $304,000
-
2026-04-20$309,000 Active
-
2025-04-03soldstatus $22,000
ⓘ Source: listings_history table (triggers on properties + properties_extension) + one-shot
backfill from property_details.listing_events for pre-trigger history.
Nearby sold comps map
Loading sold comps map…
Walkable amenities ~0.75 mi
Loading nearby amenities…
Taxation est. · year 1
- Rental income
- $25,474
- − Mortgage interest
- −$16,469
- − Property taxes
- −$4,410
- − Insurance
- −$1,470
- − Repairs & maintenance
- −$2,038
- − Management
- −$2,038
- − Depreciation
- −$8,553
- Taxable loss
- −$9,503
- Est. tax savings @ 24.0%
- +$2,281
- After-tax cash flow
- $-1,976/yr
For passive investors: Depreciation is non-cash, so a rental often shows a tax loss while cash-flowing — sheltering income. Rental losses are passive: they offset passive income freely, and up to $25,000/yr can offset ordinary (W-2) income if you actively participate and your MAGI is under $100k (phasing out to $0 by $150k); unused losses carry forward. On sale, claimed depreciation is recaptured at up to 25%, and gains may owe capital-gains tax (a 1031 exchange can defer both). Figures are a year-1 estimate at your 24.0% rate — not tax advice; consult a CPA.
Schools (NCES district)
- District
- Lee
- NCES district ID
- 1201080
- Math proficiency
- 47% ▼ -11.00%
- Reading proficiency
- 50% ▼ -4.00%
- Median HH income
- $49,518
- Composite
- 41.49/100
- National rank
- #3458
- State rank
- #42 of 73 in FL
Livability — Lehigh Acres
- Score
- 59/100
- State rank
- #826
- US rank
- #20055
Category grades
Schools grade is shown separately in the Schools card above.
Census & demographics
- Census place
- Lehigh Acres, FL
- County
- Lee County · 788,662 people
- City population
- 130,638
- Metro
- Cape Coral-Fort Myers, FL
- Population (ZIP)
- 19,927
- Household income
- $72,192
- Rent vs Own
- Severe rent burden
- 434.0
Population outlook (Lee County) Hauer SSP2
- Today (2025)
- 871,946 people
- By 2030
- 955,468 · +9.6%
- By 2040
- 1,113,587 · +27.7%
- By 2050
- 1,256,891 · +44.1%
- By 2075
- 1,560,270 · +78.9%
- By 2100
- 1,726,848 · +98.0%
Race, ethnicity, and origin ACS 2023
- Neighborhood character
- Diverse neighborhood (Simpson 0.64)
- Race & ethnicity
- Hispanic / Latino 52% Two or more races 31% White 26% Black 18%
- Hispanic origin (detail)
- Mexican 12% Puerto Rican 7% Cuban 20% Dominican 4%
- Common ancestry
- Hispanic 7% Italian 1% Portuguese 1%
- Foreign-born
- 32% · Canada, Jamaica
- Languages at home
- 48% English-only · Spanish 43% French/Haitian/Cajun 7% Other Indo-European 1%
Political lean MEDSL · Lee
- 2024 margin
- Strong R (+28.4) · D 35.5% · R 63.9%
- 2008→2024 swing
- -18.0pp toward R · 2008: -10.4pp · 2024: -28.4pp
- All cycles
- 2024: R+28.4 2020: R+19.2 2016: R+20.4 2012: R+16.6 2008: R+10.4
Not yet ingested
- Civics
- —
Market trends
- HPI YoY
- ▲ 16.53%
- Current HPI
- 303.3399
- Rent YoY
- ▼ -4.68%
- Metro
- Cape Coral-Fort Myers, FL
- State GDP YoY
- ▲ 3.28%
- F500 in state
- 36
Industry mix (Fortune 500 HQ in FL)
| Industry | F500 HQs | Revenue |
|---|---|---|
| Industrial Technology | 2 | $29B |
|
||
| Insurance | 2 | $17B |
|
||
| Retail | 1 | $60B |
|
||
| Technology Distribution | 1 | $58B |
|
||
| Homebuilding | 1 | $35B |
|
||
| Technology Manufacturing | 1 | $35B |
|
||
Price history
+1259.1% since first listed4 events — show timeline
- 2026-05-19 Price Changed $299,000 NAPLESMLS
- 2026-05-07 Price Changed $304,000 NAPLESMLS
- 2026-04-20 Listed $309,000 NAPLESMLS
- 2025-04-03 Sold (Public Records) $22,000 Public Records
Cash-flow waterfall
monthlySold comps — $/sqft
last 12 mo · ≤1 miLoading sold comps…