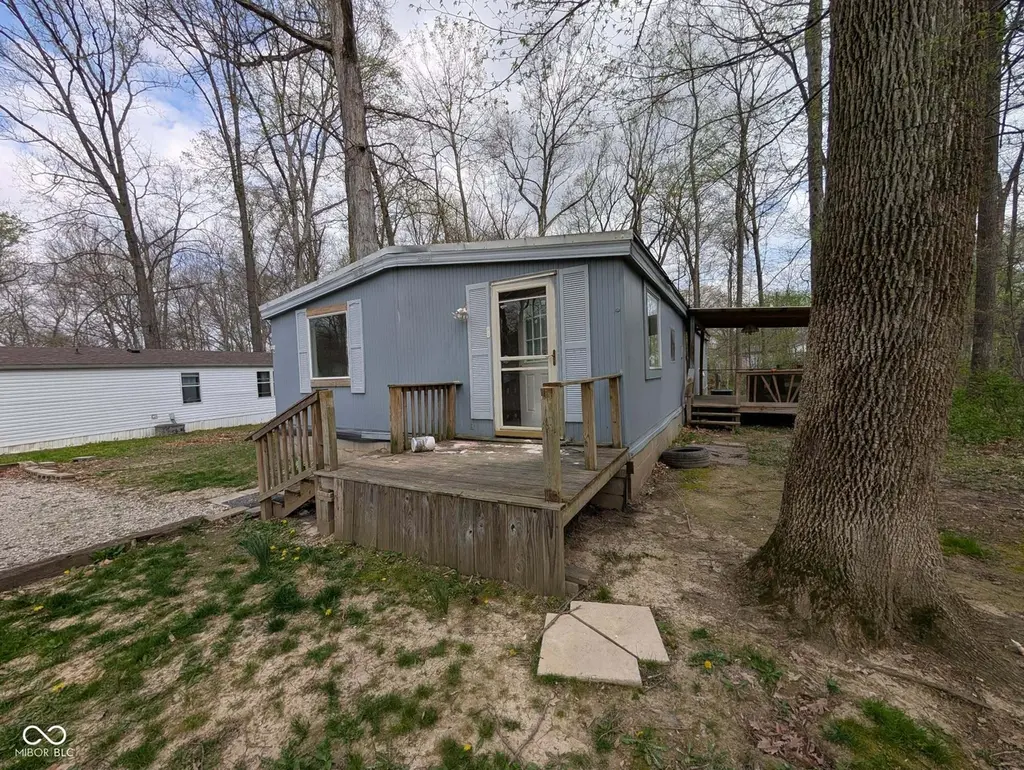
249 Ole Rocking Chair Way · Cloverdale, IN
Flood risk 1/10 · Minimal
- FEMA flood zone
- X (unshaded)
- Chance of flooding over 30 yrs
- 0.0%
- Est. flood insurance / yr
- $507 – $1,088
Fire risk 1/10 · Minimal
- Est. fire insurance / yr
- $717 – $1,331
Heat risk 3/10 · Minor
- Hot days now (above 103°F)
- 7 days/yr
- Hot days in 30 yrs
- 18 days/yr
Wind risk 2/10 · Minimal
- Chance of severe wind over 30 yrs
- 1.0%
Air-quality risk 3/10 · Minor
- Unhealthy air days now
- 2 days/yr
- Unhealthy air days in 30 yrs
- 3 days/yr
Risk factors via First Street. Map © Google.
Why this score? — see what drove the B grade
The composite is a weighted blend of 9 inputs, each scored 0–100. Each bar is that input's sub-score; the figure is the points it added to the 100-point composite (weight × sub-score).
- Cash flow +30.0/30.0
- 1% rule +10.0/10.0
- DSCR +10.0/10.0
- ARV discount +7.5/15.0
- Appreciation +4.4/10.0
- Livability +3.5/5.0
- Schools +3.2/10.0
- Rent growth +2.5/5.0
- Condition / age +2.5/5.0
$51,999
🖨 Deal sheet 📄 Offer letter ✓ Due diligence
Listing remarks MLS
Opportunity is knocking ??? Bring your tools and vision—this one has all the potential to become something truly special. Featuring two HUGE bedrooms, two full bathrooms, plus a bonus room perfect for added living space, an office, or flex use. Whether you're looking to expand your investment portfolio or step into expanding your rentals, this property checks the boxes. Located in Stardust Hills, where homeowners enjoy FIVE stocked ponds ??, a pool ??, clubhouse, and park—it’s more than a home, it’s a lifestyle. And you’re just minutes from local favorites like Lou’s Diner and C Bar C! ?? Ready to see the potential in person? Reach out today to schedule your private showing!
Key facts
- Clubhouse
- Bonus room
- Pool
Tags
Neighborhood map
What this means for you Summary
Snapshot
- This is a 2-bed/2.0-bath manufactured listed at $52k.
Deal economics
- At list price, monthly cash flow is $450 ($5k/yr) — positive.
- The deal already cash-flows at list — no discount required.
- Meets the 1% rule at list price ($1k rent vs $52k).
- Recommended offer: $50k (3.0% below list) — sets the bar for market timing.
- Cap rate 16.7% vs local median 3.5% in Cloverdale — top-decile yield for the area; either an underpriced asset or a hidden risk that comps aren't pricing in. Stress-test before assuming the spread holds.
Location & tenants
- Location reads 70/100 on livability (#156 in IN) — a middle-class / working-renter tenant base. Strengths: crime A+, cost of living A+, housing A+; Watch: schools C-, amenities F, commute F.
- Cloverdale Community Schools (rural): math 36% / reading 40% proficiency, ranked #167 of 301 in IN (top 56%) — families likely to look elsewhere, expect single-tenant / working-renter base with shorter leases.
- Market conditions: 65 active listings in the ZIP; 166 units permitted in Putnam County in 2024 (0 in 5+ unit buildings).
Forward outlook
- Local home prices are declining (-1.2%/yr); year-one equity from $359 of loan paydown is wiped out by about $633 of value loss. Plan a longer hold.
- Putnam County population projected to shrink 8% by 2050 — rents likely to lag national; underwrite the cash flow, not the appreciation.
- At projected returns (-1.2% appreciation + 3.0% rent growth), your $15k cash investment doubles in ~3 years — after that, you're playing with house money.
Negotiation context
- It's been on market 59 days — a 3% lower offer ($50k) is reasonable based on typical stale-listing flexibility.
- 2 sale attempts with the ask held roughly flat each time — persistent listings suggest the price (not the market) is what's stuck; bring a comps-based counter.
Risks & watch-outs
- Watch-outs: property tax is 2.9% of price.
Questions for the listing agent
- It's been on market 59 days. Have you received any prior offers? Is the seller open to a 3% concession, seller financing, or rate buy-down credit?
- Built in 1971 — when were the roof, HVAC, electrical panel, plumbing, and water heater last replaced?
- Property tax is high relative to price — has the assessment been appealed recently, and will the sale trigger a re-assessment?
- Is there a deadline driving the sale (1031 exchange, divorce, estate, relocation)? That informs how much negotiation room exists.
- What's the average days-on-market for RENTAL listings here right now (not sales)? A rising rental-DOM trend means longer vacancies and softer asking-rent achievability than the comps imply.
- What's the recent tenant-quality profile in this submarket — average credit score on applications, eviction rate, late-payment / NSF rate, and stable-employment percentage? A property-management company in the area should have these aggregated.
- How much new for-sale + rental construction is in the pipeline within 1–3 miles? Heavy new supply typically softens prices + rents 12–24 months out; constrained supply supports both.
Investment metrics
- 1% rule
- 2.11% ✓
- Cap rate
- 16.68%
- Cash-on-cash
- 37.08%
- DSCR
- 2.65
- GRM
- 3.9
CMA / ARV
- ARV (median comp)
- $141,626
- List price
- $51,999
- Delta
- -63.28%
- Verdict
- UNDERPRICED
- Comps
- 12 within 1.0 mi
Show comp detail 12 sales within ~0.75 mi
| Address | Dist | Beds/Ba | Sqft | Sold | Price | $/sf | Match |
|---|---|---|---|---|---|---|---|
| 94 Small Fry Ave | 0.29mi | 2/2.0 | 1,216 (-10%) | 4mo | $125,000 | $103 | 67 |
| 157 Lazy River Rd | 0.39mi | 2/2.0 | 1,216 (-10%) | 0mo | $130,000 | $107 | 66 |
| 180 Lazy River Ct | 0.50mi | 3/2.0 (+1) | 1,404 (+4%) | 3mo | $80,000 | $57 | 62 |
| 384 Cool Evening Ct | 0.36mi | 3/2.0 (+1) | 1,232 (-8%) | 6mo | $92,000 | $75 | 59 |
| 289 Bubble Loo Rd | 0.19mi | 3/2.0 (+1) | 1,216 (-10%) | 14mo | $157,000 | $129 | 59 |
| 334 Small Fry Ave | 0.27mi | 3/2.0 (+1) | 1,188 (-12%) | 6mo | $172,900 | $146 | 58 |
| 608 Pumpkin Pl | 0.47mi | 3/2.0 (+1) | 1,404 (+4%) | 9mo | $185,000 | $132 | 58 |
| 443 Stardust Way | 0.48mi | 3/2.0 (+1) | 1,323 (-2%) | 15mo | $150,000 | $113 | 58 |
| 125 Oriole Ct | 0.35mi | 3/1.0 (+1) | 1,216 (-10%) | 2mo | $142,900 | $118 | 58 |
| 623 Shooting Star Way | 0.60mi | 3/2.0 (+1) | 1,431 (+6%) | 0mo | $187,000 | $131 | 56 |
| 597 Lazy River Rd | 0.42mi | 3/2.0 (+1) | 1,188 (-12%) | 9mo | $165,000 | $139 | 49 |
| 179 Lazy River Ct | 0.49mi | 2/1.5 | 1,152 (-14%) | 11mo | $139,900 | $121 | 42 |
Match score weights: distance 35% · size 25% · config 20% · recency 20%. Top-matched comps best support the ARV.
Projected returns pro-forma
-1.22% appreciation · 3.0% rent growth · sell at horizon
- IRR
- 36.0%
- Equity multiple
- 2.67×
- Total profit
- $24,284
- Equity at exit
- $12,010
- IRR
- 40.7%
- Equity multiple
- 5.26×
- Total profit
- $61,975
- Equity at exit
- $12,155
Cash invested: $14,560 (down + closing). Projections, not guarantees.
Landlord ↔ Tenant lean methodology
- Overall (STATE)
- 90 Strongly Landlord-Friendly
- State Indiana
- 90 Strongly Landlord-Friendly · R+11
- County
- — inherits STATE
- City
- — inherits STATE
ZIP-level market 46120
- Home prices YoY
- -0.5%
- Active inventory
- 65
- Price-to-rent
- 3.9×
Monthly cashflow live
- Estimated rent
- $1,099 medium interval (Pro) →
- Mortgage (P&I)
- −$273
- Tax from tax record
- −$124 /mo · $1,490/yr
- Insurance
- −$22
- HOA
- −$0
- Vacancy / Maint / Mgmt
- −$231
- Net cashflow
- $450
Break-even live
UW: 25.0% down · 7.5% · 30yr · 1.5% tax · 5.0% vac · 8.0% maint · 8.0% mgmt
Financing live
Cash to close
- Down payment
- $13,000
- Closing costs
- $1,560
- Reserves months
- —
- Total cash needed
- —
Loan-product check · same deal, 3 products live
Conventional
25% down · 7.5% · 30yr
- Down + closing
- —
- Monthly P&I
- —
- Monthly cashflow
- —
- DSCR
- —
- Eligible?
- —
Personal DTI + credit; lowest rate.
DSCR
20% down · 8.5% · 30yr
- Down + closing
- —
- Monthly P&I
- —
- Monthly cashflow
- —
- DSCR
- —
- Eligible?
- —
No personal income docs; deal must DSCR.
Hard money
10% down · 12.0% · 12mo
- Down + closing
- —
- Monthly P&I
- —
- Monthly cashflow
- —
- DSCR
- —
- Eligible?
- —
Short-term bridge; refi at stabilization.
Listing history 14 events
-
2026-06-18days on market $51,999 Active 59 DOM
-
2026-06-17days on market $51,999 Active 58 DOM
-
2026-06-16days on market $51,999 Active 57 DOM
-
2026-06-15days on market $51,999 Active 56 DOM
-
2026-06-13days on market $51,999 Active 54 DOM
-
2026-06-09days on market $51,999 Active 50 DOM
-
2026-06-08days on market $51,999 Active 49 DOM
-
2026-06-07days on market $51,999 Active 48 DOM
-
2026-06-03days on market $51,999 Active 44 DOM
-
2026-06-02days on market $51,999 Active 43 DOM
-
2026-06-01days on market $51,999 Active 42 DOM
-
2026-05-31days on market $51,999 Active 41 DOM
-
2026-04-17$51,999 Active 719-char remark
Show marketing remark (719 chars)
Opportunity is knocking ??? Bring your tools and vision—this one has all the potential to become something truly special. Featuring two HUGE bedrooms, two full bathrooms, plus a bonus room perfect for added living space, an office, or flex use. Whether you're looking to expand your investment portfolio or step into expanding your rentals, this property checks the boxes. Located in Stardust Hills, where homeowners enjoy FIVE stocked ponds ??, a pool ??, clubhouse, and park—it’s more than a home, it’s a lifestyle. And you’re just minutes from local favorites like Lou’s Diner and C Bar C! ?? Ready to see the potential in person? Reach out today to schedule your private showing!
-
2026-04-16$51,999 Active 683-char remark
Show marketing remark (683 chars)
Opportunity is knocking ??? Bring your tools and vision-this one has all the potential to become something truly special. Featuring two HUGE bedrooms, two full bathrooms, plus a bonus room perfect for added living space, an office, or flex use. Whether you're looking to expand your investment portfolio or step into expanding your rentals, this property checks the boxes. Located in Stardust Hills, where homeowners enjoy FIVE stocked ponds ??, a pool ??, clubhouse, and park-it's more than a home, it's a lifestyle. And you're just minutes from local favorites like Lou's Diner and C Bar C! ?? Ready to see the potential in person? Reach out today to schedule your private showing!
ⓘ Source: listings_history table (triggers on properties + properties_extension) + one-shot
backfill from property_details.listing_events for pre-trigger history.
Tax reassessment forecast IN · Partial reset (capped growth)
- Current annual tax
- $1,490 · $124/mo
- Projected year-2 tax
- $1,490 · $124/mo
- Expected delta
- $0/yr ($0/mo · 0.0%)
ⓘ Screening estimate from a state-policy table — verify with the county assessor before closing.
Climate risk First Street
- Flood 1/10 Low FEMA zone X (unshaded) · 0% chance over 30 yrs
- Wildfire 1/10 Low
- Heat 3/10 Moderate 7 d/yr ≥103°F today · 18 d/yr by 30 yrs out
- Wind 2/10 Low 100% chance of damaging wind over 30 yrs
- Air quality 3/10 Moderate 2 unhealthy d/yr today · 3 by 30 yrs out
Nearby sold comps map
Loading sold comps map…
Walkable amenities ~0.75 mi
Loading nearby amenities…
Taxation est. · year 1
- Rental income
- $13,192
- − Mortgage interest
- −$2,913
- − Property taxes
- −$1,490
- − Insurance
- −$260
- − Repairs & maintenance
- −$1,055
- − Management
- −$1,055
- − Depreciation
- −$1,513
- Taxable income
- $4,906
- Est. tax owed @ 24.0%
- −$1,177
- After-tax cash flow
- $4,222/yr
For passive investors: Depreciation is non-cash, so a rental often shows a tax loss while cash-flowing — sheltering income. Rental losses are passive: they offset passive income freely, and up to $25,000/yr can offset ordinary (W-2) income if you actively participate and your MAGI is under $100k (phasing out to $0 by $150k); unused losses carry forward. On sale, claimed depreciation is recaptured at up to 25%, and gains may owe capital-gains tax (a 1031 exchange can defer both). Figures are a year-1 estimate at your 24.0% rate — not tax advice; consult a CPA.
Schools (NCES district)
- District
- Cloverdale Community Schools
- NCES district ID
- 1802220
- Math proficiency
- 36% ▼ -16.00%
- Reading proficiency
- 40% ▼ -14.00%
- Median HH income
- $44,267
- Composite
- 32.28/100
- National rank
- #5753
- State rank
- #167 of 301 in IN
Livability — Cloverdale
- Score
- 70/100
- State rank
- #156
- US rank
- #7715
Category grades
Schools grade is shown separately in the Schools card above.
Census & demographics
- Census place
- Cloverdale, IN
- City population
- 6,138
- Population (ZIP)
- 6,138
Population outlook (Putnam County) Hauer SSP2
- Today (2025)
- 37,226 people
- By 2030
- 36,723 · -1.4%
- By 2040
- 35,407 · -4.9%
- By 2050
- 34,177 · -8.2%
- By 2075
- 32,038 · -13.9%
- By 2100
- 28,380 · -23.8%
Race, ethnicity, and origin ACS 2023
- Neighborhood character
- Predominantly White (97%)
- Race & ethnicity
- White 97% Two or more races 1% Black 1%
- Common ancestry
- Slovak 3% Lithuanian 2% Iranian 2%
- Foreign-born
- 1%
- Languages at home
- 99% English-only · Spanish 1%
Political lean MEDSL · Putnam
- 2024 margin
- Solid R (+52.0) · D 23.1% · R 75.1% · Other 1.8%
- 2008→2024 swing
- -40.0pp toward R · 2008: -12.0pp · 2024: -52.0pp
- All cycles
- 2024: R+52.0 2020: R+50.2 2016: R+49.6 2012: R+32.6 2008: R+12.0
Not yet ingested
- Civics
- —
Market trends
- HPI YoY
- ▼ -1.22%
- Current HPI
- 235.6828
- Rent YoY
- —
- Metro
- —
- State GDP YoY
- ▲ 2.90%
- F500 in state
- 18
Industry mix (Fortune 500 HQ in IN)
| Industry | F500 HQs | Revenue |
|---|---|---|
| Industrial Machinery | 2 | $37B |
|
||
| Healthcare | 1 | $177B |
|
||
| Pharmaceuticals | 1 | $45B |
|
||
| Metals / Steel | 1 | $18B |
|
||
| Agriculture | 1 | $17B |
|
||
| Packaging | 1 | $12B |
|
||
Price history
+0.0% since first listed2 events — show timeline
- 2026-04-17 Listed $51,999 THAAR
- 2026-04-16 Listed $51,999 MIBOR as Distributed by MLS Grid
Property tax history
+10.5%/yrLatest (2024): $1,490 · +217.1% YoY. Source: county tax records.
Cash-flow waterfall
monthlySold comps — $/sqft
last 12 mo · ≤1 miLoading sold comps…