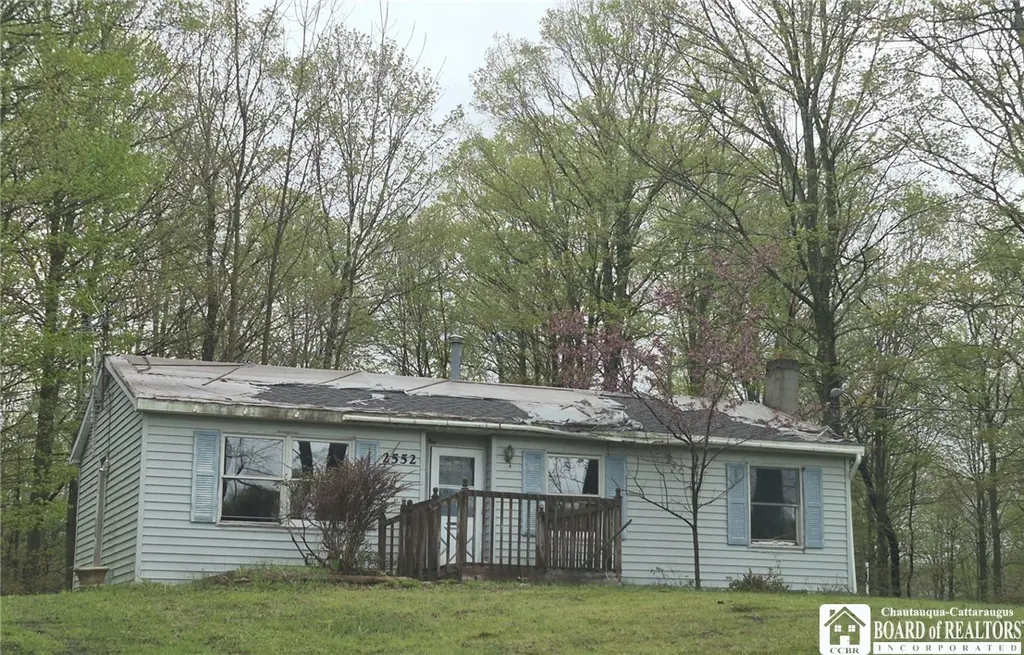
2552 Thornton Rd · Sinclairville, NY
Flood risk 1/10 · Minimal
- FEMA flood zone
- X
- Chance of flooding over 30 yrs
- 0.0%
- Est. flood insurance / yr
- $473 – $860
Fire risk 1/10 · Minimal
- Est. fire insurance / yr
- $691 – $1,283
Heat risk 1/10 · Minimal
- Hot days now (above 89°F)
- 7 days/yr
- Hot days in 30 yrs
- 16 days/yr
Wind risk 1/10 · Minimal
- Chance of severe wind over 30 yrs
- —
Air-quality risk 2/10 · Minimal
- Unhealthy air days now
- 1 days/yr
- Unhealthy air days in 30 yrs
- 2 days/yr
Risk factors via First Street. Map © Google.
Why this score? — see what drove the B+ grade
The composite is a weighted blend of 9 inputs, each scored 0–100. Each bar is that input's sub-score; the figure is the points it added to the 100-point composite (weight × sub-score).
- Cash flow +30.0/30.0
- 1% rule +10.0/10.0
- DSCR +10.0/10.0
- ARV discount +7.5/15.0
- Appreciation +7.3/10.0
- Schools +4.3/10.0
- Livability +2.9/5.0
- Rent growth +2.5/5.0
- Condition / age +2.5/5.0
$69,900
🖨 Deal sheet 📄 Offer letter ✓ Due diligence
Listing remarks MLS
VERY NICE COUNTRY HOME that is IN MOVE CONDITION and is much more spacious than it appears from the outside. Located in a beautiful treed setting, with a basketball court and new 10 X 12 shed this 12 year old stick build ranch features; 4 bed rooms, 2 full baths, living room, dinning room, kitchen, and a family room in the finished basement area!!!! THIS IS A MUST SEE!!!!
Key facts
- Large bay windows
- L-shaped kitchen
- Rolling acreage
Tags
Property features AI
Exterior
- Parking: No garage
- Utilities: Septic tank; Well water; Propane service
- Home design: Single-story home; Frame construction; Resale fixer property
- Construction: Block foundation; Existing construction (year built: existing)
- Exterior features: Deck; Gravel driveway; Shed(s) and storage; Wooded lot; Rectangular lot
Interior
- Kitchen: Solid surface counters
- Bedrooms: Three main-level bedrooms
- Flooring: Hardwood; Varies
- Bathrooms: Two full bathrooms; One main-level bathroom
- Heating & cooling: Propane heating
- Interior features: Separate formal dining room; Separate formal living room; Solid surface counters; Storage; Convertible bedroom; Main-level primary bedroom; Partially finished basement; Bonus room; Recreation room; Other (see remarks)
- Laundry & utility: Laundry in basement; Propane water heater
Neighborhood map
What this means for you Summary
Snapshot
- This is a 4-bed/2.0-bath single-family listed at $70k.
Deal economics
- At list price, monthly cash flow is $428 ($5k/yr) — positive.
- The deal already cash-flows at list — no discount required.
- Meets the 1% rule at list price ($1k rent vs $70k).
- Recommended offer: $68k (3.0% below list) — sets the bar for market timing.
Location & tenants
- Location reads 58/100 on livability (#1,062 in NY) — a working-class tenant base; expect higher turnover. Strengths: cost of living A+, housing A+; Watch: schools D+, crime F, amenities F.
- Cassadaga Valley Central School District (rural): math 41% / reading 61% proficiency, ranked #372 of 590 in NY (top 63%) — acceptable for families but not a draw, mixed tenant base, ~2y average lease.
- Market conditions: 18 active listings in the ZIP; 127 units permitted in Chautauqua County in 2024 (0 in 5+ unit buildings).
Forward outlook
- In year one you build about $4k of equity ($483 loan paydown + $3k appreciation (4.6% local appreciation)).
- Chautauqua County population projected at -22% by 2050 — secular population decline; favor cash flow + early exit over multi-decade hold.
- At projected returns (4.6% appreciation + 3.0% rent growth), your $20k cash investment doubles in ~3 years — after that, you're playing with house money.
- By year 9, paydown + projected appreciation supports a ~$32k cash-out refi (75% LTV) — recoverable capital for the next deal without selling this one.
Negotiation context
- It's been on market 49 days — a 3% lower offer ($68k) is reasonable based on typical stale-listing flexibility.
- 4 sale attempts since 24y ago; this cycle's ask has dropped $10k (13%) from the opening price — seller is motivated, your offer sets the floor, not the list.
Risks & watch-outs
- Watch-outs: property tax is 4.5% of price.
Questions for the listing agent
- It's been on market 49 days. Have you received any prior offers? Is the seller open to a 3% concession, seller financing, or rate buy-down credit?
- Property tax is high relative to price — has the assessment been appealed recently, and will the sale trigger a re-assessment?
- Is there a deadline driving the sale (1031 exchange, divorce, estate, relocation)? That informs how much negotiation room exists.
- Schools are D-rated, which usually means shorter tenancies and higher turnover. Who's the typical renter profile here, and what's been the actual vacancy rate?
- Crime grade is F in this area — have there been break-ins, vandalism, or insurance claims at this property in the last 3 years? What carrier currently insures it and at what premium?
- What's the average days-on-market for RENTAL listings here right now (not sales)? A rising rental-DOM trend means longer vacancies and softer asking-rent achievability than the comps imply.
- What's the recent tenant-quality profile in this submarket — average credit score on applications, eviction rate, late-payment / NSF rate, and stable-employment percentage? A property-management company in the area should have these aggregated.
- How much new for-sale + rental construction is in the pipeline within 1–3 miles? Heavy new supply typically softens prices + rents 12–24 months out; constrained supply supports both.
Investment metrics
- 1% rule
- 1.96% ✓
- Cap rate
- 13.64%
- Cash-on-cash
- 26.26%
- DSCR
- 2.17
- GRM
- 4.2
CMA / ARV
- ARV (median comp)
- $269,453
- List price
- $69,900
- Delta
- -74.06%
- Verdict
- UNDERPRICED
- Comps
- 5 within 2.0 mi
Projected returns pro-forma
4.6% appreciation · 3.0% rent growth · sell at horizon
- IRR
- 35.2%
- Equity multiple
- 3.14×
- Total profit
- $41,940
- Equity at exit
- $37,938
- IRR
- 33.9%
- Equity multiple
- 6.33×
- Total profit
- $104,236
- Equity at exit
- $64,131
Cash invested: $19,572 (down + closing). Projections, not guarantees.
Landlord ↔ Tenant lean methodology
- Overall (STATE)
- 15 Strongly Tenant-Friendly
- State New York
- 15 Strongly Tenant-Friendly · D+10
- County
- — inherits STATE
- City
- — inherits STATE
ZIP-level market 14782
- Home prices YoY
- 1.2%
- Active inventory
- 18
- Price-to-rent
- 4.2×
Monthly cashflow live
- Estimated rent
- $1,371 medium interval (Pro) →
- Mortgage (P&I)
- −$367
- Tax from tax record
- −$259 /mo · $3,112/yr
- Insurance
- −$29
- HOA
- −$0
- Vacancy / Maint / Mgmt
- −$288
- Net cashflow
- $428
Break-even live
UW: 25.0% down · 7.5% · 30yr · 1.5% tax · 5.0% vac · 8.0% maint · 8.0% mgmt
Financing live
Cash to close
- Down payment
- $17,475
- Closing costs
- $2,097
- Reserves months
- —
- Total cash needed
- —
Loan-product check · same deal, 3 products live
Conventional
25% down · 7.5% · 30yr
- Down + closing
- —
- Monthly P&I
- —
- Monthly cashflow
- —
- DSCR
- —
- Eligible?
- —
Personal DTI + credit; lowest rate.
DSCR
20% down · 8.5% · 30yr
- Down + closing
- —
- Monthly P&I
- —
- Monthly cashflow
- —
- DSCR
- —
- Eligible?
- —
No personal income docs; deal must DSCR.
Hard money
10% down · 12.0% · 12mo
- Down + closing
- —
- Monthly P&I
- —
- Monthly cashflow
- —
- DSCR
- —
- Eligible?
- —
Short-term bridge; refi at stabilization.
Listing history 22 events
-
2026-06-19days on market $69,900 Active 49 DOM
-
2026-06-18days on market $69,900 Active 48 DOM
-
2026-06-17days on market $69,900 Active 47 DOM
-
2026-06-16days on market $69,900 Active 46 DOM
-
2026-06-15days on market $69,900 Active 45 DOM
-
2026-06-14days on market $69,900 Active 43 DOM
-
2026-06-12pricedays on market $69,900 Active 42 DOM
-
2026-06-09days on market $79,900 Active 39 DOM
-
2026-06-08days on market $79,900 Active 38 DOM
-
2026-06-07days on market $79,900 Active 37 DOM
-
2026-06-03days on market $79,900 Active 33 DOM
-
2026-06-02days on market $79,900 Active 32 DOM
-
2026-06-01days on market $79,900 Active 31 DOM
-
2026-05-31days on market $79,900 Active 30 DOM
-
2026-05-30days on market $79,900 Active 29 DOM
-
2026-05-01$79,900 Active 1313-char remark
-
2009-09-18$77,000
-
2005-05-13soldstatus $79,900
-
2005-05-06soldstatus $79,900
Show marketing remark (375 chars)
VERY NICE COUNTRY HOME that is IN MOVE CONDITION and is much more spacious than it appears from the outside. Located in a beautiful treed setting, with a basketball court and new 10 X 12 shed this 12 year old stick build ranch features; 4 bed rooms, 2 full baths, living room, dinning room, kitchen, and a family room in the finished basement area!!!! THIS IS A MUST SEE!!!!
-
2004-06-01$79,900
Show marketing remark (375 chars)
VERY NICE COUNTRY HOME that is IN MOVE CONDITION and is much more spacious than it appears from the outside. Located in a beautiful treed setting, with a basketball court and new 10 X 12 shed this 12 year old stick build ranch features; 4 bed rooms, 2 full baths, living room, dinning room, kitchen, and a family room in the finished basement area!!!! THIS IS A MUST SEE!!!!
-
2002-03-23$79,900
-
1998-02-18soldstatus $52,000
ⓘ Source: listings_history table (triggers on properties + properties_extension) + one-shot
backfill from property_details.listing_events for pre-trigger history.
Tax reassessment forecast NY · Partial reset (capped growth)
- Current annual tax
- $3,112 · $259/mo
- Projected year-2 tax
- $3,112 · $259/mo
- Expected delta
- $0/yr ($0/mo · 0.0%)
ⓘ Screening estimate from a state-policy table — verify with the county assessor before closing.
Climate risk First Street
- Flood 1/10 Low FEMA zone X · 0% chance over 30 yrs
- Wildfire 1/10 Low
- Heat 1/10 Low 7 d/yr ≥89°F today · 16 d/yr by 30 yrs out
- Wind 1/10 Low
- Air quality 2/10 Low 1 unhealthy d/yr today · 2 by 30 yrs out
Nearby sold comps map
Loading sold comps map…
Walkable amenities ~0.75 mi
Loading nearby amenities…
Taxation est. · year 1
- Rental income
- $16,455
- − Mortgage interest
- −$3,915
- − Property taxes
- −$3,112
- − Insurance
- −$350
- − Repairs & maintenance
- −$1,316
- − Management
- −$1,316
- − Depreciation
- −$2,033
- Taxable income
- $4,412
- Est. tax owed @ 24.0%
- −$1,059
- After-tax cash flow
- $4,080/yr
For passive investors: Depreciation is non-cash, so a rental often shows a tax loss while cash-flowing — sheltering income. Rental losses are passive: they offset passive income freely, and up to $25,000/yr can offset ordinary (W-2) income if you actively participate and your MAGI is under $100k (phasing out to $0 by $150k); unused losses carry forward. On sale, claimed depreciation is recaptured at up to 25%, and gains may owe capital-gains tax (a 1031 exchange can defer both). Figures are a year-1 estimate at your 24.0% rate — not tax advice; consult a CPA.
Schools (NCES district)
- District
- Cassadaga Valley Central School District
- NCES district ID
- 3606660
- Math proficiency
- 41% ▼ -3.00%
- Reading proficiency
- 61% ▲ 15.00%
- Median HH income
- $46,654
- Composite
- 43.22/100
- National rank
- #3059
- State rank
- #372 of 590 in NY
Livability — Sinclairville
- Score
- 58/100
- State rank
- #1062
- US rank
- #21176
Category grades
Schools grade is shown separately in the Schools card above.
Census & demographics
- City population
- 2,010
- Population (ZIP)
- 2,010
Population outlook (Chautauqua County) Hauer SSP2
- Today (2025)
- 123,454 people
- By 2030
- 118,509 · -4.0%
- By 2040
- 107,311 · -13.1%
- By 2050
- 96,703 · -21.7%
- By 2075
- 76,757 · -37.8%
- By 2100
- 60,984 · -50.6%
Race, ethnicity, and origin ACS 2023
- Neighborhood character
- Predominantly White (95%)
- Race & ethnicity
- White 95% Two or more races 3% Hispanic / Latino 2%
- Common ancestry
- Iranian 7% Italian 4% Lithuanian 3%
- Foreign-born
- 1%
- Languages at home
- 99% English-only · Spanish 1%
Political lean MEDSL · Chautauqua
- 2024 margin
- Strong R (+22.0) · D 39.0% · R 61.0%
- 2008→2024 swing
- -22.9pp toward R · 2008: 0.9pp · 2024: -22.0pp
- All cycles
- 2024: R+22.0 2020: R+19.8 2016: R+24.6 2012: R+8.2 2008: D+0.9
Not yet ingested
- Civics
- —
Market trends
- HPI YoY
- ▲ 4.60%
- Current HPI
- 383.2164
- Rent YoY
- —
- Metro
- —
- State GDP YoY
- ▲ 2.60%
- F500 in state
- 92
Industry mix (Fortune 500 HQ in NY)
| Industry | F500 HQs | Revenue |
|---|---|---|
| Financial Services | 10 | $950B |
|
||
| Consumer Goods | 9 | $162B |
|
||
| Insurance | 4 | $225B |
|
||
| Telecommunications | 2 | $144B |
|
||
| Pharmaceuticals | 2 | $112B |
|
||
| Media / Entertainment | 2 | $69B |
|
||
Price history
+34.4% since first listed8 events — show timeline
- 2026-06-10 Price Changed $69,900 UNYREIS
- 2026-05-01 Listed $79,900 UNYREIS
- 2009-09-18 Listed $77,000 UNYREIS
- 2005-05-13 Sold (Public Records) $79,900 Public Records
- 2005-05-06 Sold (MLS) $79,900 UNYREIS
- 2004-06-01 Listed $79,900 UNYREIS
- 2002-03-23 Listed $79,900 UNYREIS
- 1998-02-18 Sold (Public Records) $52,000 Public Records
Property tax history
-2.1%/yrLatest (2025): $3,112 · +2.6% YoY. Source: county tax records.
Cash-flow waterfall
monthlySold comps — $/sqft
last 12 mo · ≤1 miLoading sold comps…