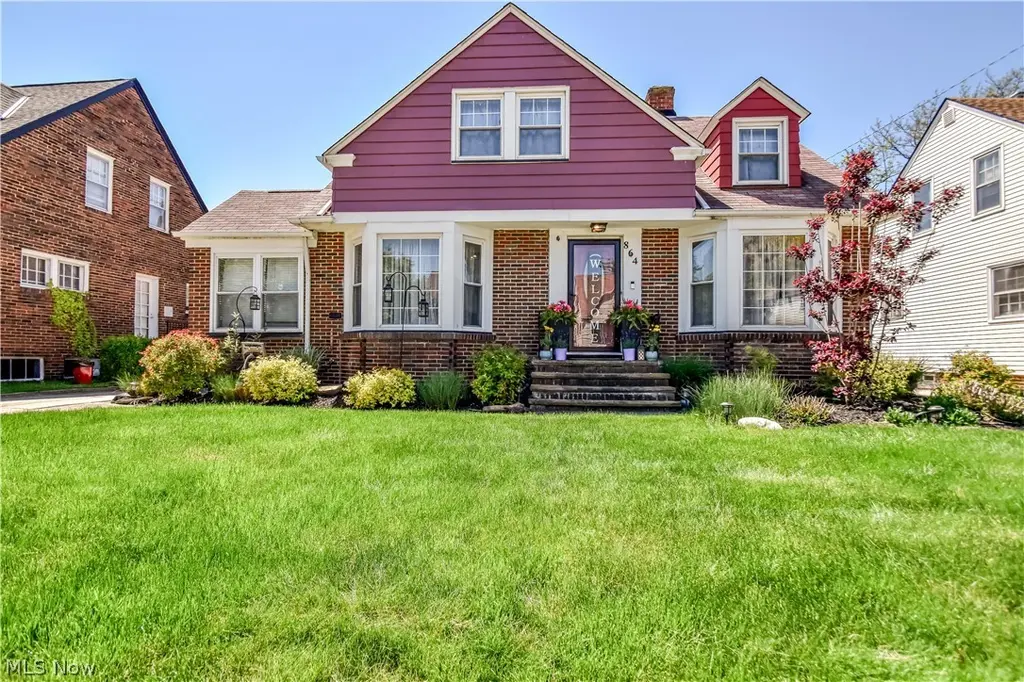
864 Medford Rd · Cleveland Heights, OH
Flood risk 1/10 · Minimal
- FEMA flood zone
- X (unshaded)
- Chance of flooding over 30 yrs
- 0.0%
- Est. flood insurance / yr
- $473 – $860
Fire risk 1/10 · Minimal
- Est. fire insurance / yr
- $713 – $1,323
Heat risk 3/10 · Minor
- Hot days now (above 95°F)
- 7 days/yr
- Hot days in 30 yrs
- 17 days/yr
Wind risk 1/10 · Minimal
- Chance of severe wind over 30 yrs
- —
Air-quality risk 3/10 · Minor
- Unhealthy air days now
- 3 days/yr
- Unhealthy air days in 30 yrs
- 5 days/yr
Risk factors via First Street. Map © Google.
Why this score? — see what drove the C grade
The composite is a weighted blend of 9 inputs, each scored 0–100. Each bar is that input's sub-score; the figure is the points it added to the 100-point composite (weight × sub-score).
- Cash flow +18.3/30.0
- ARV discount +15.0/15.0
- 1% rule +6.0/10.0
- DSCR +5.7/10.0
- Livability +4.5/5.0
- Rent growth +4.2/5.0
- Schools +2.8/10.0
- Condition / age +2.5/5.0
- Appreciation +0.0/10.0
$169,900
🖨 Deal sheet (PDF) 📄 Offer letter ✓ Due diligence
Listing remarks MLS
Multiple offers received, seller has requested highest and best due 3/28 by Noon Don't miss out on this great Cleveland Height cape cod! Large single family three bedroom brick home. Home has great potential. First floor consists of a full bath, family room/office and bedroom. Large all season room or side porch. Hardwood floors and replacement windows. Two bedrooms upstairs with full bathroom. Two car detached garage and fenced in back yard. Come take a look.
Key facts
- Bright sun porch
- Granite countertops
- Expansive basement
Tags
Property features AI
Exterior
- Parking: Detached garage and driveway; Two garage spaces
- Utilities: Public water supply; Public sewer
- Home design: Brick construction; Asphalt/fiberglass roof
- Construction: Brick exterior; Asphalt and fiberglass roof
- Exterior features: Public water; Public sewer
Interior
- Bedrooms: One main-level bedroom
- Bathrooms: Two full bathrooms; One main-level bathroom
- Heating & cooling: Central air conditioning; Forced air heating
- Interior features: Full unfinished basement; Updated/remodeled condition; One fireplace
Neighborhood map
What this means for you Summary
Snapshot
- This is a 3-bed/1.0-bath single-family listed at $170k.
Deal economics
- At list price, monthly cash flow is $154 ($2k/yr) — positive.
- The deal already cash-flows at list — no discount required.
- Meets the 1% rule at list price ($2k rent vs $170k).
- Cap rate 7.4% vs local median 4.3% in Cleveland Heights — top-decile yield for the area; either an underpriced asset or a hidden risk that comps aren't pricing in. Stress-test before assuming the spread holds.
Location & tenants
- Location reads 89/100 on livability (#12 in OH, #124 nationally) — a professional / high-income tenant draw. Strengths: amenities A+, commute A+, cost of living A+.
- Cleveland Heights-University Heights City (suburban): math 23% / reading 41% proficiency, ranked #568 of 656 in OH (top 87%) — families likely to look elsewhere, expect single-tenant / working-renter base with shorter leases; 64% free/reduced lunch — lower-income household profile, screen leases tightly.
- Zoned schools: Cleveland Heights High School (math 12% / reading 46%, grade F, #627 of 781 statewide, top 81%, 1,664 students, 0% FRL) — zoned schools average 0% FRL vs 64% district-wide (64 pts lower); this property's tenant base skews higher-income than the district average.
- Market conditions: Rents rising fast (+6.8%/yr); 150 active listings in the ZIP; 32 comparable units currently listed for rent nearby; rentals leasing fast (median 13d on market — plan ~1-2 weeks tenant-placement turnaround); solid renter incomes; 1,441 units permitted in Cuyahoga County in 2024 (700 in 5+ unit buildings).
Forward outlook
- Local home prices are declining (-3.0%/yr); year-one equity from $1k of loan paydown is wiped out by about $5k of value loss. Plan a longer hold.
- Cuyahoga County population projected to shrink 8% by 2050 — rents likely to lag national; underwrite the cash flow, not the appreciation.
- At projected returns (-3.0% appreciation + 6.8% rent growth), your $48k cash investment doubles in ~10 years — after that, you're playing with house money.
Negotiation context
- Only 14 days on market — expect competitive offers; lowballing is unlikely to land.
- 2 sale attempts since 7y ago with the ask held roughly flat each time — persistent listings suggest the price (not the market) is what's stuck; bring a comps-based counter.
- Current owner paid $45k; list at $170k implies a 278% gain — meaningful room to come down on a strong offer.
Risks & watch-outs
- Watch-outs: built in 1941 — expect roof / HVAC / electrical / plumbing capex.
Questions for the listing agent
- Built in 1941 — when were the roof, HVAC, electrical panel, plumbing, and water heater last replaced?
- Is there a deadline driving the sale (1031 exchange, divorce, estate, relocation)? That informs how much negotiation room exists.
- Schools are A-rated — typically a magnet for longer-tenancy family renters. What's the average tenant stay here, and is there a school-zone premium baked into asking?
- What's the average days-on-market for RENTAL listings here right now (not sales)? A rising rental-DOM trend means longer vacancies and softer asking-rent achievability than the comps imply.
- What's the recent tenant-quality profile in this submarket — average credit score on applications, eviction rate, late-payment / NSF rate, and stable-employment percentage? A property-management company in the area should have these aggregated.
- How much new for-sale + rental construction is in the pipeline within 1–3 miles? Heavy new supply typically softens prices + rents 12–24 months out; constrained supply supports both.
Investment metrics
- 1% rule
- 1.10% ✓
- Cap rate
- 7.38%
- Cash-on-cash
- 3.89%
- DSCR
- 1.17
- GRM
- 7.6
CMA / ARV
- ARV (on-the-fly)
- $224,352
- Comps found
- 12
Show comp detail 12 sales within ~0.75 mi
| Address | Dist | Beds/Ba | Sqft | Sold | Price | $/sf | Match |
|---|---|---|---|---|---|---|---|
| 693 Quilliams Rd | 0.43mi | 3/1.5 | 1,856 (+2%) | 1mo | $220,000 | $119 | 75 |
| 1068 Elbon Rd | 0.41mi | 4/1.5 (+1) | 1,883 (+3%) | 3mo | $217,000 | $115 | 66 |
| 1031 Pennfield Rd | 0.42mi | 4/1.5 (+1) | 1,727 (-5%) | 1mo | $212,000 | $123 | 64 |
| 1143 Brentwood Rd | 0.58mi | 3/1.5 | 1,741 (-5%) | 0mo | $215,000 | $123 | 63 |
| 4019 Princeton Blvd | 0.69mi | 3/1.5 | 1,746 (-4%) | 1mo | $215,000 | $123 | 58 |
| 979 Oxford Rd | 0.48mi | 4/2.0 (+1) | 1,640 (-10%) | 1mo | $178,000 | $109 | 51 |
| 952 Oxford Rd | 0.43mi | 4/2.0 (+1) | 1,560 (-14%) | 2mo | $180,000 | $115 | 46 |
| 917 Brunswick Rd | 0.71mi | 4/3.0 (+1) | 1,890 (+4%) | 3mo | $260,000 | $138 | 45 |
| 3454 Monticello Blvd | 0.67mi | 3/2.5 | 1,572 (-14%) | 1mo | $210,000 | $134 | 39 |
| 2145 N Taylor Rd | 0.69mi | 3/2.5 | 1,579 (-13%) | 1mo | $272,900 | $173 | 38 |
| 1168 Brentwood Rd | 0.61mi | 4/2.5 (+1) | 1,559 (-14%) | 1mo | $264,400 | $170 | 35 |
| 1012 Helmsdale Rd | 0.58mi | 4/2.5 (+1) | 1,554 (-15%) | 4mo | $172,000 | $111 | 34 |
Match score weights: distance 35% · size 25% · config 20% · recency 20%. Top-matched comps best support the ARV.
Projected returns pro-forma
-3.0% appreciation · 6.85% rent growth · sell at horizon
- IRR
- -5.5%
- Equity multiple
- 0.79×
- Total profit
- $-10,104
- Equity at exit
- $25,333
- IRR
- 8.7%
- Equity multiple
- 1.79×
- Total profit
- $37,580
- Equity at exit
- $14,690
Cash invested: $47,572 (down + closing). Projections, not guarantees.
Landlord ↔ Tenant lean methodology
- Overall (STATE)
- 73 Landlord-Friendly
- State Ohio
- 73 Landlord-Friendly · R+6
- County
- — inherits STATE
- City
- — inherits STATE
ZIP-level market 44121
- Rents YoY
- 6.8%
- Active inventory
- 150
- Price-to-rent
- 7.6×
Monthly cashflow live
- Estimated rent
- $1,861 high interval (Pro) →
- Mortgage (P&I)
- −$891
- Tax from tax record
- −$354 /mo · $4,247/yr
- Insurance
- −$71
- HOA
- −$0
- Vacancy / Maint / Mgmt
- −$391
- Net cashflow
- $154
Break-even live
Sensitivity live
| Price | -10% $250 | -5% $202 | +0% $154 | +5% $106 | +10% $58 |
|---|---|---|---|---|---|
| Rent | -10% $7 | -5% $81 | +0% $154 | +5% $228 | +10% $301 |
| Rate | -1.0pp $240 | -0.5pp $197 | base $154 | +0.5pp $110 | +1.0pp $65 |
UW: 25.0% down · 7.5% · 30yr · 1.5% tax · 5.0% vac · 8.0% maint · 8.0% mgmt
Financing live
Cash to close
- Down payment
- $42,475
- Closing costs
- $5,097
- Reserves months
- —
- Total cash needed
- —
Loan-product check · same deal, 3 products live
Conventional
25% down · 7.5% · 30yr
- Down + closing
- —
- Monthly P&I
- —
- Monthly cashflow
- —
- DSCR
- —
- Eligible?
- —
Personal DTI + credit; lowest rate.
DSCR
20% down · 8.5% · 30yr
- Down + closing
- —
- Monthly P&I
- —
- Monthly cashflow
- —
- DSCR
- —
- Eligible?
- —
No personal income docs; deal must DSCR.
Hard money
10% down · 12.0% · 12mo
- Down + closing
- —
- Monthly P&I
- —
- Monthly cashflow
- —
- DSCR
- —
- Eligible?
- —
Short-term bridge; refi at stabilization.
Rent comps 32 comps
| Address | Beds | Baths | Sqft | Rent | $/sqft | DOM | Units | Dist |
|---|---|---|---|---|---|---|---|---|
| 994 Yellowstone Rd Cleveland, OH | 3.0 | 2.0 | 1475 | $1,395 | $0.95 | 4d | 1 | 0.27mi |
| 821 Nela View Rd Cleveland, OH | 4.0 | 2.5 | 2178 | $2,100 | $0.96 | 9d | 1 | 0.28mi |
| 936 Selwyn Rd Cleveland, OH | 3.0 | 1.0 | 1228 | $1,559 | $1.27 | 0d | 1 | 0.29mi |
| 1007 Elbon Rd Cleveland, OH | 3.0 | 1.0 | 1386 | $1,400 | $1.01 | 12d | 1 | 0.30mi |
| 963 Selwyn Rd Cleveland, OH | 4.0 | 1.0 | 1300 | $2,650 | $2.04 | 0d | 1 | 0.31mi |
| 3430 Winsford Rd Cleveland, OH | 4.0 | 1.5 | 1800 | $1,590 | $0.88 | 18d | 1 | 0.35mi |
| 1035 Elbon Rd Cleveland, OH | 4.0 | 1.5 | 1304 | $1,675 | $1.28 | 18d | 1 | 0.35mi |
| 915 Nela View Rd Cleveland, OH | 4.0 | 1.0 | 1300 | $2,600 | $2.00 | 18d | 1 | 0.38mi |
| 983 Greyton Rd Cleveland, OH | 3.0 | 2.0 | 1457 | $1,495 | $1.03 | 18d | 1 | 0.43mi |
| 1099 Woodview Rd Cleveland, OH | 4.0 | 1.0 | 1500 | $2,500 | $1.67 | 0d | 1 | 0.47mi |
| 876 Eloise Dr Unit Upper Cleveland Heights, OH | 2.0 | 1.0 | 1233 | $1,200 | $0.97 | 18d | 1 | 0.51mi |
| 1158 Castleton Rd Cleveland, OH | 4.0 | 1.5 | 2250 | $1,675 | $0.74 | 0d | 1 | 0.59mi |
| 3406 Henderson Rd Cleveland, OH | 4.0 | 1.5 | 1343 | $2,250 | $1.68 | 18d | 1 | 0.61mi |
| 3802 Princeton Blvd Cleveland, OH | 3.0 | 1.5 | 1656 | $2,275 | $1.37 | 0d | 1 | 0.63mi |
| 3337 Sylvanhurst Rd Cleveland, OH | 3.0 | 1.0 | 1334 | $1,800 | $1.35 | 9d | 1 | 0.64mi |
| 910 Dresden Rd Cleveland, OH | 4.0 | 2.0 | 1839 | $1,800 | $0.98 | 18d | 1 | 0.68mi |
| 3930 Delmore Rd Cleveland, OH | 4.0 | 1.5 | 1600 | $1,640 | $1.02 | 0d | 1 | 0.75mi |
| 16000 Terrace Rd Cleveland, OH | 1.0–3.0 | 1.0–2.0 | 1000 | $1,210 | $1.21 | 4d | 39 | 0.78mi |
| 3924 Orchard Rd Cleveland, OH | 3.0 | 1.0 | 1407 | $1,995 | $1.42 | 0d | 1 | 0.82mi |
| 2401 N Taylor Rd Cleveland, OH | 3.0 | 1.0 | 1347 | $1,325 | $0.98 | 9d | 1 | 0.83mi |
| 1082 Hillstone Rd Cleveland, OH | 3.0 | 2.0 | 2376 | $1,695 | $0.71 | 26d | 1 | 0.84mi |
| 1082 Hillstone Rd Unit 1 Cleveland Heights, OH | 3.0 | 1.5 | 2376 | $1,695 | $0.71 | 26d | 1 | 0.84mi |
| 3917 Bluestone Rd Cleveland, OH | 4.0 | 1.5 | 1700 | $1,650 | $0.97 | 23d | 1 | 0.86mi |
| 3808 Kirkwood Rd Cleveland, OH | 4.0 | 1.5 | 1740 | $2,150 | $1.24 | 16d | 1 | 0.89mi |
| 15801 Hazel Rd Cleveland, OH | 3.0 | 1.5 | 1908 | $1,550 | $0.81 | 18d | 1 | 0.98mi |
| 3810 Parkdale Rd Cleveland, OH | 3.0 | 1.5 | 1281 | $2,067 | $1.61 | 4d | 1 | 1.00mi |
| 303 S Green Rd Cleveland, OH | 4.0 | 2.0 | 1381 | $1,700 | $1.23 | 4d | 1 | 1.11mi |
| 1462 Parkhill Rd Cleveland, OH | 4.0 | 1.0 | 1451 | $1,950 | $1.34 | 0d | 1 | 1.25mi |
| 1286 E 152nd St Cleveland, OH | 2.0 | 1.0 | 1638 | $1,095 | $0.67 | 46d | 1 | 1.32mi |
| 963 Chelston Rd Cleveland, OH | 4.0 | 2.0 | 1974 | $1,950 | $0.99 | 46d | 1 | 1.38mi |
| 1497 S Noble Rd Cleveland, OH | 4.0 | 1.0 | 1250 | $2,650 | $2.12 | 0d | 1 | 1.40mi |
| 1584 Maple Rd Cleveland, OH | 3.0 | 2.0 | 1359 | $1,700 | $1.25 | 26d | 1 | 1.45mi |
Listing history 9 events
-
2026-06-02status $169,900 Pending 14 DOM
-
2026-06-01days on market $169,900 Active 14 DOM
-
2026-05-31days on market $169,900 Active 13 DOM
-
2026-05-18$169,900 Active
-
2019-04-29soldstatus $45,000
-
2019-04-24soldstatus $45,000 Sold 466-char remark
Show marketing remark (466 chars)
Multiple offers received, seller has requested highest and best due 3/28 by Noon Don't miss out on this great Cleveland Height cape cod! Large single family three bedroom brick home. Home has great potential. First floor consists of a full bath, family room/office and bedroom. Large all season room or side porch. Hardwood floors and replacement windows. Two bedrooms upstairs with full bathroom. Two car detached garage and fenced in back yard. Come take a look.
-
2019-04-05status Pending 466-char remark
Show marketing remark (466 chars)
Multiple offers received, seller has requested highest and best due 3/28 by Noon Don't miss out on this great Cleveland Height cape cod! Large single family three bedroom brick home. Home has great potential. First floor consists of a full bath, family room/office and bedroom. Large all season room or side porch. Hardwood floors and replacement windows. Two bedrooms upstairs with full bathroom. Two car detached garage and fenced in back yard. Come take a look.
-
2019-03-18$49,900 Active 466-char remark
Show marketing remark (466 chars)
Multiple offers received, seller has requested highest and best due 3/28 by Noon Don't miss out on this great Cleveland Height cape cod! Large single family three bedroom brick home. Home has great potential. First floor consists of a full bath, family room/office and bedroom. Large all season room or side porch. Hardwood floors and replacement windows. Two bedrooms upstairs with full bathroom. Two car detached garage and fenced in back yard. Come take a look.
-
1985-03-18soldstatus $59,000
ⓘ Source: listings_history table (triggers on properties + properties_extension) + one-shot
backfill from property_details.listing_events for pre-trigger history.
Tax reassessment forecast OH · Partial reset (capped growth)
- Current annual tax
- $4,247 · $354/mo
- Projected year-2 tax
- $4,247 · $354/mo
- Expected delta
- $0/yr ($0/mo · 0.0%)
ⓘ Screening estimate from a state-policy table — verify with the county assessor before closing.
Climate risk First Street
- Flood 1/10 Low FEMA zone X (unshaded) · 0% chance over 30 yrs
- Wildfire 1/10 Low
- Heat 3/10 Moderate 7 d/yr ≥95°F today · 17 d/yr by 30 yrs out
- Wind 1/10 Low
- Air quality 3/10 Moderate 3 unhealthy d/yr today · 5 by 30 yrs out
Nearby sold comps map
Loading sold comps map…
Walkable amenities ~0.75 mi
Loading nearby amenities…
Taxation est. · year 1
- Rental income
- $22,328
- − Mortgage interest
- −$9,517
- − Property taxes
- −$4,247
- − Insurance
- −$850
- − Repairs & maintenance
- −$1,786
- − Management
- −$1,786
- − Depreciation
- −$4,943
- Taxable loss
- −$800
- Est. tax savings @ 24.0%
- +$192
- After-tax cash flow
- $2,043/yr
For passive investors: Depreciation is non-cash, so a rental often shows a tax loss while cash-flowing — sheltering income. Rental losses are passive: they offset passive income freely, and up to $25,000/yr can offset ordinary (W-2) income if you actively participate and your MAGI is under $100k (phasing out to $0 by $150k); unused losses carry forward. On sale, claimed depreciation is recaptured at up to 25%, and gains may owe capital-gains tax (a 1031 exchange can defer both). Figures are a year-1 estimate at your 24.0% rate — not tax advice; consult a CPA.
Schools (NCES district)
- District
- Cleveland Heights-University Heights City
- NCES district ID
- 3904379
- Math proficiency
- 23% ▼ -22.00%
- Reading proficiency
- 41% ▼ -12.00%
- Median HH income
- $53,451
- Composite
- 28.12/100
- National rank
- #6822
- State rank
- #568 of 656 in OH
Livability — Cleveland Heights
- Score
- 89/100
- State rank
- #12
- US rank
- #124
Category grades
Schools grade is shown separately in the Schools card above.
Census & demographics
- Census place
- Cleveland Heights, OH
- County
- Cuyahoga County · 1,090,369 people
- City population
- 32,312
- Metro
- Cleveland-Elyria, OH
- Population (ZIP)
- 32,312
- Household income
- $76,767
- Rent vs Own
- Severe rent burden
- 672.0
Population outlook (Cuyahoga County) Hauer SSP2
- Today (2025)
- 1,244,621 people
- By 2030
- 1,230,093 · -1.2%
- By 2040
- 1,189,108 · -4.5%
- By 2050
- 1,145,706 · -7.9%
- By 2075
- 1,076,557 · -13.5%
- By 2100
- 978,987 · -21.3%
Race, ethnicity, and origin ACS 2023
- Neighborhood character
- Diverse neighborhood (Simpson 0.56)
- Race & ethnicity
- Black 55% White 36% Two or more races 4% Hispanic / Latino 3% Asian 2%
- Common ancestry
- Romanian 3% Italian 2% Scotch-Irish 2%
- Foreign-born
- 5% · Canada, China, India
- Languages at home
- 92% English-only · Spanish 2% Chinese 1% Other Indo-European 1%
Political lean MEDSL · Cuyahoga
- 2024 margin
- Solid D (+31.5) · D 65.4% · R 33.9%
- 2008→2024 swing
- -7.4pp toward R · 2008: 38.9pp · 2024: 31.5pp
- All cycles
- 2024: D+31.5 2020: D+34.1 2016: D+35.0 2012: D+38.7 2008: D+38.9
Not yet ingested
- Civics
- —
Market trends
- HPI YoY
- ▼ -180.15%
- Current HPI
- 173.7405
- Rent YoY
- ▲ 6.85%
- Metro
- Cleveland-Elyria, OH
- State GDP YoY
- ▲ 1.98%
- F500 in state
- 48
Industry mix (Fortune 500 HQ in OH)
| Industry | F500 HQs | Revenue |
|---|---|---|
| Insurance | 3 | $145B |
|
||
| Industrial Machinery | 3 | $49B |
|
||
| Financial Services | 3 | $24B |
|
||
| Consumer Goods | 2 | $93B |
|
||
| Aerospace / Defense | 2 | $47B |
|
||
| Utilities | 2 | $33B |
|
||
Price history
+188.0% since first listed6 events — show timeline
- 2026-05-18 Listed $169,900 MLSNOW
- 2019-04-29 Sold (Public Records) $45,000 Public Records
- 2019-04-24 Sold (MLS) $45,000 MLSNOW
- 2019-04-05 Pending — MLSNOW
- 2019-03-18 Listed $49,900 MLSNOW
- 1985-03-18 Sold (Public Records) $59,000 Public Records
Property tax history
+4.1%/yrLatest (2025): $4,247 · +0.7% YoY. Source: county tax records.
Cash-flow waterfall
monthlySold comps — $/sqft
last 12 mo · ≤1 miLoading sold comps…