1405 Vz County Road 4111 · Canton, TX
Flood risk 1/10 · Minimal
- FEMA flood zone
- X (unshaded)
- Chance of flooding over 30 yrs
- 0.0%
- Est. flood insurance / yr
- $507 – $1,088
Fire risk 4/10 · Minor
- Est. fire insurance / yr
- $1,222 – $2,270
Heat risk 7/10 · Major
- Hot days now (above 109°F)
- 7 days/yr
- Hot days in 30 yrs
- 25 days/yr
Wind risk 6/10 · Moderate
- Chance of severe wind over 30 yrs
- 71.0%
Air-quality risk 2/10 · Minimal
- Unhealthy air days now
- 0 days/yr
- Unhealthy air days in 30 yrs
- 1 days/yr
Risk factors via First Street. Map © Google.
Why this score? — see what drove the C grade
The composite is a weighted blend of 9 inputs, each scored 0–100. Each bar is that input's sub-score; the figure is the points it added to the 100-point composite (weight × sub-score).
- Cash flow +23.0/30.0
- ARV discount +7.5/15.0
- DSCR +7.4/10.0
- 1% rule +5.8/10.0
- Schools +4.4/10.0
- Livability +3.6/5.0
- Rent growth +2.5/5.0
- Condition / age +2.5/5.0
- Appreciation +0.0/10.0
$145,000
🖨 Deal sheet 📄 Offer letter ✓ Due diligence
Listing remarks
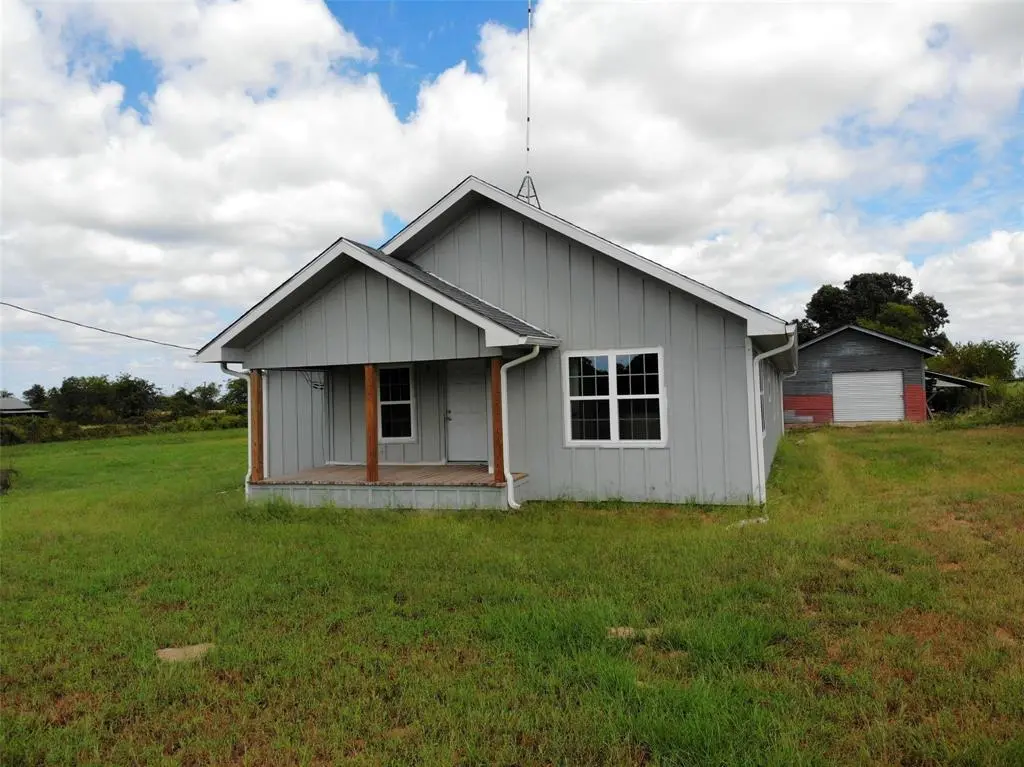
Bring your vision to this unique investment opportunity in a peaceful country setting within Canton ISD. Situated on 2 acres, the property already has several major improvements completed, including a newly installed roof, siding, and foundation—offering a strong starting point for your renovation plans. Inside, the home is ready for a full remodel and can be customized to fit your needs and style. A septic hookup, RV electric hookup, water, and an RV cover are already in place, allowing the potential to live on-site while completing renovations. The included shipping container provides additional storage and functionality. With no deed restrictions, the property offers endless possib
Key facts
- Septic hookup
- New siding
- New foundation
Tags
Property features AI
Finance
- Other: Horse permitted on the property
- Financial info: Listing terms include cash or contact agent; Treat as clear loan type; No second mortgage indicated
- HOA & community: No association
Exterior
- Parking: Detached carport; Driveway parking; Garage present with 1 garage space; 2 carport spaces; 3 covered parking spaces; Additional parking available
- Security: Smoke detector(s)
- Utilities: Co-op water; Electricity connected; Overhead utilities; Septic; Not in a municipal utility district
- Home design: Single family residence; Residential property; Not attached to another property; No accessory unit; Built in 1957; No subdivision restrictions (No Restrictions); Subdivision: J Russell
- Construction: Board & batten siding; Composition roof; Concrete perimeter and pillar/post/pier foundation
- Exterior features: Covered porch(es); RV hookup; Barbed wire, metal and wire fencing; Fenced; Acreage, cleared and pasture vegetation; Sandy loam soil; Easements for electric, telephone and water lines
Interior
- Kitchen: No appliances listed
- Bedrooms: 3 bedrooms (primary bedroom on level 1)
- Flooring: Vinyl flooring; Wood flooring
- Bathrooms: 2 full bathrooms and 1 half bathroom
- Heating & cooling: No heating listed; No cooling listed
- Interior features: One and a half levels; One living area; One dining area; Living room with a wood-burning stove fireplace; Smoke detector(s)
- Laundry & utility: No laundry appliances listed
Neighborhood map
What this means for you Summary
Snapshot
- This is a 3-bed/2.5-bath single-family listed at $145k.
Deal economics
- At list price, monthly cash flow is $258 ($3k/yr) — positive.
- The deal already cash-flows at list — no discount required.
- Meets the 1% rule at list price ($2k rent vs $145k).
- Recommended offer: $143k (1.5% below list) — sets the bar for market timing.
- Cap rate 8.4% vs local median 3.0% in Canton — top-decile yield for the area; either an underpriced asset or a hidden risk that comps aren't pricing in. Stress-test before assuming the spread holds.
Location & tenants
- Location reads 72/100 on livability (#239 in TX) — a middle-class / working-renter tenant base. Strengths: cost of living A+, housing A+, health & safety A+; Watch: employment C-, amenities F, commute F.
- Canton ISD (town): math 49% / reading 55% proficiency, ranked #151 of 826 in TX (top 18%) — acceptable for families but not a draw, mixed tenant base, ~2y average lease.
- Zoned schools: Canton El (571 students, 57% FRL) — zoned schools average 57% FRL vs 40% district-wide (17 pts higher); higher-poverty schools than district average — tighter screening recommended.
- Market conditions: 259 active listings in the ZIP; 54 units permitted in Van Zandt County in 2024 (0 in 5+ unit buildings).
Forward outlook
- Local home prices are declining (-3.0%/yr); year-one equity from $1k of loan paydown is wiped out by about $4k of value loss. Plan a longer hold.
- Van Zandt County population projected at +4% by 2050 — modest demand growth; plan on rents tracking national, not racing it.
Negotiation context
- It's been on market 24 days — a 2% lower offer ($143k) is reasonable based on typical stale-listing flexibility.
- 3 sale attempts with the ask held roughly flat each time — persistent listings suggest the price (not the market) is what's stuck; bring a comps-based counter.
Risks & watch-outs
- Watch-outs: built in 1957 — expect roof / HVAC / electrical / plumbing capex.
- Climate carrying-cost: major wind risk, 71% chance of damaging wind over 30y; extreme-heat days projected 7→25/yr by 2055 (HVAC capex compounding) — expect insurance premiums to compound above CPI over the hold.
Questions for the listing agent
- Built in 1957 — when were the roof, HVAC, electrical panel, plumbing, and water heater last replaced?
- Is there a deadline driving the sale (1031 exchange, divorce, estate, relocation)? That informs how much negotiation room exists.
- Schools are D-rated, which usually means shorter tenancies and higher turnover. Who's the typical renter profile here, and what's been the actual vacancy rate?
- What's the average days-on-market for RENTAL listings here right now (not sales)? A rising rental-DOM trend means longer vacancies and softer asking-rent achievability than the comps imply.
- What's the recent tenant-quality profile in this submarket — average credit score on applications, eviction rate, late-payment / NSF rate, and stable-employment percentage? A property-management company in the area should have these aggregated.
- How much new for-sale + rental construction is in the pipeline within 1–3 miles? Heavy new supply typically softens prices + rents 12–24 months out; constrained supply supports both.
Investment metrics
- 1% rule
- 1.08% ✓
- Cap rate
- 8.42%
- Cash-on-cash
- 7.61%
- DSCR
- 1.34
- GRM
- 7.7
CMA / ARV
- ARV (median comp)
- $320,825
- List price
- $145,000
- Delta
- -54.80%
- Verdict
- UNDERPRICED
- Comps
- 7 within 1.0 mi
Show comp detail 1 sale within ~0.75 mi
| Address | Dist | Beds/Ba | Sqft | Sold | Price | $/sf | Match |
|---|---|---|---|---|---|---|---|
| 19179 State Highway 64 | 0.53mi | 2/2.5 (-1) | 2,016 (+10%) | 4mo | $390,000 | $193 | 50 |
Match score weights: distance 35% · size 25% · config 20% · recency 20%. Top-matched comps best support the ARV.
Projected returns pro-forma
-3.0% appreciation · 3.0% rent growth · sell at horizon
- IRR
- -4.7%
- Equity multiple
- 0.83×
- Total profit
- $-7,079
- Equity at exit
- $21,620
- IRR
- 5.0%
- Equity multiple
- 1.37×
- Total profit
- $15,012
- Equity at exit
- $12,537
Cash invested: $40,600 (down + closing). Projections, not guarantees.
Landlord ↔ Tenant lean methodology
- Overall (STATE)
- 87 Strongly Landlord-Friendly
- State Texas
- 87 Strongly Landlord-Friendly · R+5
- County
- — inherits STATE
- City
- — inherits STATE
ZIP-level market 75103
- Home prices YoY
- -14.3%
- Active inventory
- 259
- Price-to-rent
- 7.7×
Monthly cashflow live
- Estimated rent
- $1,573 medium interval (Pro) →
- Mortgage (P&I)
- −$760
- Tax from tax record
- −$164 /mo · $1,970/yr
- Insurance
- −$60
- HOA
- −$0
- Vacancy / Maint / Mgmt
- −$330
- Net cashflow
- $258
Break-even live
UW: 25.0% down · 7.5% · 30yr · 1.5% tax · 5.0% vac · 8.0% maint · 8.0% mgmt
Financing live
Cash to close
- Down payment
- $36,250
- Closing costs
- $4,350
- Reserves months
- —
- Total cash needed
- —
Loan-product check · same deal, 3 products live
Conventional
25% down · 7.5% · 30yr
- Down + closing
- —
- Monthly P&I
- —
- Monthly cashflow
- —
- DSCR
- —
- Eligible?
- —
Personal DTI + credit; lowest rate.
DSCR
20% down · 8.5% · 30yr
- Down + closing
- —
- Monthly P&I
- —
- Monthly cashflow
- —
- DSCR
- —
- Eligible?
- —
No personal income docs; deal must DSCR.
Hard money
10% down · 12.0% · 12mo
- Down + closing
- —
- Monthly P&I
- —
- Monthly cashflow
- —
- DSCR
- —
- Eligible?
- —
Short-term bridge; refi at stabilization.
Listing history 18 events
-
2026-06-08statusdays on market $145,000 Pending 24 DOM
-
2026-06-07days on market $145,000 Active 23 DOM
-
2026-06-04days on market $145,000 Active 20 DOM
-
2026-06-03days on market $145,000 Active 19 DOM
-
2026-06-02days on market $145,000 Active 18 DOM
-
2026-06-01days on market $145,000 Active 17 DOM
-
2026-05-31days on market $145,000 Active 16 DOM
-
2026-05-15$145,000 Active 1036-char remark
-
2026-05-01historical
-
2026-04-30status Active
-
2026-04-20status Pending
-
2026-04-09historical Active Option Contract
-
2026-02-10price $160,000
-
2025-11-18price $175,000
-
2025-09-24$185,000 Active
-
2021-08-03soldstatus
-
1997-11-06soldstatus
-
1992-09-04soldstatus
ⓘ Source: listings_history table (triggers on properties + properties_extension) + one-shot
backfill from property_details.listing_events for pre-trigger history.
Tax reassessment forecast TX · Resets to sale price
- Current annual tax
- $1,970 · $164/mo
- Projected year-2 tax
- $2,654 · $221/mo
- Expected delta
- +$684/yr (+$57/mo · 34.7%)
ⓘ Screening estimate from a state-policy table — verify with the county assessor before closing.
Climate risk First Street
- Flood 1/10 Low FEMA zone X (unshaded) · 0% chance over 30 yrs
- Wildfire 4/10 Moderate
- Heat 7/10 Severe 7 d/yr ≥109°F today · 25 d/yr by 30 yrs out
- Wind 6/10 Major 71% chance of damaging wind over 30 yrs
- Air quality 2/10 Low 0 unhealthy d/yr today · 1 by 30 yrs out
Nearby sold comps map
Loading sold comps map…
Walkable amenities ~0.75 mi
Loading nearby amenities…
Taxation est. · year 1
- Rental income
- $18,874
- − Mortgage interest
- −$8,122
- − Property taxes
- −$1,970
- − Insurance
- −$725
- − Repairs & maintenance
- −$1,510
- − Management
- −$1,510
- − Depreciation
- −$4,218
- Taxable income
- $819
- Est. tax owed @ 24.0%
- −$196
- After-tax cash flow
- $2,894/yr
For passive investors: Depreciation is non-cash, so a rental often shows a tax loss while cash-flowing — sheltering income. Rental losses are passive: they offset passive income freely, and up to $25,000/yr can offset ordinary (W-2) income if you actively participate and your MAGI is under $100k (phasing out to $0 by $150k); unused losses carry forward. On sale, claimed depreciation is recaptured at up to 25%, and gains may owe capital-gains tax (a 1031 exchange can defer both). Figures are a year-1 estimate at your 24.0% rate — not tax advice; consult a CPA.
Schools (NCES district)
- District
- Canton ISD
- NCES district ID
- 4812750
- Math proficiency
- 49% ▼ -12.00%
- Reading proficiency
- 55% ▼ -1.00%
- Median HH income
- $46,385
- Composite
- 44.08/100
- National rank
- #2877
- State rank
- #151 of 826 in TX
Livability — Canton
- Score
- 72/100
- State rank
- #239
- US rank
- #5787
Category grades
Schools grade is shown separately in the Schools card above.
Census & demographics
- Population (ZIP)
- 16,222
Population outlook (Van Zandt County) Hauer SSP2
- Today (2025)
- 55,634 people
- By 2030
- 56,479 · +1.5%
- By 2040
- 57,672 · +3.7%
- By 2050
- 57,913 · +4.1%
- By 2075
- 57,544 · +3.4%
- By 2100
- 52,659 · -5.3%
Race, ethnicity, and origin ACS 2023
- Neighborhood character
- Predominantly White (86%)
- Race & ethnicity
- White 86% Hispanic / Latino 7% Two or more races 5% Black 1%
- Hispanic origin (detail)
- Mexican 7%
- Common ancestry
- Lithuanian 2% Italian 1% Slovak 1%
- Foreign-born
- 2% · Canada
- Languages at home
- 95% English-only · Spanish 4%
Political lean MEDSL · Van Zandt
- 2024 margin
- Solid R (+74.8) · D 12.3% · R 87.2%
- 2008→2024 swing
- -19.8pp toward R · 2008: -55.1pp · 2024: -74.8pp
- All cycles
- 2024: R+74.8 2020: R+72.1 2016: R+72.1 2012: R+66.6 2008: R+55.1
Not yet ingested
- Civics
- —
Market trends
- HPI YoY
- ▼ -38.07%
- Current HPI
- 227.6156
- Rent YoY
- —
- Metro
- —
- State GDP YoY
- ▲ 3.95%
- F500 in state
- 110
Industry mix (Fortune 500 HQ in TX)
| Industry | F500 HQs | Revenue |
|---|---|---|
| Energy | 16 | $1,198B |
|
||
| Technology | 5 | $198B |
|
||
| Engineering / Construction | 4 | $72B |
|
||
| Energy Services | 3 | $60B |
|
||
| Utilities | 3 | $41B |
|
||
| Healthcare | 2 | $330B |
|
||
Price history
-21.6% since first listed12 events — show timeline
- 2026-06-08 Pending — NTREIS
- 2026-05-15 Listed $145,000 NTREIS
- 2026-05-01 Listing Removed — NTREIS
- 2026-04-30 Relisted — NTREIS
- 2026-04-20 Pending — NTREIS
- 2026-04-09 Contingent — NTREIS
- 2026-02-10 Price Changed $160,000 NTREIS
- 2025-11-18 Price Changed $175,000 NTREIS
- 2025-09-24 Listed $185,000 NTREIS
- 2021-08-03 Sold (Public Records) — Public Records
- 1997-11-06 Sold (Public Records) — Public Records
- 1992-09-04 Sold (Public Records) — Public Records
Property tax history
+11.0%/yrLatest (2025): $1,970 · -2.3% YoY. Source: county tax records.
Cash-flow waterfall
monthlySold comps — $/sqft
last 12 mo · ≤1 miLoading sold comps…