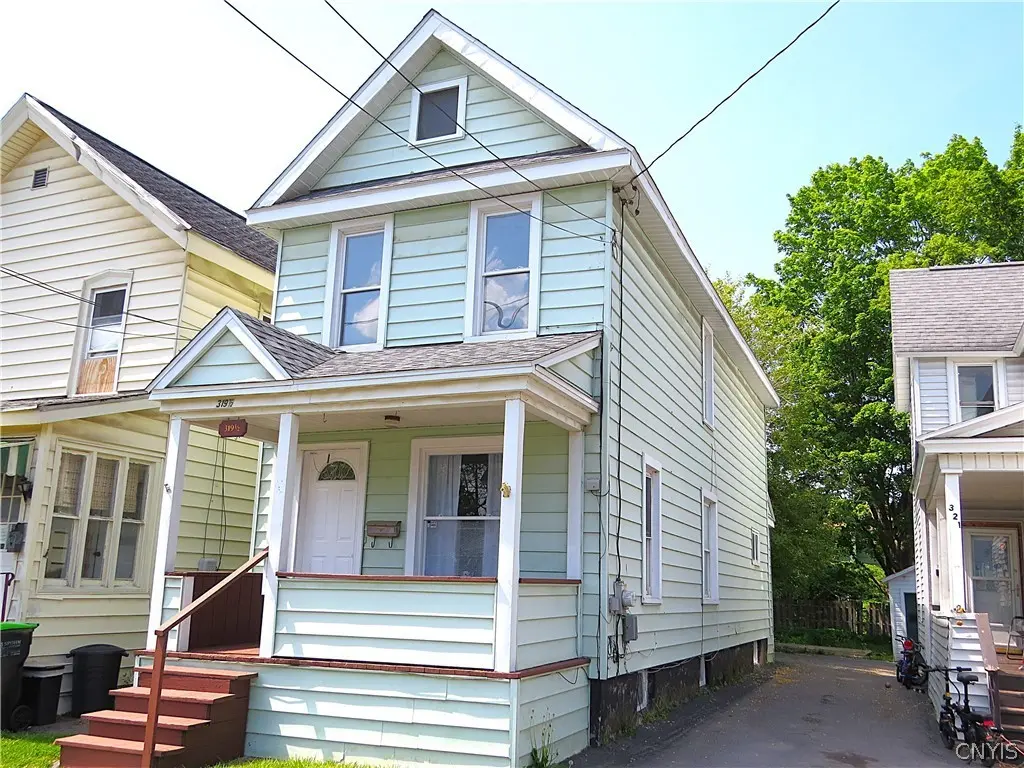
319 1/2 Pleasant Ave · Herkimer, NY
Flood risk 1/10 · Minimal
- FEMA flood zone
- X (unshaded)
- Chance of flooding over 30 yrs
- 0.0%
- Est. flood insurance / yr
- $473 – $860
Fire risk 1/10 · Minimal
- Est. fire insurance / yr
- $691 – $1,283
Heat risk 3/10 · Minor
- Hot days now (above 98°F)
- 7 days/yr
- Hot days in 30 yrs
- 17 days/yr
Wind risk 2/10 · Minimal
- Chance of severe wind over 30 yrs
- 1.0%
Air-quality risk 1/10 · Minimal
- Unhealthy air days now
- 0 days/yr
- Unhealthy air days in 30 yrs
- 0 days/yr
Risk factors via First Street. Map © Google.
Why this score? — see what drove the A grade
The composite is a weighted blend of 9 inputs, each scored 0–100. Each bar is that input's sub-score; the figure is the points it added to the 100-point composite (weight × sub-score).
- Cash flow +30.0/30.0
- ARV discount +15.0/15.0
- 1% rule +10.0/10.0
- DSCR +10.0/10.0
- Appreciation +10.0/10.0
- Schools +3.9/10.0
- Livability +3.6/5.0
- Rent growth +2.5/5.0
- Condition / age +2.2/5.0
$84,900
🖨 Deal sheet 📄 Offer letter ✓ Due diligence
Listing remarks MLS
Interior freshly painted and new flooring. Updated kitchen and bath. Relaxing front porch and a low maintenance yard.
Key facts
- Double living room
- Modern bath
- Private yard
Tags
Property features AI
Exterior
- Parking: No garage; Shared driveway
- Utilities: Cable available; Sewer connected (public); Water connected (public)
- Home design: 2 stories; Existing/previously built home
- Construction: Vinyl siding; Architectural shingle roof; Stone foundation
- Exterior features: Blacktop driveway; Open porch
Interior
- Kitchen: Gas oven; Gas range; Refrigerator
- Bedrooms: Total rooms: 6 (includes living and laundry areas)
- Flooring: Carpet; Laminate; Varies
- Bathrooms: 1 full bathroom (main level)
- Heating & cooling: Gas heating; Hot water heating; Radiator(s)
- Interior features: Ceiling fan(s); Eat-in kitchen; Separate/formal living room; Country kitchen; Thermal windows
- Laundry & utility: Laundry in basement; Gas water heater
Neighborhood map
What this means for you Summary
Snapshot
- This is a 3-bed/1.0-bath single-family listed at $85k. Condition is rated fair.
Deal economics
- At list price, monthly cash flow is $756 ($9k/yr) — positive.
- The deal already cash-flows at list — no discount required.
- Meets the 1% rule at list price ($2k rent vs $85k).
- Recommended offer: $84k (1.5% below list) — sets the bar for market timing.
- Cap rate 17.0% vs local median 5.5% in Herkimer — top-decile yield for the area; either an underpriced asset or a hidden risk that comps aren't pricing in. Stress-test before assuming the spread holds.
Location & tenants
- Location reads 71/100 on livability (#392 in NY) — a middle-class / working-renter tenant base. Strengths: cost of living A+, housing A+, health & safety A+; Watch: schools D+, amenities D+, crime D.
- Herkimer Central School District (town): math 46% / reading 47% proficiency, ranked #455 of 590 in NY (top 77%) — families likely to look elsewhere, expect single-tenant / working-renter base with shorter leases.
- Market conditions: 56 active listings in the ZIP; 1 comparable units currently listed for rent nearby; 54 units permitted in Herkimer County in 2024 (0 in 5+ unit buildings).
Forward outlook
- In year one you build about $9k of equity ($587 loan paydown + $8k appreciation (10.0% local appreciation)).
- Herkimer County population projected at -24% by 2050 — secular population decline; favor cash flow + early exit over multi-decade hold.
- At projected returns (10.0% appreciation + 3.0% rent growth), your $24k cash investment doubles in ~2 years — after that, you're playing with house money.
- By year 4, paydown + projected appreciation supports a ~$32k cash-out refi (75% LTV) — recoverable capital for the next deal without selling this one.
Negotiation context
- It's been on market 22 days — a 2% lower offer ($84k) is reasonable based on typical stale-listing flexibility.
- 2 sale attempts since 4y ago with the ask held roughly flat each time — persistent listings suggest the price (not the market) is what's stuck; bring a comps-based counter.
- Current owner paid $52k; list at $85k implies a 63% gain — meaningful room to come down on a strong offer.
Risks & watch-outs
- Watch-outs: built in 1890 — expect roof / HVAC / electrical / plumbing capex.
Questions for the listing agent
- Have any recent inspections been done? Can we get a copy of the seller's disclosures and any deferred-maintenance estimates?
- Built in 1890 — when were the roof, HVAC, electrical panel, plumbing, and water heater last replaced?
- Is there a deadline driving the sale (1031 exchange, divorce, estate, relocation)? That informs how much negotiation room exists.
- Schools are D-rated, which usually means shorter tenancies and higher turnover. Who's the typical renter profile here, and what's been the actual vacancy rate?
- Crime grade is D in this area — have there been break-ins, vandalism, or insurance claims at this property in the last 3 years? What carrier currently insures it and at what premium?
- What's the average days-on-market for RENTAL listings here right now (not sales)? A rising rental-DOM trend means longer vacancies and softer asking-rent achievability than the comps imply.
- What's the recent tenant-quality profile in this submarket — average credit score on applications, eviction rate, late-payment / NSF rate, and stable-employment percentage? A property-management company in the area should have these aggregated.
- How much new for-sale + rental construction is in the pipeline within 1–3 miles? Heavy new supply typically softens prices + rents 12–24 months out; constrained supply supports both.
Investment metrics
- 1% rule
- 2.00% ✓
- Cap rate
- 16.98%
- Cash-on-cash
- 38.18%
- DSCR
- 2.70
- GRM
- 4.2
CMA / ARV
- ARV (on-the-fly)
- $156,240
- Comps found
- 12
Show comp detail 12 sales within ~0.75 mi
| Address | Dist | Beds/Ba | Sqft | Sold | Price | $/sf | Match |
|---|---|---|---|---|---|---|---|
| 309 Eureka Ave | 0.07mi | 2/1.0 (-1) | 1,183 (-6%) | 15mo | $105,000 | $89 | 69 |
| 352 Eureka Ave | 0.10mi | 3/1.5 | 1,386 (+10%) | 12mo | $110,000 | $79 | 66 |
| 310 Steuben St | 0.39mi | 3/1.0 | 1,196 (-5%) | 9mo | $148,000 | $124 | 66 |
| 318 Gray St | 0.42mi | 3/1.0 | 1,316 (+4%) | 11mo | $145,500 | $111 | 64 |
| 317 S Bellinger St | 0.54mi | 3/1.5 | 1,216 (-4%) | 5mo | $171,720 | $141 | 63 |
| 609 Malcolm St | 0.34mi | 3/1.0 | 1,137 (-10%) | 7mo | $110,000 | $97 | 62 |
| 150 Folts Rd | 0.53mi | 3/1.5 | 1,188 (-6%) | 10mo | $184,000 | $155 | 55 |
| 156 Folts Rd | 0.54mi | 3/1.5 | 1,296 (+3%) | 17mo | $157,000 | $121 | 54 |
| 349 Gray St | 0.48mi | 2/1.0 (-1) | 1,344 (+7%) | 13mo | $155,000 | $115 | 51 |
| 209 Pullman St | 0.32mi | 2/1.0 (-1) | 1,092 (-13%) | 13mo | $152,000 | $139 | 47 |
| 308 West St | 0.75mi | 4/2.0 (+1) | 1,324 (+5%) | 8mo | $214,000 | $162 | 41 |
| 180 Main Rd | 0.69mi | 3/1.5 | 1,392 (+10%) | 15mo | $180,200 | $129 | 36 |
Match score weights: distance 35% · size 25% · config 20% · recency 20%. Top-matched comps best support the ARV.
Projected returns pro-forma
10.0% appreciation · 3.0% rent growth · sell at horizon
- IRR
- 53.7%
- Equity multiple
- 4.97×
- Total profit
- $94,432
- Equity at exit
- $76,485
- IRR
- 47.3%
- Equity multiple
- 11.11×
- Total profit
- $240,259
- Equity at exit
- $164,942
Cash invested: $23,772 (down + closing). Projections, not guarantees.
Landlord ↔ Tenant lean methodology
- Overall (STATE)
- 15 Strongly Tenant-Friendly
- State New York
- 15 Strongly Tenant-Friendly · D+10
- County
- — inherits STATE
- City
- — inherits STATE
ZIP-level market 13350
- Home prices YoY
- 8.9%
- Active inventory
- 56
- Price-to-rent
- 4.2×
Monthly cashflow live
- Estimated rent
- $1,700 medium interval (Pro) →
- Mortgage (P&I)
- −$445
- Tax est. 1.5%
- −$106 /mo · $1,274/yr
- Insurance
- −$35
- HOA
- −$0
- Vacancy / Maint / Mgmt
- −$357
- Net cashflow
- $756
Break-even live
UW: 25.0% down · 7.5% · 30yr · 1.5% tax · 5.0% vac · 8.0% maint · 8.0% mgmt
Financing live
Cash to close
- Down payment
- $21,225
- Closing costs
- $2,547
- Reserves months
- —
- Total cash needed
- —
Loan-product check · same deal, 3 products live
Conventional
25% down · 7.5% · 30yr
- Down + closing
- —
- Monthly P&I
- —
- Monthly cashflow
- —
- DSCR
- —
- Eligible?
- —
Personal DTI + credit; lowest rate.
DSCR
20% down · 8.5% · 30yr
- Down + closing
- —
- Monthly P&I
- —
- Monthly cashflow
- —
- DSCR
- —
- Eligible?
- —
No personal income docs; deal must DSCR.
Hard money
10% down · 12.0% · 12mo
- Down + closing
- —
- Monthly P&I
- —
- Monthly cashflow
- —
- DSCR
- —
- Eligible?
- —
Short-term bridge; refi at stabilization.
Rent comps 1 comps
| Address | Beds | Baths | Sqft | Rent | $/sqft | DOM | Units | Dist |
|---|---|---|---|---|---|---|---|---|
| 502 Lake St Herkimer, NY | 3.0 | 1.0 | 1125 | $1,700 | $1.51 | 43d | 1 | 0.77mi |
Listing history 12 events
-
2026-06-09statusdays on market $84,900 Pending 22 DOM
-
2026-06-08days on market $84,900 Active 21 DOM
-
2026-06-07days on market $84,900 Active 20 DOM
-
2026-06-07days on market $84,900 Active 19 DOM
-
2026-06-04days on market $84,900 Active 16 DOM
-
2026-06-02days on market $84,900 Active 15 DOM
-
2026-06-01days on market $84,900 Active 14 DOM
-
2026-05-31days on market $84,900 Active 13 DOM
-
2026-05-18$84,900 Active
-
2022-08-03soldstatus $52,000 Closed 119-char remark
Show marketing remark (119 chars)
Interior freshly painted and new flooring. Updated kitchen and bath. Relaxing front porch and a low maintenance yard.
-
2022-04-21historical Contingent 119-char remark
Show marketing remark (119 chars)
Interior freshly painted and new flooring. Updated kitchen and bath. Relaxing front porch and a low maintenance yard.
-
2022-04-14$52,000 Active 119-char remark
Show marketing remark (119 chars)
Interior freshly painted and new flooring. Updated kitchen and bath. Relaxing front porch and a low maintenance yard.
ⓘ Source: listings_history table (triggers on properties + properties_extension) + one-shot
backfill from property_details.listing_events for pre-trigger history.
Climate risk First Street
- Flood 1/10 Low FEMA zone X (unshaded) · 0% chance over 30 yrs
- Wildfire 1/10 Low
- Heat 3/10 Moderate 7 d/yr ≥98°F today · 17 d/yr by 30 yrs out
- Wind 2/10 Low 100% chance of damaging wind over 30 yrs
- Air quality 1/10 Low 0 unhealthy d/yr today · 0 by 30 yrs out
Nearby sold comps map
Loading sold comps map…
Walkable amenities ~0.75 mi
Loading nearby amenities…
Taxation est. · year 1
- Rental income
- $20,400
- − Mortgage interest
- −$4,756
- − Property taxes
- −$1,274
- − Insurance
- −$424
- − Repairs & maintenance
- −$1,632
- − Management
- −$1,632
- − Depreciation
- −$2,470
- Taxable income
- $8,212
- Est. tax owed @ 24.0%
- −$1,971
- After-tax cash flow
- $7,104/yr
For passive investors: Depreciation is non-cash, so a rental often shows a tax loss while cash-flowing — sheltering income. Rental losses are passive: they offset passive income freely, and up to $25,000/yr can offset ordinary (W-2) income if you actively participate and your MAGI is under $100k (phasing out to $0 by $150k); unused losses carry forward. On sale, claimed depreciation is recaptured at up to 25%, and gains may owe capital-gains tax (a 1031 exchange can defer both). Figures are a year-1 estimate at your 24.0% rate — not tax advice; consult a CPA.
Condition & rehab AI · 1 photo
This home requires moderate renovations, including painting, landscaping, and updating fixtures and flooring, to significantly increase its resale and rental value.
Repairs flagged
- Minor Paint — Light paint wear on exterior and interior.
- Minor Landscaping — No visible damage, but could be improved for curb appeal.
Value-add opportunities
- Both Paint exterior and interior — Fresh paint enhances curb appeal and interior aesthetics.
- Both Landscaping — Improved landscaping can increase both resale and rental value.
- Both Replace dated kitchen and bath fixtures — Modern fixtures can significantly boost both resale and rental value.
- Both Replace dated flooring — Fresh flooring can enhance both resale and rental value.
- Both Replace dated windows — New windows can improve energy efficiency and curb appeal, boosting both resale and rental value.
Renovation cost estimate screening
| Repair item | Severity | Est. cost |
|---|---|---|
| Paint · Light paint wear on exterior and interior. | Minor | $500–3,000 |
| Landscaping · No visible damage, but could be improved for curb appeal. | Minor | $500–3,000 |
| Total estimated repair cost · 2 items | $1,000–6,000 |
Value-add ROI direction
- Both Paint exterior and interior — Fresh paint enhances curb appeal and interior aesthetics. ↑
- Both Landscaping — Improved landscaping can increase both resale and rental value. ↑
- Both Replace dated kitchen and bath fixtures — Modern fixtures can significantly boost both resale and rental value. ↑
- Both Replace dated flooring — Fresh flooring can enhance both resale and rental value. ↑
- Both Replace dated windows — New windows can improve energy efficiency and curb appeal, boosting both resale and rental value. ↑
ⓘ Cost ranges are severity-bucket heuristics (US national rule-of-thumb). Get contractor quotes + a written scope before underwriting a rehab budget.
Schools (NCES district)
- District
- Herkimer Central School District
- NCES district ID
- 3614220
- Math proficiency
- 46% ▲ 6.00%
- Reading proficiency
- 47% ▲ 9.00%
- Median HH income
- $39,447
- Composite
- 38.87/100
- National rank
- #4100
- State rank
- #455 of 590 in NY
Livability — Herkimer
- Score
- 71/100
- State rank
- #392
- US rank
- #6787
Category grades
Schools grade is shown separately in the Schools card above.
Census & demographics
- Census place
- Herkimer, NY
- Population (ZIP)
- 9,641
Population outlook (Herkimer County) Hauer SSP2
- Today (2025)
- 59,340 people
- By 2030
- 56,838 · -4.2%
- By 2040
- 51,098 · -13.9%
- By 2050
- 45,080 · -24.0%
- By 2075
- 32,648 · -45.0%
- By 2100
- 22,266 · -62.5%
Race, ethnicity, and origin ACS 2023
- Neighborhood character
- Predominantly White (90%)
- Race & ethnicity
- White 90% Two or more races 5% Black 2% Asian 2% Hispanic / Latino 1%
- Common ancestry
- Romanian 9% Lithuanian 4% Italian 3%
- Foreign-born
- 4% · Canada, China
- Languages at home
- 92% English-only · French/Haitian/Cajun 2% Other Asian/Pacific 1% Spanish 1%
Political lean MEDSL · Herkimer
- 2024 margin
- Solid R (+36.4) · D 31.8% · R 68.2%
- 2008→2024 swing
- -27.1pp toward R · 2008: -9.3pp · 2024: -36.4pp
- All cycles
- 2024: R+36.4 2020: R+30.5 2016: R+34.5 2012: R+8.4 2008: R+9.3
Not yet ingested
- Civics
- —
Market trends
- HPI YoY
- ▲ 26.43%
- Current HPI
- 324.4601
- Rent YoY
- —
- Metro
- —
- State GDP YoY
- ▲ 2.60%
- F500 in state
- 92
Industry mix (Fortune 500 HQ in NY)
| Industry | F500 HQs | Revenue |
|---|---|---|
| Financial Services | 10 | $950B |
|
||
| Consumer Goods | 9 | $162B |
|
||
| Insurance | 4 | $225B |
|
||
| Telecommunications | 2 | $144B |
|
||
| Pharmaceuticals | 2 | $112B |
|
||
| Media / Entertainment | 2 | $69B |
|
||
Price history
+63.3% since first listed4 events — show timeline
- 2026-05-18 Listed $84,900 CNYIS
- 2022-08-03 Sold (MLS) $52,000 Global MLS
- 2022-04-21 Contingent — Global MLS
- 2022-04-14 Listed $52,000 Global MLS
Cash-flow waterfall
monthlySold comps — $/sqft
last 12 mo · ≤1 miLoading sold comps…