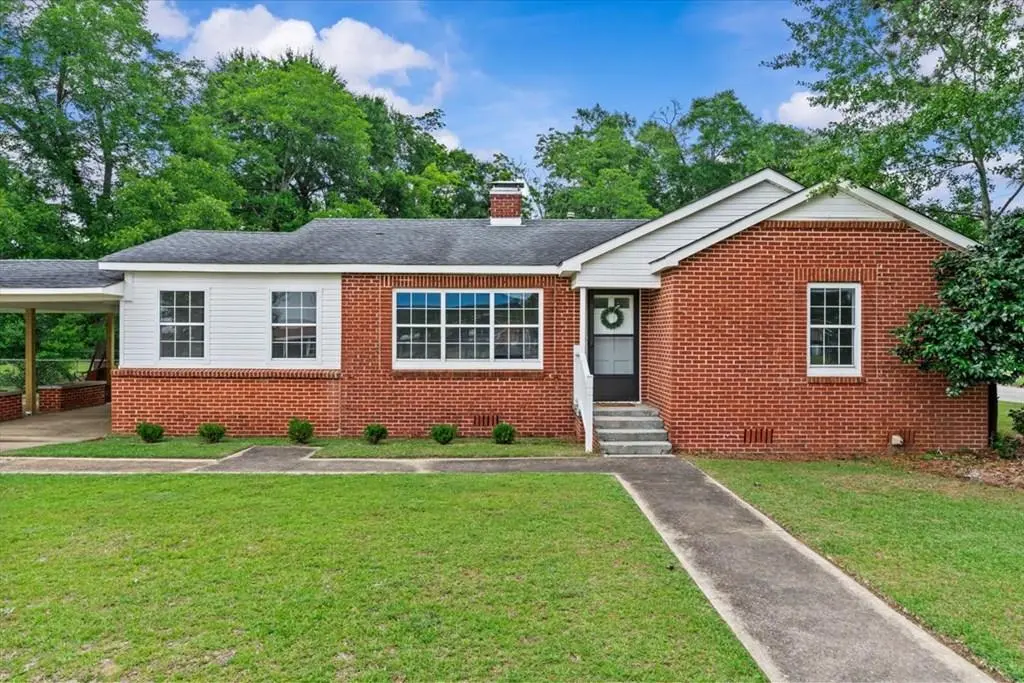
409 Peachtree St · Headland, AL
Flood risk 1/10 · Minimal
- FEMA flood zone
- X (unshaded)
- Chance of flooding over 30 yrs
- 0.0%
- Est. flood insurance / yr
- $507 – $1,088
Fire risk 4/10 · Minor
- Est. fire insurance / yr
- $916 – $1,700
Heat risk 7/10 · Major
- Hot days now (above 107°F)
- 7 days/yr
- Hot days in 30 yrs
- 19 days/yr
Wind risk 8/10 · Major
- Chance of severe wind over 30 yrs
- 99.0%
Air-quality risk 2/10 · Minimal
- Unhealthy air days now
- 1 days/yr
- Unhealthy air days in 30 yrs
- 2 days/yr
Risk factors via First Street. Map © Google.
Why this score? — see what drove the D grade
The composite is a weighted blend of 9 inputs, each scored 0–100. Each bar is that input's sub-score; the figure is the points it added to the 100-point composite (weight × sub-score).
- Cash flow +16.5/30.0
- ARV discount +5.2/15.0
- DSCR +5.1/10.0
- Livability +3.3/5.0
- 1% rule +3.2/10.0
- Schools +2.8/10.0
- Rent growth +2.5/5.0
- Condition / age +2.5/5.0
- Appreciation +0.0/10.0
$209,900
🖨 Deal sheet (PDF) 📄 Offer letter ✓ Due diligence
Listing remarks MLS
Charming 3 bedroom home in a highly convenient Headland location! Situated on a spacious corner lot with mature trees, this property offers the perfect blend of privacy, character, and accessibility. Inside, you'll find beautiful wood floors, abundant natural light, and a functional layout featuring 3 bedrooms and 1.5 baths. Enjoy the outdoors with a large fenced backyard ideal for pets, play, or gatherings plus a shed on the property for storage, hobbies, or projects. Updates include a newer roof and newer HVAC, giving you peace of mind from day one. It's hard to beat the convenience, charm, and value this home offers in such a desirable part of Headland. Don't miss this opportunity!
Key facts
- New kitchen cabinets
- New appliances
- Second full bathroom
Tags
Property features AI
Exterior
- Parking: 2 total parking spaces; 2 covered spaces; Attached carport
- Utilities: Public water; Public sewer
- Home design: Single-family residence; One story
- Construction: Brick and vinyl siding exterior
- Exterior features: Covered patio/porch; On waterfront; Storage structure
Interior
- Kitchen: Cooktop; Range; Dishwasher; Microwave
- Flooring: Tile; Vinyl; Other
- Bathrooms: 2 full bathrooms
- Interior features: Ceiling fans; Double-pane windows; Fireplace (1)
- Laundry & utility: Indoor laundry
Neighborhood map
What this means for you Summary
Snapshot
- This is a 3-bed/2.0-bath single-family listed at $210k.
Deal economics
- At list price, monthly cash flow is $123 ($1k/yr) — positive.
- The deal already cash-flows at list — no discount required.
- To meet the 1% rule (rent ≥ 1% of price), the offer needs to be $172k (18.2% below list).
- Recommended offer: $172k (18.2% below list) — sets the bar for 1% rule.
- Cap rate 7.0% vs local median 3.8% in Headland — top-decile yield for the area; either an underpriced asset or a hidden risk that comps aren't pricing in. Stress-test before assuming the spread holds.
Location & tenants
- Location reads 66/100 on livability (#101 in AL) — a middle-class / working-renter tenant base. Strengths: cost of living A+, housing A+, crime B+; Watch: health & safety D, amenities F, commute F.
- Henry County (rural): math 21% / reading 45% proficiency, ranked #55 of 129 in AL (top 43%) — families likely to look elsewhere, expect single-tenant / working-renter base with shorter leases.
- Zoned schools: Headland Elementary School (math 39% / reading 59%, grade D, #132 of 627 statewide, top 21%, 858 students, 48% FRL); Headland Middle School (math 16% / reading 58%, grade F, #73 of 257 statewide, top 29%, 576 students, 47% FRL); Headland High School (math 17% / reading 27%, grade F, #142 of 305 statewide, top 51%, 412 students, 49% FRL).
- Market conditions: 173 active listings in the ZIP; 71 units permitted in Henry County in 2024 (0 in 5+ unit buildings).
Forward outlook
- Local home prices are declining (-3.0%/yr); year-one equity from $1k of loan paydown is wiped out by about $6k of value loss. Plan a longer hold.
- Henry County population projected to shrink 8% by 2050 — rents likely to lag national; underwrite the cash flow, not the appreciation.
Negotiation context
- Only 11 days on market — expect competitive offers; lowballing is unlikely to land.
- 2 sale attempts with the ask held roughly flat each time — persistent listings suggest the price (not the market) is what's stuck; bring a comps-based counter.
- Current owner paid $100k; list at $210k implies a 110% gain — meaningful room to come down on a strong offer.
Risks & watch-outs
- Climate carrying-cost: severe wind risk, 99% chance of damaging wind over 30y; extreme-heat days projected 7→19/yr by 2055 (HVAC capex compounding) — expect insurance premiums to compound above CPI over the hold.
Questions for the listing agent
- Built in 1960 — when were the roof, HVAC, electrical panel, plumbing, and water heater last replaced?
- Is there a deadline driving the sale (1031 exchange, divorce, estate, relocation)? That informs how much negotiation room exists.
- Schools are D-rated, which usually means shorter tenancies and higher turnover. Who's the typical renter profile here, and what's been the actual vacancy rate?
- The area grade is low — what's the realistic commute time and amenity access for the typical tenant pool here? Any planned neighborhood developments (good or bad) we should know about?
- What's the average days-on-market for RENTAL listings here right now (not sales)? A rising rental-DOM trend means longer vacancies and softer asking-rent achievability than the comps imply.
- What's the recent tenant-quality profile in this submarket — average credit score on applications, eviction rate, late-payment / NSF rate, and stable-employment percentage? A property-management company in the area should have these aggregated.
- How much new for-sale + rental construction is in the pipeline within 1–3 miles? Heavy new supply typically softens prices + rents 12–24 months out; constrained supply supports both.
Investment metrics
- 1% rule
- 0.82% ✗
- Cap rate
- 7.00%
- Cash-on-cash
- 2.51%
- DSCR
- 1.11
- GRM
- 10.2
CMA / ARV
- ARV (on-the-fly)
- $199,552
- Comps found
- 12
Show comp detail 12 sales within ~0.75 mi
| Address | Dist | Beds/Ba | Sqft | Sold | Price | $/sf | Match |
|---|---|---|---|---|---|---|---|
| 409 Peachtree St | 0.00mi | 3/1.5 | 1,559 (0%) | 6mo | $100,000 | $64 | 93 |
| 505 E Church St | 0.27mi | 3/2.0 | 1,583 (+2%) | 4mo | $214,900 | $136 | 81 |
| 505 Cleveland St | 0.26mi | 3/2.0 | 1,648 (+6%) | 2mo | $168,500 | $102 | 77 |
| 615 Mitchell St | 0.29mi | 3/2.0 | 1,575 (+1%) | 13mo | $185,000 | $117 | 74 |
| 203 Mitchell St | 0.20mi | 3/2.0 | 1,642 (+5%) | 11mo | $210,000 | $128 | 73 |
| 622 Peachtree St | 0.38mi | 3/1.5 | 1,622 (+4%) | 6mo | $215,000 | $133 | 68 |
| 109 Aubrey Ave | 0.38mi | 3/2.0 | 1,618 (+4%) | 9mo | $249,900 | $154 | 68 |
| 403 S Main St | 0.46mi | 3/2.0 | 1,596 (+2%) | 12mo | $180,000 | $113 | 65 |
| 611 Mitchell St | 0.26mi | 2/1.0 (-1) | 1,476 (-5%) | 7mo | $140,000 | $95 | 64 |
| 137 Gracebrook Ct | 0.59mi | 3/2.0 | 1,357 (-13%) | 2mo | $220,000 | $162 | 50 |
| 618 Cleveland St | 0.42mi | 3/2.0 | 1,346 (-14%) | 14mo | $174,000 | $129 | 46 |
| 108 Sweetwater Dr | 0.46mi | 3/2.0 | 1,772 (+14%) | 15mo | $207,500 | $117 | 43 |
Match score weights: distance 35% · size 25% · config 20% · recency 20%. Top-matched comps best support the ARV.
Projected returns pro-forma
-3.0% appreciation · 3.0% rent growth · sell at horizon
- IRR
- -12.4%
- Equity multiple
- 0.55×
- Total profit
- $-26,287
- Equity at exit
- $31,297
- IRR
- -3.4%
- Equity multiple
- 0.77×
- Total profit
- $-13,242
- Equity at exit
- $18,148
Cash invested: $58,772 (down + closing). Projections, not guarantees.
Landlord ↔ Tenant lean methodology
- Overall (STATE)
- 90 Strongly Landlord-Friendly
- State Alabama
- 90 Strongly Landlord-Friendly · R+15
- County
- — inherits STATE
- City
- — inherits STATE
ZIP-level market 36345
- Home prices YoY
- -16.0%
- Active inventory
- 173
- Price-to-rent
- 10.2×
Monthly cashflow live
- Estimated rent
- $1,717 medium interval (Pro) →
- Mortgage (P&I)
- −$1,101
- Tax from tax record
- −$45 /mo · $542/yr
- Insurance
- −$87
- HOA
- −$0
- Vacancy / Maint / Mgmt
- −$361
- Net cashflow
- $123
Break-even live
Sensitivity live
| Price | -10% $242 | -5% $182 | +0% $123 | +5% $64 | +10% $4 |
|---|---|---|---|---|---|
| Rent | -10% $-13 | -5% $55 | +0% $123 | +5% $191 | +10% $259 |
| Rate | -1.0pp $229 | -0.5pp $176 | base $123 | +0.5pp $69 | +1.0pp $13 |
UW: 25.0% down · 7.5% · 30yr · 1.5% tax · 5.0% vac · 8.0% maint · 8.0% mgmt
Financing live
Cash to close
- Down payment
- $52,475
- Closing costs
- $6,297
- Reserves months
- —
- Total cash needed
- —
Loan-product check · same deal, 3 products live
Conventional
25% down · 7.5% · 30yr
- Down + closing
- —
- Monthly P&I
- —
- Monthly cashflow
- —
- DSCR
- —
- Eligible?
- —
Personal DTI + credit; lowest rate.
DSCR
20% down · 8.5% · 30yr
- Down + closing
- —
- Monthly P&I
- —
- Monthly cashflow
- —
- DSCR
- —
- Eligible?
- —
No personal income docs; deal must DSCR.
Hard money
10% down · 12.0% · 12mo
- Down + closing
- —
- Monthly P&I
- —
- Monthly cashflow
- —
- DSCR
- —
- Eligible?
- —
Short-term bridge; refi at stabilization.
Listing history 10 events
-
2026-06-22days on market $209,900 Active 11 DOM
-
2026-06-21days on market $209,900 Active 10 DOM
-
2026-06-19days on market $209,900 Active 8 DOM
-
2026-06-18days on market $209,900 Active 7 DOM
-
2026-06-17days on market $209,900 Active 6 DOM
-
2026-06-16days on market $209,900 Active 5 DOM
-
2026-06-15days on market $209,900 Active 4 DOM
-
2026-06-14days on market $209,900 Active 2 DOM
-
2026-06-12remarks 699-char remark
-
2026-06-12$209,900 Active 1 DOM
ⓘ Source: listings_history table (triggers on properties + properties_extension) + one-shot
backfill from property_details.listing_events for pre-trigger history.
Tax reassessment forecast AL · Resets to sale price
- Current annual tax
- $542 · $45/mo
- Projected year-2 tax
- $861 · $72/mo
- Expected delta
- +$319/yr (+$27/mo · 58.9%)
ⓘ Screening estimate from a state-policy table — verify with the county assessor before closing.
Climate risk First Street
- Flood 1/10 Low FEMA zone X (unshaded) · 0% chance over 30 yrs
- Wildfire 4/10 Moderate
- Heat 7/10 Severe 7 d/yr ≥107°F today · 19 d/yr by 30 yrs out
- Wind 8/10 Severe 99% chance of damaging wind over 30 yrs
- Air quality 2/10 Low 1 unhealthy d/yr today · 2 by 30 yrs out
Nearby sold comps map
Loading sold comps map…
Walkable amenities ~0.75 mi
Loading nearby amenities…
Taxation est. · year 1
- Rental income
- $20,602
- − Mortgage interest
- −$11,758
- − Property taxes
- −$542
- − Insurance
- −$1,050
- − Repairs & maintenance
- −$1,648
- − Management
- −$1,648
- − Depreciation
- −$6,106
- Taxable loss
- −$2,149
- Est. tax savings @ 24.0%
- +$516
- After-tax cash flow
- $1,992/yr
For passive investors: Depreciation is non-cash, so a rental often shows a tax loss while cash-flowing — sheltering income. Rental losses are passive: they offset passive income freely, and up to $25,000/yr can offset ordinary (W-2) income if you actively participate and your MAGI is under $100k (phasing out to $0 by $150k); unused losses carry forward. On sale, claimed depreciation is recaptured at up to 25%, and gains may owe capital-gains tax (a 1031 exchange can defer both). Figures are a year-1 estimate at your 24.0% rate — not tax advice; consult a CPA.
Schools (NCES district)
- District
- Henry County
- NCES district ID
- 0101740
- Math proficiency
- 21% ▼ -15.00%
- Reading proficiency
- 45% ▲ 3.00%
- Median HH income
- $41,502
- Composite
- 27.78/100
- National rank
- #6894
- State rank
- #55 of 129 in AL
Livability — Headland
- Score
- 66/100
- State rank
- #101
- US rank
- #11540
Category grades
Schools grade is shown separately in the Schools card above.
Census & demographics
- Census place
- Headland, AL
- City population
- 8,838
- Population (ZIP)
- 8,838
Population outlook (Henry County) Hauer SSP2
- Today (2025)
- 17,109 people
- By 2030
- 16,928 · -1.1%
- By 2040
- 16,376 · -4.3%
- By 2050
- 15,778 · -7.8%
- By 2075
- 14,491 · -15.3%
- By 2100
- 12,673 · -25.9%
Race, ethnicity, and origin ACS 2023
- Neighborhood character
- Predominantly White (79%)
- Race & ethnicity
- White 79% Black 16% Two or more races 2% Hispanic / Latino 2% Asian 1%
- Common ancestry
- Slovak 2% Iranian 1% Romanian 1%
- Foreign-born
- 1% · Vietnam
Political lean MEDSL · Henry
- 2024 margin
- Solid R (+50.8) · D 24.3% · R 75.1%
- 2008→2024 swing
- -21.1pp toward R · 2008: -29.7pp · 2024: -50.8pp
- All cycles
- 2024: R+50.8 2020: R+43.0 2016: R+41.6 2012: R+29.4 2008: R+29.7
Not yet ingested
- Civics
- —
Market trends
- HPI YoY
- ▼ -40.45%
- Current HPI
- 213.0749
- Rent YoY
- —
- Metro
- —
- State GDP YoY
- ▲ 2.94%
- F500 in state
- 4
Industry mix (Fortune 500 HQ in AL)
| Industry | F500 HQs | Revenue |
|---|---|---|
| Financial Services | 1 | $8B |
|
||
| Healthcare | 1 | $5B |
|
||
Price history
+179.9% since first listed5 events — show timeline
- 2026-06-11 Listed $209,900 SAMLS
- 2026-01-05 Sold (MLS) $100,000 SAMLS
- 2025-12-07 Pending — SAMLS
- 2025-11-24 Listed $124,900 SAMLS
- 2007-03-28 Sold (Public Records) $75,000 Public Records
Property tax history
+5.2%/yrLatest (2025): $542 · +5.7% YoY. Source: county tax records.
Cash-flow waterfall
monthlySold comps — $/sqft
last 12 mo · ≤1 miLoading sold comps…