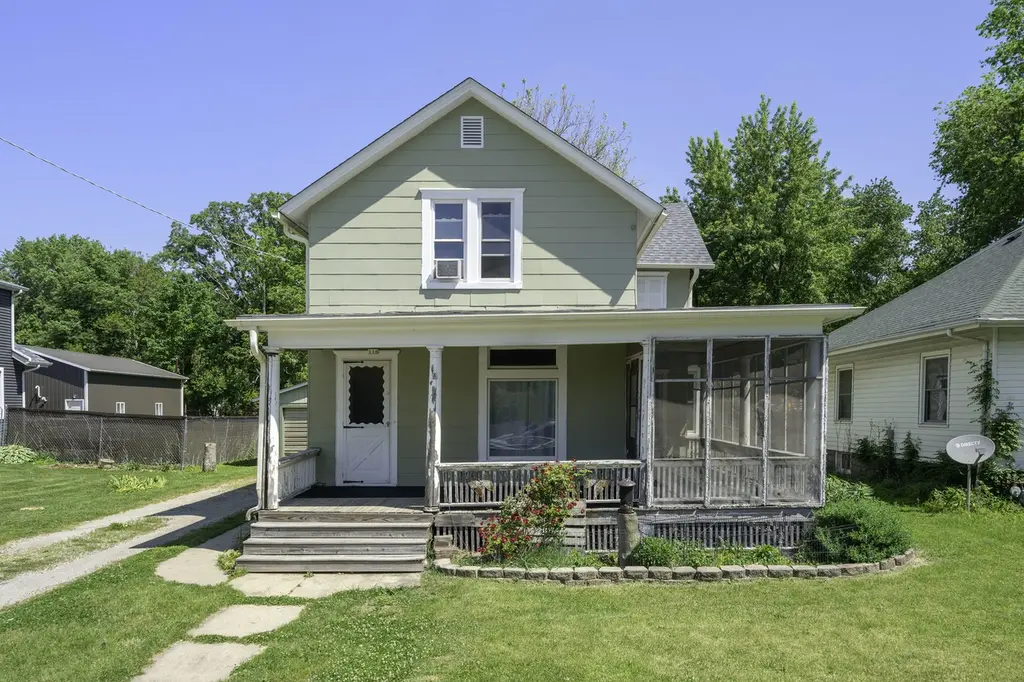
116 W Union St · Earlville, IL
Flood risk 1/10 · Minimal
- FEMA flood zone
- X (unshaded)
- Chance of flooding over 30 yrs
- 0.0%
- Est. flood insurance / yr
- $473 – $860
Fire risk 1/10 · Minimal
- Est. fire insurance / yr
- $804 – $1,492
Heat risk 3/10 · Minor
- Hot days now (above 102°F)
- 7 days/yr
- Hot days in 30 yrs
- 16 days/yr
Wind risk 2/10 · Minimal
- Chance of severe wind over 30 yrs
- 1.0%
Air-quality risk 3/10 · Minor
- Unhealthy air days now
- 1 days/yr
- Unhealthy air days in 30 yrs
- 3 days/yr
Risk factors via First Street. Map © Google.
Why this score? — see what drove the D+ grade
The composite is a weighted blend of 9 inputs, each scored 0–100. Each bar is that input's sub-score; the figure is the points it added to the 100-point composite (weight × sub-score).
- ARV discount +14.9/15.0
- Cash flow +14.4/30.0
- 1% rule +4.7/10.0
- DSCR +4.4/10.0
- Schools +3.3/10.0
- Livability +3.2/5.0
- Rent growth +2.5/5.0
- Condition / age +2.5/5.0
- Appreciation +0.0/10.0
$169,000
🖨 Deal sheet (PDF) 📄 Offer letter ✓ Due diligence
Listing remarks
4- 5 Bedroom, 2 Bath 2 story Hardwood floors, Updated electric in much of house, newer style windows. Roof and gutters 2yrs. Siding 1-2 yrs Wrap around front porch-partially screened 1 car garage and older Block garage for storage. Great home with lots of room front & back stairs Play set in back can stay
Key facts
- Updated electric
- Roof and gutters
- Newer style windows
Tags
Neighborhood map
What this means for you Summary
Snapshot
- This is a 5-bed/2.0-bath single-family listed at $169k.
Deal economics
- At list price, monthly cash flow is $35 ($422/yr) — positive.
- The deal already cash-flows at list — no discount required.
- To meet the 1% rule (rent ≥ 1% of price), the offer needs to be $164k (2.7% below list).
- Recommended offer: $164k (2.7% below list) — sets the bar for 1% rule.
Location & tenants
- Location reads 63/100 on livability (#749 in IL) — a middle-class / working-renter tenant base. Strengths: cost of living A+, housing A+, crime A; Watch: health & safety C-, employment D, amenities F.
- Earlville CUSD 9 (rural): math 30% / reading 40% proficiency, ranked #406 of 919 in IL (top 44%) — families likely to look elsewhere, expect single-tenant / working-renter base with shorter leases.
- Zoned schools: Earlville Elem School (math 22% / reading 22%, grade F, #940 of 2,056 statewide, top 49%, 242 students, 0% FRL); Earlville Jr/Sr High School (math 24% / reading 15%, grade F, #379 of 693 statewide, top 57%, 97 students, 0% FRL) — zoned schools average 0% FRL vs 46% district-wide (46 pts lower); this property's tenant base skews higher-income than the district average.
- Zoned-school proficiency averages 21% at this address vs 35% district-wide (-14 pts) — the specific schools serving this property underperform the Earlville CUSD 9 average; the district grade overstates school quality for this exact location.
- Market conditions: 33 active listings in the ZIP; 82 units permitted in LaSalle County in 2024 (0 in 5+ unit buildings).
Forward outlook
- Local home prices are declining (-3.0%/yr); year-one equity from $1k of loan paydown is wiped out by about $5k of value loss. Plan a longer hold.
- LaSalle County population projected at -16% by 2050 — secular population decline; favor cash flow + early exit over multi-decade hold.
Negotiation context
- It's been on market 23 days — a 2% lower offer ($166k) is reasonable based on typical stale-listing flexibility.
- 7 sale attempts since 19y ago with the ask held roughly flat each time — persistent listings suggest the price (not the market) is what's stuck; bring a comps-based counter.
- Current owner paid $87k; list at $169k implies a 94% gain — meaningful room to come down on a strong offer.
Risks & watch-outs
- Watch-outs: built in 1870 — expect roof / HVAC / electrical / plumbing capex.
Questions for the listing agent
- Built in 1870 — when were the roof, HVAC, electrical panel, plumbing, and water heater last replaced?
- Is there a deadline driving the sale (1031 exchange, divorce, estate, relocation)? That informs how much negotiation room exists.
- Schools are F-rated, which usually means shorter tenancies and higher turnover. Who's the typical renter profile here, and what's been the actual vacancy rate?
- The area grade is low — what's the realistic commute time and amenity access for the typical tenant pool here? Any planned neighborhood developments (good or bad) we should know about?
- What's the average days-on-market for RENTAL listings here right now (not sales)? A rising rental-DOM trend means longer vacancies and softer asking-rent achievability than the comps imply.
- What's the recent tenant-quality profile in this submarket — average credit score on applications, eviction rate, late-payment / NSF rate, and stable-employment percentage? A property-management company in the area should have these aggregated.
- How much new for-sale + rental construction is in the pipeline within 1–3 miles? Heavy new supply typically softens prices + rents 12–24 months out; constrained supply supports both.
Investment metrics
- 1% rule
- 0.97% ✗
- Cap rate
- 6.54%
- Cash-on-cash
- 0.89%
- DSCR
- 1.04
- GRM
- 8.6
CMA / ARV
- ARV (on-the-fly)
- $202,482
- Comps found
- 5
Show comp detail 5 sales within ~0.75 mi
| Address | Dist | Beds/Ba | Sqft | Sold | Price | $/sf | Match |
|---|---|---|---|---|---|---|---|
| 816 S Ottawa St | 0.12mi | 4/1.5 (-1) | 1,736 (+8%) | 5mo | $174,000 | $100 | 70 |
| 323 N Main St | 0.53mi | 4/1.0 (-1) | 1,604 (-0%) | 2mo | $102,500 | $64 | 64 |
| 518 Robinson St | 0.38mi | 4/2.0 (-1) | 1,581 (-2%) | 16mo | $266,000 | $168 | 62 |
| 902 S Ottawa St | 0.18mi | 4/1.5 (-1) | 1,772 (+10%) | 14mo | $224,000 | $126 | 56 |
| 400 Water St | 0.45mi | 4/2.0 (-1) | 1,730 (+8%) | 10mo | $285,000 | $165 | 53 |
Match score weights: distance 35% · size 25% · config 20% · recency 20%. Top-matched comps best support the ARV.
Projected returns pro-forma
-3.0% appreciation · 3.0% rent growth · sell at horizon
- IRR
- -14.8%
- Equity multiple
- 0.47×
- Total profit
- $-25,064
- Equity at exit
- $25,198
- IRR
- -6.1%
- Equity multiple
- 0.61×
- Total profit
- $-18,604
- Equity at exit
- $14,612
Cash invested: $47,320 (down + closing). Projections, not guarantees.
Landlord ↔ Tenant lean methodology
- Overall (STATE)
- 43 Moderately Tenant-Leaning
- State Illinois
- 43 Moderately Tenant-Leaning · D+7
- County
- — inherits STATE
- City
- — inherits STATE
ZIP-level market 60518
- Home prices YoY
- -17.5%
- Active inventory
- 33
- Price-to-rent
- 8.6×
Monthly cashflow live
- Estimated rent
- $1,644 medium interval (Pro) →
- Mortgage (P&I)
- −$886
- Tax from tax record
- −$307 /mo · $3,685/yr
- Insurance
- −$70
- HOA
- −$0
- Vacancy / Maint / Mgmt
- −$345
- Net cashflow
- $35
Break-even live
Sensitivity live
| Price | -10% $131 | -5% $83 | +0% $35 | +5% $-13 | +10% $-61 |
|---|---|---|---|---|---|
| Rent | -10% $-95 | -5% $-30 | +0% $35 | +5% $100 | +10% $165 |
| Rate | -1.0pp $120 | -0.5pp $78 | base $35 | +0.5pp $-9 | +1.0pp $-53 |
UW: 25.0% down · 7.5% · 30yr · 1.5% tax · 5.0% vac · 8.0% maint · 8.0% mgmt
Financing live
Cash to close
- Down payment
- $42,250
- Closing costs
- $5,070
- Reserves months
- —
- Total cash needed
- —
Loan-product check · same deal, 3 products live
Conventional
25% down · 7.5% · 30yr
- Down + closing
- —
- Monthly P&I
- —
- Monthly cashflow
- —
- DSCR
- —
- Eligible?
- —
Personal DTI + credit; lowest rate.
DSCR
20% down · 8.5% · 30yr
- Down + closing
- —
- Monthly P&I
- —
- Monthly cashflow
- —
- DSCR
- —
- Eligible?
- —
No personal income docs; deal must DSCR.
Hard money
10% down · 12.0% · 12mo
- Down + closing
- —
- Monthly P&I
- —
- Monthly cashflow
- —
- DSCR
- —
- Eligible?
- —
Short-term bridge; refi at stabilization.
Listing history 18 events
-
2026-06-22days on market $169,000 Active 23 DOM
-
2026-06-21days on market $169,000 Active 22 DOM
-
2026-06-21days on market $169,000 Active 21 DOM
-
2026-06-18days on market $169,000 Active 19 DOM
-
2026-06-17days on market $169,000 Active 18 DOM
-
2026-06-16days on market $169,000 Active 17 DOM
-
2026-06-15days on market $169,000 Active 16 DOM
-
2026-06-13days on market $169,000 Active 14 DOM
-
2026-06-12days on market $169,000 Active 13 DOM
-
2026-06-09days on market $169,000 Active 10 DOM
-
2026-06-08days on market $169,000 Active 9 DOM
-
2026-06-07days on market $169,000 Active 8 DOM
-
2026-06-05days on market $169,000 Active 6 DOM
-
2026-06-04days on market $169,000 Active 4 DOM
-
2026-06-02days on market $169,000 Active 3 DOM
-
2026-06-01days on market $169,000 Active 2 DOM
-
2026-05-31remarks 309-char remark
-
2026-05-31$169,000 Active 1 DOM
ⓘ Source: listings_history table (triggers on properties + properties_extension) + one-shot
backfill from property_details.listing_events for pre-trigger history.
Tax reassessment forecast IL · Partial reset (capped growth)
- Current annual tax
- $3,685 · $307/mo
- Projected year-2 tax
- $3,761 · $313/mo
- Expected delta
- +$75/yr (+$6/mo · 2.0%)
ⓘ Screening estimate from a state-policy table — verify with the county assessor before closing.
Climate risk First Street
- Flood 1/10 Low FEMA zone X (unshaded) · 0% chance over 30 yrs
- Wildfire 1/10 Low
- Heat 3/10 Moderate 7 d/yr ≥102°F today · 16 d/yr by 30 yrs out
- Wind 2/10 Low 100% chance of damaging wind over 30 yrs
- Air quality 3/10 Moderate 1 unhealthy d/yr today · 3 by 30 yrs out
Nearby sold comps map
Loading sold comps map…
Walkable amenities ~0.75 mi
Loading nearby amenities…
Taxation est. · year 1
- Rental income
- $19,731
- − Mortgage interest
- −$9,467
- − Property taxes
- −$3,685
- − Insurance
- −$845
- − Repairs & maintenance
- −$1,578
- − Management
- −$1,578
- − Depreciation
- −$4,916
- Taxable loss
- −$2,340
- Est. tax savings @ 24.0%
- +$562
- After-tax cash flow
- $983/yr
For passive investors: Depreciation is non-cash, so a rental often shows a tax loss while cash-flowing — sheltering income. Rental losses are passive: they offset passive income freely, and up to $25,000/yr can offset ordinary (W-2) income if you actively participate and your MAGI is under $100k (phasing out to $0 by $150k); unused losses carry forward. On sale, claimed depreciation is recaptured at up to 25%, and gains may owe capital-gains tax (a 1031 exchange can defer both). Figures are a year-1 estimate at your 24.0% rate — not tax advice; consult a CPA.
Schools (NCES district)
- District
- Earlville CUSD 9
- NCES district ID
- 1712930
- Math proficiency
- 30% ▼ -5.00%
- Reading proficiency
- 40% ▲ 16.00%
- Median HH income
- $49,735
- Composite
- 32.94/100
- National rank
- #10692
- State rank
- #406 of 919 in IL
Livability — Earlville
- Score
- 63/100
- State rank
- #749
- US rank
- #15219
Category grades
Schools grade is shown separately in the Schools card above.
Census & demographics
- Census place
- Earlville, IL
- Population (ZIP)
- 3,576
Population outlook (LaSalle County) Hauer SSP2
- Today (2025)
- 107,080 people
- By 2030
- 104,196 · -2.7%
- By 2040
- 97,413 · -9.0%
- By 2050
- 90,294 · -15.7%
- By 2075
- 76,252 · -28.8%
- By 2100
- 61,339 · -42.7%
Race, ethnicity, and origin ACS 2023
- Neighborhood character
- Predominantly White (83%)
- Race & ethnicity
- White 83% Hispanic / Latino 11% Two or more races 6%
- Hispanic origin (detail)
- Mexican 8% Puerto Rican 2%
- Common ancestry
- Portuguese 9% Lithuanian 5% Romanian 4%
- Foreign-born
- 4% · Canada
- Languages at home
- 92% English-only · Spanish 7% Russian/Polish/Slavic 1%
Political lean MEDSL · LaSalle
- 2024 margin
- R (+18.5) · D 40.1% · R 58.6% · Other 1.3%
- 2008→2024 swing
- -29.6pp toward R · 2008: 11.1pp · 2024: -18.5pp
- All cycles
- 2024: R+18.5 2020: R+14.3 2016: R+14.4 2012: R+0.4 2008: D+11.1
Not yet ingested
- Civics
- —
Market trends
- HPI YoY
- ▼ -40.43%
- Current HPI
- 190.6594
- Rent YoY
- —
- Metro
- —
- State GDP YoY
- ▲ 1.59%
- F500 in state
- 60
Industry mix (Fortune 500 HQ in IL)
| Industry | F500 HQs | Revenue |
|---|---|---|
| Insurance | 4 | $201B |
|
||
| Consumer Goods | 4 | $87B |
|
||
| Industrial Machinery | 3 | $64B |
|
||
| Healthcare | 2 | $55B |
|
||
| Retail / Pharmacy | 1 | $148B |
|
||
| Agriculture / Food | 1 | $86B |
|
||
Price history
+94.3% since first listed14 events — show timeline
- 2026-05-29 Listed $169,000 MRED as Distributed by MLS Grid
- 2018-10-18 Listing Removed — MRED as Distributed by MLS Grid
- 2018-06-19 Listed — MRED as Distributed by MLS Grid
- 2017-11-06 Listing Removed — MRED as Distributed by MLS Grid
- 2017-08-23 Listed — MRED as Distributed by MLS Grid
- 2008-01-14 Listing Removed — MRED as Distributed by MLS Grid
- 2008-01-07 Listed — MRED as Distributed by MLS Grid
- 2007-12-18 Listing Removed — MRED as Distributed by MLS Grid
- 2007-09-26 Listed — MRED as Distributed by MLS Grid
- 2007-09-25 Listing Removed — MRED as Distributed by MLS Grid
- 2007-06-25 Listed — MRED as Distributed by MLS Grid
- 2007-05-26 Listing Removed — MRED as Distributed by MLS Grid
- 2007-01-26 Listed — MRED as Distributed by MLS Grid
- 1999-08-31 Sold (Public Records) $87,000 Public Records
Property tax history
+5.0%/yrLatest (2024): $3,685 · +9.2% YoY. Source: county tax records.
Cash-flow waterfall
monthlySold comps — $/sqft
last 12 mo · ≤1 miLoading sold comps…