 Multi-family
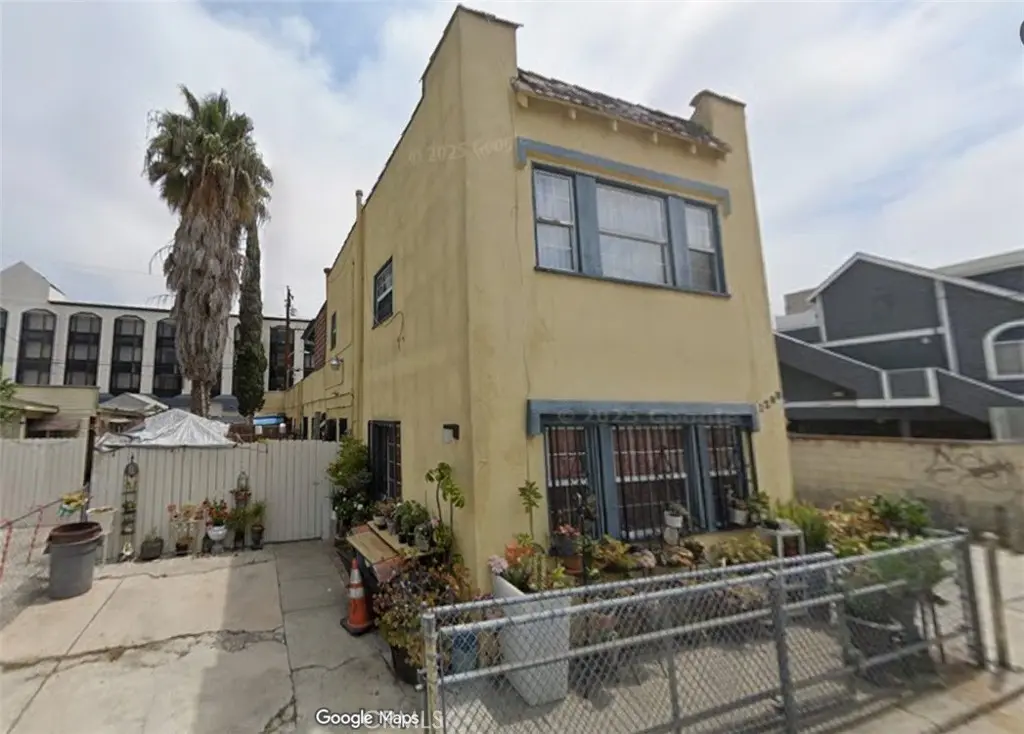
1208 N Saint Marys Ct · Long Beach, CA
Flood risk 1/10 · Minimal
- FEMA flood zone
- X (unshaded)
- Chance of flooding over 30 yrs
- 0.0%
- Est. flood insurance / yr
- $507 – $1,088
Fire risk 1/10 · Minimal
- Est. fire insurance / yr
- $659 – $1,223
Heat risk 4/10 · Minor
- Hot days now (above 88°F)
- 7 days/yr
- Hot days in 30 yrs
- 23 days/yr
Wind risk 1/10 · Minimal
- Chance of severe wind over 30 yrs
- —
Air-quality risk 6/10 · Moderate
- Unhealthy air days now
- 9 days/yr
- Unhealthy air days in 30 yrs
- 10 days/yr
Risk factors via First Street. Map © Google.
Why this score? — see what drove the C- grade
The composite is a weighted blend of 9 inputs, each scored 0–100. Each bar is that input's sub-score; the figure is the points it added to the 100-point composite (weight × sub-score).
- Cash flow +19.0/30.0
- ARV discount +12.6/15.0
- DSCR +6.0/10.0
- 1% rule +4.2/10.0
- Schools +3.7/10.0
- Livability +3.4/5.0
- Condition / age +2.5/5.0
- Rent growth +2.4/5.0
- Appreciation +0.0/10.0
$799,000
🖨 Deal sheet (PDF) 📄 Offer letter ✓ Due diligence
Multi-family units
County records classify this as Multi-Family (2-4 Unit). Listing-text estimate: 1 unit. estimate disagrees with records
Listing remarks
Excellent opportunity to acquire a value-add four-unit investment property in the highly desirable Downtown Long Beach submarket. This multi-unit asset offers strong in-place income with significant upside potential through renovation and rental repositioning. The property is currently generating approximately $58,500 in annual gross income, reflecting a current Gross Rent Multiplier (GRM) of 13.68 at the current list price and a cap rate of approximately 6.24%. These metrics position the asset as an attractive opportunity for investors seeking both immediate cash flow and long-term appreciation. With strategic improvements, investors have the ability to reposition the asset, increase rents
Key facts
- Waterfront access
- 3,242 sq ft lot
- Built 1923
Tags
Property features AI
Finance
- Other: Property is subject to rent control
- Financial info: Total of 4 residential units; Gross scheduled and operating income reported; Gross scheduled/operating income listed at $58,500; Gross spendable income listed at $52,500; Gross income listed at $40,000; Net operating income listed at $40,000; Total actual rent across units listed at $4,875; Individual unit rents reported: $1,050, $1,050, $1,300, $1,325; Operating expenses listed at $8,600 (including electric $3,000, water/sewer $3,100, insurance $1,500, trash $1,100); Three units currently leased; Separate meters: one water, one gas, one electric
Exterior
- Parking: Concrete driveway
- Utilities: Natural gas connected; Electricity connected (standard electric); Public/district water; Public sewer
- Home design: Attached multi-unit property; Two stories
- Construction: Frame and stucco construction; Flat roof; Single building containing all units; Built year sourced from assessor
- Exterior features: Corner lot; Fenced yard (fencing in poor condition); No pool; Sidewalks in the neighborhood
Interior
- Kitchen: Gas range; Central water heater and gas water heater
- Bedrooms: One unit with 3 bedrooms (unit-level info); One unit with 1 bedroom (unit-level info); Two additional units (studio/1-bedroom configurations inferred from unit counts)
- Flooring: Laminated flooring
- Bathrooms: Two-bath unit (unit-level info); Three units with one full bathroom each (unit-level info)
- Heating & cooling: Wall heaters
- Interior features: Two-level layout; Entry located on level 1
- Laundry & utility: Laundry available outside
Neighborhood map
What this means for you Summary
Snapshot
- This is a 5-bed/5.0-bath multifamily listed at $799k.
Deal economics
- At list price, monthly cash flow is $830 ($10k/yr) — positive.
- The deal already cash-flows at list — no discount required.
- To meet the 1% rule (rent ≥ 1% of price), the offer needs to be $733k (8.2% below list).
- Recommended offer: $733k (8.2% below list) — sets the bar for 1% rule.
- Cap rate 7.5% vs local median 1.9% in Long Beach — top-decile yield for the area; either an underpriced asset or a hidden risk that comps aren't pricing in. Stress-test before assuming the spread holds.
Location & tenants
- Location reads 67/100 on livability (#319 in CA) — a middle-class / working-renter tenant base. Strengths: amenities A+, commute A+, employment B+; Watch: health & safety C-, crime F, cost of living F.
- Long Beach Unified (urban): math 34% / reading 50% proficiency, ranked #216 of 517 in CA (top 42%) — families likely to look elsewhere, expect single-tenant / working-renter base with shorter leases.
- Zoned schools: Roosevelt Elementary (math 21%, 841 students, 76% FRL); Franklin Classical Middle (math 22% / reading 32%, grade F, #242 of 498 statewide, top 50%, 1,095 students, 76% FRL); Polytechnic High (math 54% / reading 72%, grade B-, #184 of 1,170 statewide, top 16%, 3,952 students, 54% FRL).
- Market conditions: Rents soft (-0.3%/yr); 83 active listings in the ZIP; 5 comparable units currently listed for rent nearby; rentals at typical pace (median 14d on market — plan ~3-4 weeks tenant-placement turnaround); 19,697 units permitted in Los Angeles County in 2024 (9,426 in 5+ unit buildings).
- At $7,333/mo this rent would consume 161% of the median local household income ($55k/yr) (locally 4941% of renters already pay >50% of income on rent) — very limited rent-growth headroom before tenants either downsize or default.
Forward outlook
- Local home prices are declining (-3.0%/yr); year-one equity from $6k of loan paydown is wiped out by about $24k of value loss. Plan a longer hold.
- Los Angeles County population projected at +9% by 2050 — modest demand growth; plan on rents tracking national, not racing it.
Negotiation context
- It's been on market 49 days — a 3% lower offer ($775k) is reasonable based on typical stale-listing flexibility.
- 2 sale attempts since 13y ago with the ask held roughly flat each time — persistent listings suggest the price (not the market) is what's stuck; bring a comps-based counter.
- Current owner paid $17k; list at $799k implies a 4600% gain — meaningful room to come down on a strong offer.
Risks & watch-outs
- Watch-outs: built in 1923 — expect roof / HVAC / electrical / plumbing capex.
Questions for the listing agent
- It's been on market 49 days. Have you received any prior offers? Is the seller open to a 8% concession, seller financing, or rate buy-down credit?
- Built in 1923 — when were the roof, HVAC, electrical panel, plumbing, and water heater last replaced?
- Is there a deadline driving the sale (1031 exchange, divorce, estate, relocation)? That informs how much negotiation room exists.
- Crime grade is F in this area — have there been break-ins, vandalism, or insurance claims at this property in the last 3 years? What carrier currently insures it and at what premium?
- What's the average days-on-market for RENTAL listings here right now (not sales)? A rising rental-DOM trend means longer vacancies and softer asking-rent achievability than the comps imply.
- What's the recent tenant-quality profile in this submarket — average credit score on applications, eviction rate, late-payment / NSF rate, and stable-employment percentage? A property-management company in the area should have these aggregated.
- How much new apartment / multifamily construction is in the pipeline within 1–3 miles? Heavy new supply (>2% of stock underway) typically softens rents 12–24 months out; light construction supports rent growth.
Investment metrics
- 1% rule
- 0.92% ✗
- Cap rate
- 7.54%
- Cash-on-cash
- 4.45%
- DSCR
- 1.20
- GRM
- 9.1
CMA / ARV
- ARV (median comp)
- $900,895
- List price
- $799,000
- Delta
- -11.31%
- Verdict
- UNDERPRICED
- Comps
- 20 within 1.0 mi
Show comp detail 12 sales within ~0.75 mi
| Address | Dist | Beds/Ba | Sqft | Sold | Price | $/sf | Match |
|---|---|---|---|---|---|---|---|
| 1567-1567 Elm | 0.36mi | 5/2.0 | 2,070 (-4%) | 4mo | $725,000 | $350 | 62 |
| 416 Lime | 0.68mi | 4/3.0 (-1) | 2,204 (+3%) | 1mo | $1,025,000 | $465 | 50 |
| 920 Cerritos Ave | 0.52mi | 5/3.0 | 2,315 (+8%) | 6mo | $985,000 | $425 | 50 |
| 1069 Lime Ave | 0.14mi | 4/2.0 (-1) | 2,366 (+10%) | 12mo | $825,000 | $349 | 49 |
| 1435 Pine Ave | 0.44mi | 4/4.0 (-1) | 2,004 (-6%) | 16mo | $1,130,000 | $564 | 46 |
| 1239 N Loma Vista Dr | 0.67mi | 6/5.5 (+1) | 2,186 (+2%) | 16mo | $1,089,890 | $499 | 45 |
| 855 Chestnut Ave | 0.68mi | 5/3.0 | 2,248 (+5%) | 8mo | $760,000 | $338 | 45 |
| 1039 E 10th St | 0.40mi | 4/2.0 (-1) | 2,036 (-5%) | 14mo | $875,000 | $430 | 44 |
| 441 E 17th St | 0.45mi | 4/4.0 (-1) | 1,943 (-9%) | 13mo | $1,045,000 | $538 | 44 |
| 1354 Orange Ave | 0.57mi | 4/3.0 (-1) | 2,001 (-7%) | 13mo | $820,000 | $410 | 38 |
| 629 Olive Ave | 0.52mi | 4/4.0 (-1) | 1,824 (-15%) | 9mo | $1,050,000 | $576 | 35 |
| 1847 Myrtle Ave | 0.65mi | 4/3.0 (-1) | 2,050 (-4%) | 22mo | $940,000 | $459 | 31 |
Match score weights: distance 35% · size 25% · config 20% · recency 20%. Top-matched comps best support the ARV.
Projected returns pro-forma
-3.0% appreciation · 0.0% rent growth · sell at horizon
- IRR
- -12.5%
- Equity multiple
- 0.56×
- Total profit
- $-98,342
- Equity at exit
- $119,133
- IRR
- -8.3%
- Equity multiple
- 0.55×
- Total profit
- $-101,574
- Equity at exit
- $69,083
Cash invested: $223,720 (down + closing). Projections, not guarantees.
Landlord ↔ Tenant lean methodology
- Overall (STATE)
- 18 Strongly Tenant-Friendly
- State California
- 18 Strongly Tenant-Friendly · D+13
- County
- — inherits STATE
- City
- — inherits STATE
ZIP-level market 90813
- Rents YoY
- -0.3%
- Active inventory
- 83
- Price-to-rent
- 36.3×
Monthly cashflow live
- Estimated rent
- $7,333 high interval (Pro) →
- Mortgage (P&I)
- −$4,190
- Tax from tax record
- −$440 /mo · $5,283/yr
- Insurance
- −$333
- HOA
- −$0
- Vacancy / Maint / Mgmt
- −$1,540
- Net cashflow
- $830
Break-even live
Sensitivity live
| Price | -10% $1,282 | -5% $1,056 | +0% $830 | +5% $604 | +10% $378 |
|---|---|---|---|---|---|
| Rent | -10% $251 | -5% $540 | +0% $830 | +5% $1,119 | +10% $1,409 |
| Rate | -1.0pp $1,232 | -0.5pp $1,033 | base $830 | +0.5pp $623 | +1.0pp $412 |
4-unit breakdown (identical units grouped — click to expand)
| Units | Beds | Baths | Est. rent |
|---|---|---|---|
| 4× units | 2 | 1 | $7,332 |
| #1 | 2 | 1 | $1,833 |
| #2 | 2 | 1 | $1,833 |
| #3 | 2 | 1 | $1,833 |
| #4 | 2 | 1 | $1,833 |
| Total (4 units) | $7,333 | ||
UW: 25.0% down · 7.5% · 30yr · 1.5% tax · 5.0% vac · 8.0% maint · 8.0% mgmt
Financing live
Cash to close
- Down payment
- $199,750
- Closing costs
- $23,970
- Reserves months
- —
- Total cash needed
- —
Loan-product check · same deal, 3 products live
Conventional
25% down · 7.5% · 30yr
- Down + closing
- —
- Monthly P&I
- —
- Monthly cashflow
- —
- DSCR
- —
- Eligible?
- —
Personal DTI + credit; lowest rate.
DSCR
20% down · 8.5% · 30yr
- Down + closing
- —
- Monthly P&I
- —
- Monthly cashflow
- —
- DSCR
- —
- Eligible?
- —
No personal income docs; deal must DSCR.
Hard money
10% down · 12.0% · 12mo
- Down + closing
- —
- Monthly P&I
- —
- Monthly cashflow
- —
- DSCR
- —
- Eligible?
- —
Short-term bridge; refi at stabilization.
Rent comps 5 comps
| Address | Beds | Baths | Sqft | Rent | $/sqft | DOM | Units | Dist |
|---|---|---|---|---|---|---|---|---|
| 1489 Atlantic Ave Long Beach, CA | 5.0 | 3.5 | 1772 | $4,295 | $2.42 | 14d | 1 | 0.24mi |
| 435 Cerritos Ave Long Beach, CA | 4.0 | 3.0 | 1856 | $6,000 | $3.23 | 7d | 1 | 0.80mi |
| 1740 Rose Ave #1742 Long Beach, CA | 4.0 | 3.0 | 1700 | $3,595 | $2.11 | 26d | 1 | 1.05mi |
| 1957 San Francisco Ave Long Beach, CA | 5.0 | 2.0 | 2000 | $4,495 | $2.25 | 0d | 1 | 1.27mi |
| 2068 San Francisco Ave Long Beach, CA | 6.0 | 1.5 | 2022 | $3,725 | $1.84 | 26d | 1 | 1.33mi |
Listing history 20 events
-
2026-06-21days on market $799,000 Active 49 DOM
-
2026-06-18days on market $799,000 Active 46 DOM
-
2026-06-17days on market $799,000 Active 45 DOM
-
2026-06-16days on market $799,000 Active 44 DOM
-
2026-06-15days on market $799,000 Active 43 DOM
-
2026-06-13days on market $799,000 Active 41 DOM
-
2026-06-13days on market $799,000 Active 40 DOM
-
2026-06-09days on market $799,000 Active 37 DOM
-
2026-06-08days on market $799,000 Active 36 DOM
-
2026-06-07days on market $799,000 Active 35 DOM
-
2026-06-04days on market $799,000 Active 32 DOM
-
2026-06-03days on market $799,000 Active 31 DOM
-
2026-06-02days on market $799,000 Active 30 DOM
-
2026-06-01days on market $799,000 Active 29 DOM
-
2026-05-31days on market $799,000 Active 28 DOM
-
2026-05-03$799,000 Active 1901-char remark
-
2013-10-20historical
-
2013-05-08$480,000 Active
-
1990-08-22soldstatus $17,000
-
1986-12-09soldstatus $58,000
ⓘ Source: listings_history table (triggers on properties + properties_extension) + one-shot
backfill from property_details.listing_events for pre-trigger history.
Tax reassessment forecast CA · Resets to sale price
- Current annual tax
- $5,283 · $440/mo
- Projected year-2 tax
- $6,072 · $506/mo
- Expected delta
- +$789/yr (+$66/mo · 14.9%)
ⓘ Screening estimate from a state-policy table — verify with the county assessor before closing.
Climate risk First Street
- Flood 1/10 Low FEMA zone X (unshaded) · 0% chance over 30 yrs
- Wildfire 1/10 Low
- Heat 4/10 Moderate 7 d/yr ≥88°F today · 23 d/yr by 30 yrs out
- Wind 1/10 Low
- Air quality 6/10 Major 9 unhealthy d/yr today · 10 by 30 yrs out
Nearby sold comps map
Loading sold comps map…
Walkable amenities ~0.75 mi
Loading nearby amenities…
Taxation est. · year 1
- Rental income
- $87,996
- − Mortgage interest
- −$44,756
- − Property taxes
- −$5,283
- − Insurance
- −$3,995
- − Repairs & maintenance
- −$7,040
- − Management
- −$7,040
- − Depreciation
- −$23,244
- Taxable loss
- −$3,362
- Est. tax savings @ 24.0%
- +$807
- After-tax cash flow
- $10,765/yr
For passive investors: Depreciation is non-cash, so a rental often shows a tax loss while cash-flowing — sheltering income. Rental losses are passive: they offset passive income freely, and up to $25,000/yr can offset ordinary (W-2) income if you actively participate and your MAGI is under $100k (phasing out to $0 by $150k); unused losses carry forward. On sale, claimed depreciation is recaptured at up to 25%, and gains may owe capital-gains tax (a 1031 exchange can defer both). Figures are a year-1 estimate at your 24.0% rate — not tax advice; consult a CPA.
Schools (NCES district)
- District
- Long Beach Unified
- NCES district ID
- 0622500
- Math proficiency
- 34% ▼ -11.00%
- Reading proficiency
- 50% ▼ -4.00%
- Median HH income
- $56,092
- Composite
- 36.67/100
- National rank
- #4607
- State rank
- #216 of 517 in CA
Livability — Long Beach
- Score
- 67/100
- State rank
- #319
- US rank
- #10758
Category grades
Schools grade is shown separately in the Schools card above.
Census & demographics
- Census place
- Long Beach, CA
- County
- Los Angeles County · 9,444,647 people
- City population
- 466,088
- Metro
- Los Angeles-Long Beach-Anaheim, CA
- Population (ZIP)
- 51,241
- Household income
- $54,526
- Rent vs Own
- Severe rent burden
- 4941.0
Population outlook (Los Angeles County) Hauer SSP2
- Today (2025)
- 10,940,515 people
- By 2030
- 11,256,481 · +2.9%
- By 2040
- 11,729,929 · +7.2%
- By 2050
- 11,948,407 · +9.2%
- By 2075
- 11,818,114 · +8.0%
- By 2100
- 10,842,928 · -0.9%
Race, ethnicity, and origin ACS 2023
- Neighborhood character
- Diverse neighborhood (Simpson 0.55)
- Race & ethnicity
- Hispanic / Latino 64% Two or more races 13% Asian 12% Black 11% White 9% Native American 2%
- Hispanic origin (detail)
- Mexican 53%
- Common ancestry
- Lithuanian 1% Serbian 1%
- Foreign-born
- 36% · Canada, South Korea, Vietnam
- Languages at home
- 33% English-only · Spanish 56% Other Asian/Pacific 6% Tagalog/Filipino 1%
Political lean MEDSL · Los Angeles
- 2024 margin
- Solid D (+32.9) · D 64.8% · R 31.9% · Other 3.3%
- 2008→2024 swing
- -7.4pp toward R · 2008: 40.4pp · 2024: 32.9pp
- All cycles
- 2024: D+32.9 2020: D+44.2 2016: D+48.0 2012: D+40.0 2008: D+40.4
Not yet ingested
- Civics
- —
Market trends
- HPI YoY
- ▼ -468.88%
- Current HPI
- 480.8118
- Rent YoY
- ▼ -0.34%
- Metro
- Los Angeles-Long Beach-Anaheim, CA
- State GDP YoY
- ▲ 3.21%
- F500 in state
- 116
Industry mix (Fortune 500 HQ in CA)
| Industry | F500 HQs | Revenue |
|---|---|---|
| Technology | 27 | $1,492B |
|
||
| Financial Services | 3 | $174B |
|
||
| Retail | 3 | $44B |
|
||
| Insurance | 3 | $26B |
|
||
| Media / Entertainment | 2 | $115B |
|
||
| Pharmaceuticals / Biotech | 2 | $62B |
|
||
Price history
+1277.6% since first listed5 events — show timeline
- 2026-05-03 Listed $799,000 CRMLS
- 2013-10-20 Listing Removed — CRMLS
- 2013-05-08 Listed $480,000 CRMLS
- 1990-08-22 Sold (Public Records) $17,000 Public Records
- 1986-12-09 Sold (Public Records) $58,000 Public Records
Property tax history
+2.8%/yrLatest (2025): $5,283 · +4.7% YoY. Source: county tax records.
Cash-flow waterfall
monthlySold comps — $/sqft
last 12 mo · ≤1 miLoading sold comps…