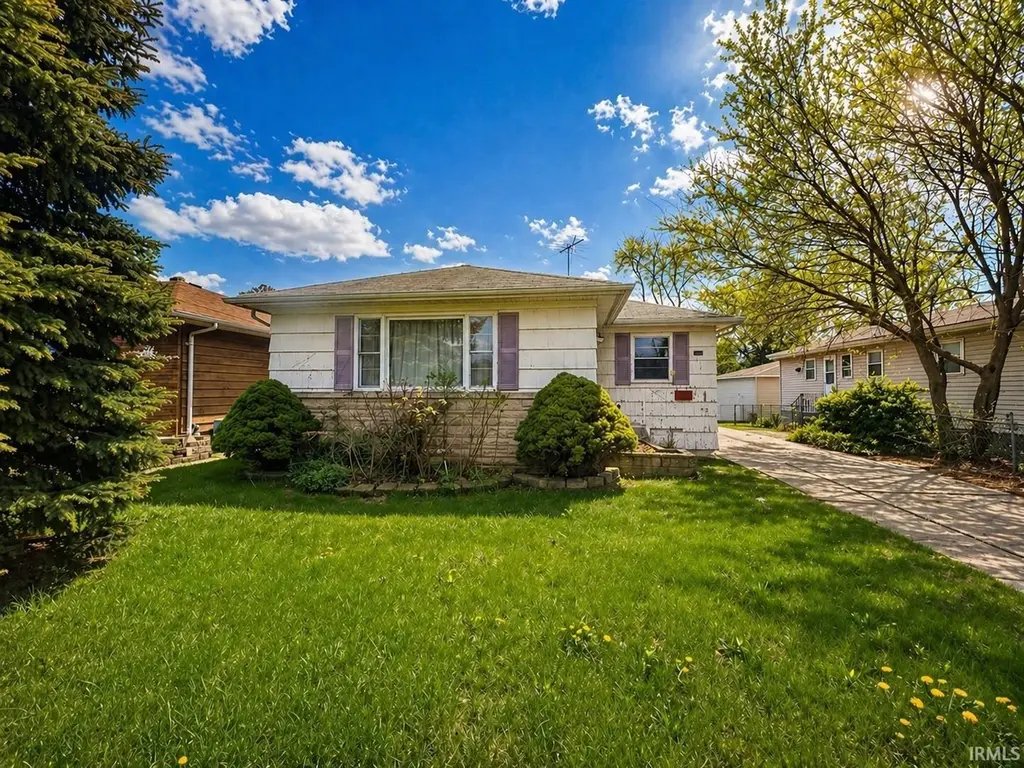
3036 173rd St · Hammond, IN
Flood risk 1/10 · Minimal
- FEMA flood zone
- X
- Chance of flooding over 30 yrs
- 0.0%
- Est. flood insurance / yr
- $473 – $860
Fire risk 1/10 · Minimal
- Est. fire insurance / yr
- $717 – $1,331
Heat risk 3/10 · Minor
- Hot days now (above 102°F)
- 7 days/yr
- Hot days in 30 yrs
- 15 days/yr
Wind risk 2/10 · Minimal
- Chance of severe wind over 30 yrs
- 1.0%
Air-quality risk 4/10 · Minor
- Unhealthy air days now
- 5 days/yr
- Unhealthy air days in 30 yrs
- 6 days/yr
Risk factors via First Street. Map © Google.
Why this score? — see what drove the C+ grade
The composite is a weighted blend of 9 inputs, each scored 0–100. Each bar is that input's sub-score; the figure is the points it added to the 100-point composite (weight × sub-score).
- Cash flow +24.8/30.0
- ARV discount +15.0/15.0
- DSCR +8.0/10.0
- 1% rule +5.8/10.0
- Livability +3.5/5.0
- Rent growth +2.5/5.0
- Condition / age +2.5/5.0
- Schools +1.1/10.0
- Appreciation +0.0/10.0
$154,900
🖨 Deal sheet 📄 Offer letter ✓ Due diligence
Listing remarks
This single family home in Hammond, Indiana offers 960 square feet of living space on a 0.1549-acre lot. Built in 1957, this one story property features 3 bedrooms and 1 bathroom. Buyers searching for a Hammond single-family home with garage, full basement, value-add opportunity, rental portfolio addition, rehab project, or buy-and-hold property should take a look. (as-is, handyman special, investor special)
Key facts
- 6,747 sq ft lot
- Garage
- Built 1957
Property features AI
Exterior
- Parking: Detached 1-car garage
- Utilities: Public water; Public sewer
- Home design: Single-family site-built home; One story
- Construction: Built with asphalt, brick and vinyl siding
- Exterior features: Level lot; Lot dimensions approximately 135 x 50
Interior
- Bathrooms: One full bathroom (main level)
- Heating & cooling: Natural gas forced-air heating; Central air conditioning
- Interior features: Finished full basement; Total of 6 rooms
- Laundry & utility: Laundry in basement
Neighborhood map
What this means for you Summary
Snapshot
- This is a 3-bed/1.0-bath single-family listed at $155k.
Deal economics
- At list price, monthly cash flow is $327 ($4k/yr) — positive.
- The deal already cash-flows at list — no discount required.
- Meets the 1% rule at list price ($2k rent vs $155k).
- Recommended offer: $150k (3.0% below list) — sets the bar for market timing.
- Cap rate 8.8% vs local median 5.8% in Hammond — top-decile yield for the area; either an underpriced asset or a hidden risk that comps aren't pricing in. Stress-test before assuming the spread holds.
Location & tenants
- Location reads 70/100 on livability (#143 in IN) — a middle-class / working-renter tenant base. Strengths: cost of living A+, housing A+, commute A; Watch: health & safety D+, employment D, crime F.
- School City Of Hammond (suburban): math 8% / reading 18% proficiency, ranked #289 of 301 in IN (top 96%) — low school quality limits family demand, transient renter base, plan for 1-2y turnover; 74% free/reduced lunch — lower-income household profile, screen leases tightly.
- Zoned schools: Joseph Hess Elementary School (math 10% / reading 16%, grade F, #885 of 994 statewide, top 89%, 688 students, 76% FRL); Charles N Scott Middle School (math 5% / reading 15%, grade F, #314 of 330 statewide, top 95%, 738 students, 75% FRL); Morton Senior High School (math 12% / reading 54%, grade F, #290 of 369 statewide, top 79%, 1,609 students, 69% FRL) — zoned schools at 73% FRL track the district average.
- Market conditions: 59 active listings in the ZIP; 6 comparable units currently listed for rent nearby; rentals leasing fast (median 6d on market — plan ~1-2 weeks tenant-placement turnaround); 1,642 units permitted in Lake County in 2024 (14 in 5+ unit buildings).
- This rent runs 34% of the median local income ($60k/yr) — at the standard rent-burdened threshold; future hikes will face affordability resistance.
Forward outlook
- Local home prices are declining (-3.0%/yr); year-one equity from $1k of loan paydown is wiped out by about $5k of value loss. Plan a longer hold.
- Lake County population projected to shrink 7% by 2050 — rents likely to lag national; underwrite the cash flow, not the appreciation.
Negotiation context
- It's been on market 52 days — a 3% lower offer ($150k) is reasonable based on typical stale-listing flexibility.
- 2 sale attempts since 27y ago; this cycle's ask has dropped $25k (14%) from the opening price — seller is motivated, your offer sets the floor, not the list.
Risks & watch-outs
- Watch-outs: built in 1957 — expect roof / HVAC / electrical / plumbing capex.
Questions for the listing agent
- It's been on market 52 days. Have you received any prior offers? Is the seller open to a 3% concession, seller financing, or rate buy-down credit?
- Built in 1957 — when were the roof, HVAC, electrical panel, plumbing, and water heater last replaced?
- Is there a deadline driving the sale (1031 exchange, divorce, estate, relocation)? That informs how much negotiation room exists.
- Schools are F-rated, which usually means shorter tenancies and higher turnover. Who's the typical renter profile here, and what's been the actual vacancy rate?
- Crime grade is F in this area — have there been break-ins, vandalism, or insurance claims at this property in the last 3 years? What carrier currently insures it and at what premium?
- What's the average days-on-market for RENTAL listings here right now (not sales)? A rising rental-DOM trend means longer vacancies and softer asking-rent achievability than the comps imply.
- What's the recent tenant-quality profile in this submarket — average credit score on applications, eviction rate, late-payment / NSF rate, and stable-employment percentage? A property-management company in the area should have these aggregated.
- How much new for-sale + rental construction is in the pipeline within 1–3 miles? Heavy new supply typically softens prices + rents 12–24 months out; constrained supply supports both.
Investment metrics
- 1% rule
- 1.08% ✓
- Cap rate
- 8.83%
- Cash-on-cash
- 9.06%
- DSCR
- 1.40
- GRM
- 7.7
CMA / ARV
- ARV (on-the-fly)
- $190,080
- Comps found
- 12
Show comp detail 12 sales within ~0.75 mi
| Address | Dist | Beds/Ba | Sqft | Sold | Price | $/sf | Match |
|---|---|---|---|---|---|---|---|
| 3339 176th Pl | 0.55mi | 3/1.0 | 954 (-1%) | 6mo | $170,400 | $179 | 68 |
| 7146 Parrish Ave | 0.22mi | 3/1.0 | 864 (-10%) | 8mo | $211,000 | $244 | 66 |
| 7134 Parrish Ave | 0.24mi | 3/1.0 | 864 (-10%) | 7mo | $150,000 | $174 | 66 |
| 3246 176th St | 0.45mi | 3/1.0 | 888 (-8%) | 2mo | $189,900 | $214 | 65 |
| 3244 176th Pl | 0.50mi | 3/1.0 | 900 (-6%) | 2mo | $180,000 | $200 | 64 |
| 7007 Marshall Ave | 0.55mi | 3/1.0 | 1,032 (+8%) | 1mo | $209,000 | $203 | 61 |
| 7416 Montana Ave | 0.61mi | 3/1.0 | 1,008 (+5%) | 6mo | $135,000 | $134 | 58 |
| 7415 Montana Ave | 0.64mi | 3/1.0 | 1,008 (+5%) | 5mo | $221,000 | $219 | 58 |
| 7411 Marshall Ave | 0.41mi | 2/1.0 (-1) | 865 (-10%) | 2mo | $171,000 | $198 | 58 |
| 7045 Alabama Ave | 0.39mi | 2/1.0 (-1) | 862 (-10%) | 8mo | $150,000 | $174 | 53 |
| 3311 175th Pl | 0.42mi | 3/1.0 | 1,102 (+15%) | 4mo | $85,000 | $77 | 52 |
| 6839 Arkansas Ave | 0.60mi | 2/1.0 (-1) | 850 (-12%) | 4mo | $159,000 | $187 | 44 |
Match score weights: distance 35% · size 25% · config 20% · recency 20%. Top-matched comps best support the ARV.
Projected returns pro-forma
-3.0% appreciation · 3.0% rent growth · sell at horizon
- IRR
- -2.6%
- Equity multiple
- 0.90×
- Total profit
- $-4,269
- Equity at exit
- $23,096
- IRR
- 7.1%
- Equity multiple
- 1.53×
- Total profit
- $23,045
- Equity at exit
- $13,393
Cash invested: $43,372 (down + closing). Projections, not guarantees.
Landlord ↔ Tenant lean methodology
- Overall (STATE)
- 90 Strongly Landlord-Friendly
- State Indiana
- 90 Strongly Landlord-Friendly · R+11
- County
- — inherits STATE
- City
- — inherits STATE
ZIP-level market 46323
- Home prices YoY
- -18.8%
- Active inventory
- 59
- Price-to-rent
- 7.7×
Monthly cashflow live
- Estimated rent
- $1,672 high interval (Pro) →
- Mortgage (P&I)
- −$812
- Tax from tax record
- −$117 /mo · $1,400/yr
- Insurance
- −$65
- HOA
- −$0
- Vacancy / Maint / Mgmt
- −$351
- Net cashflow
- $327
Break-even live
UW: 25.0% down · 7.5% · 30yr · 1.5% tax · 5.0% vac · 8.0% maint · 8.0% mgmt
Financing live
Cash to close
- Down payment
- $38,725
- Closing costs
- $4,647
- Reserves months
- —
- Total cash needed
- —
Loan-product check · same deal, 3 products live
Conventional
25% down · 7.5% · 30yr
- Down + closing
- —
- Monthly P&I
- —
- Monthly cashflow
- —
- DSCR
- —
- Eligible?
- —
Personal DTI + credit; lowest rate.
DSCR
20% down · 8.5% · 30yr
- Down + closing
- —
- Monthly P&I
- —
- Monthly cashflow
- —
- DSCR
- —
- Eligible?
- —
No personal income docs; deal must DSCR.
Hard money
10% down · 12.0% · 12mo
- Down + closing
- —
- Monthly P&I
- —
- Monthly cashflow
- —
- DSCR
- —
- Eligible?
- —
Short-term bridge; refi at stabilization.
Rent comps 6 comps
| Address | Beds | Baths | Sqft | Rent | $/sqft | DOM | Units | Dist |
|---|---|---|---|---|---|---|---|---|
| 7633 Kentucky Ave Hammond, IN | 3.0 | 1.0 | 888 | $1,595 | $1.80 | 10d | 1 | 0.62mi |
| 3607 Orchard Dr Hammond, IN | 1.0–2.0 | 1.0 | 839 | $1,539 | $1.83 | 1d | 6 | 0.83mi |
| 3611 167th St Hammond, IN | 1.0–2.0 | 1.0 | 695 | $1,450 | $2.09 | 1d | 1 | 1.03mi |
| 2723 E 165th St Unit 3 Hammond, IN | 2.0 | 1.0 | 800 | $1,350 | $1.69 | 6d | 1 | 1.09mi |
| 6746 Forestdale Ave Hammond, IN | 3.0 | 1.0 | 900 | $1,860 | $2.07 | 1d | 1 | 1.24mi |
| 6610 Rhode Island Ave Hammond, IN | 3.0 | 1.0 | 1025 | $1,600 | $1.56 | 7d | 1 | 1.33mi |
Listing history 24 events
-
2026-06-18price $154,900 Active 52 DOM
-
2026-06-18days on market $154,500 Active 52 DOM
-
2026-06-17days on market $154,500 Active 51 DOM
-
2026-06-16days on market $154,500 Active 50 DOM
-
2026-06-15price $154,500 Active 49 DOM
-
2026-06-15days on market $154,600 Active 49 DOM
-
2026-06-13pricedays on market $154,600 Active 47 DOM
-
2026-06-09days on market $155,600 Active 43 DOM
-
2026-06-08pricedays on market $155,600 Active 42 DOM
-
2026-06-07pricedays on market $156,600 Active 41 DOM
-
2026-06-04days on market $156,900 Active 38 DOM
-
2026-06-03days on market $156,900 Active 37 DOM
-
2026-06-02days on market $156,900 Active 36 DOM
-
2026-06-02price $156,900 Active 35 DOM
-
2026-06-01days on market $157,900 Active 35 DOM
-
2026-05-31days on market $157,900 Active 34 DOM
-
2026-05-22price $158,900
-
2026-05-15price $159,900
-
2026-05-11price $164,900
-
2026-05-06price $169,900
-
2026-04-29price $174,900
-
2026-04-27$179,900 Active
-
1999-05-21historical
-
1999-03-26$89,900
ⓘ Source: listings_history table (triggers on properties + properties_extension) + one-shot
backfill from property_details.listing_events for pre-trigger history.
Tax reassessment forecast IN · Partial reset (capped growth)
- Current annual tax
- $1,400 · $117/mo
- Projected year-2 tax
- $1,400 · $117/mo
- Expected delta
- $0/yr ($0/mo · 0.0%)
ⓘ Screening estimate from a state-policy table — verify with the county assessor before closing.
Climate risk First Street
- Flood 1/10 Low FEMA zone X · 0% chance over 30 yrs
- Wildfire 1/10 Low
- Heat 3/10 Moderate 7 d/yr ≥102°F today · 15 d/yr by 30 yrs out
- Wind 2/10 Low 100% chance of damaging wind over 30 yrs
- Air quality 4/10 Moderate 5 unhealthy d/yr today · 6 by 30 yrs out
Nearby sold comps map
Loading sold comps map…
Walkable amenities ~0.75 mi
Loading nearby amenities…
Taxation est. · year 1
- Rental income
- $20,065
- − Mortgage interest
- −$8,677
- − Property taxes
- −$1,400
- − Insurance
- −$774
- − Repairs & maintenance
- −$1,605
- − Management
- −$1,605
- − Depreciation
- −$4,506
- Taxable income
- $1,497
- Est. tax owed @ 24.0%
- −$359
- After-tax cash flow
- $3,570/yr
For passive investors: Depreciation is non-cash, so a rental often shows a tax loss while cash-flowing — sheltering income. Rental losses are passive: they offset passive income freely, and up to $25,000/yr can offset ordinary (W-2) income if you actively participate and your MAGI is under $100k (phasing out to $0 by $150k); unused losses carry forward. On sale, claimed depreciation is recaptured at up to 25%, and gains may owe capital-gains tax (a 1031 exchange can defer both). Figures are a year-1 estimate at your 24.0% rate — not tax advice; consult a CPA.
Schools (NCES district)
- District
- School City Of Hammond
- NCES district ID
- 1804320
- Math proficiency
- 8% ▼ -18.00%
- Reading proficiency
- 18% ▼ -15.00%
- Median HH income
- $39,970
- Composite
- 11.11/100
- National rank
- #9730
- State rank
- #289 of 301 in IN
Livability — Hammond
- Score
- 70/100
- State rank
- #143
- US rank
- #7343
Category grades
Schools grade is shown separately in the Schools card above.
Census & demographics
- Census place
- Hammond, IN
- County
- Lake County · 422,878 people
- City population
- 58,809
- Metro
- Chicago-Naperville-Elgin, IL-IN-WI
- Population (ZIP)
- 23,047
- Household income
- $59,688
- Rent vs Own
- Severe rent burden
- 692.0
Population outlook (Lake County) Hauer SSP2
- Today (2025)
- 484,026 people
- By 2030
- 478,091 · -1.2%
- By 2040
- 462,974 · -4.3%
- By 2050
- 449,894 · -7.1%
- By 2075
- 436,169 · -9.9%
- By 2100
- 426,607 · -11.9%
Race, ethnicity, and origin ACS 2023
- Neighborhood character
- Diverse neighborhood (Simpson 0.68)
- Race & ethnicity
- Hispanic / Latino 38% White 36% Black 21% Two or more races 12% Asian 2% Native American 1%
- Hispanic origin (detail)
- Mexican 29% Puerto Rican 7%
- Common ancestry
- Romanian 6% Italian 2% Lithuanian 1%
- Foreign-born
- 8% · Canada, China
- Languages at home
- 78% English-only · Spanish 19% Chinese 1%
Political lean MEDSL · Lake
- 2024 margin
- Lean D (+5.6) · D 52.1% · R 46.5% · Other 1.5%
- 2008→2024 swing
- -28.6pp toward R · 2008: 34.3pp · 2024: 5.6pp
- All cycles
- 2024: D+5.6 2020: D+15.1 2016: D+20.6 2012: D+31.0 2008: D+34.3
Not yet ingested
- Civics
- —
Market trends
- HPI YoY
- ▼ -67.70%
- Current HPI
- 293.4702
- Rent YoY
- —
- Metro
- Chicago-Naperville-Elgin, IL-IN-WI
- State GDP YoY
- ▲ 2.90%
- F500 in state
- 18
Industry mix (Fortune 500 HQ in IN)
| Industry | F500 HQs | Revenue |
|---|---|---|
| Industrial Machinery | 2 | $37B |
|
||
| Healthcare | 1 | $177B |
|
||
| Pharmaceuticals | 1 | $45B |
|
||
| Metals / Steel | 1 | $18B |
|
||
| Agriculture | 1 | $17B |
|
||
| Packaging | 1 | $12B |
|
||
Price history
+76.8% since first listed8 events — show timeline
- 2026-05-22 Price Changed $158,900 IRMLS
- 2026-05-15 Price Changed $159,900 IRMLS
- 2026-05-11 Price Changed $164,900 IRMLS
- 2026-05-06 Price Changed $169,900 IRMLS
- 2026-04-29 Price Changed $174,900 IRMLS
- 2026-04-27 Listed $179,900 IRMLS
- 1999-05-21 Listing Removed — NIRA MLS as Distributed by MLS Grid
- 1999-03-26 Listed $89,900 NIRA MLS as Distributed by MLS Grid
Property tax history
+7.7%/yrLatest (2024): $1,400 · -10.4% YoY. Source: county tax records.
Cash-flow waterfall
monthlySold comps — $/sqft
last 12 mo · ≤1 miLoading sold comps…