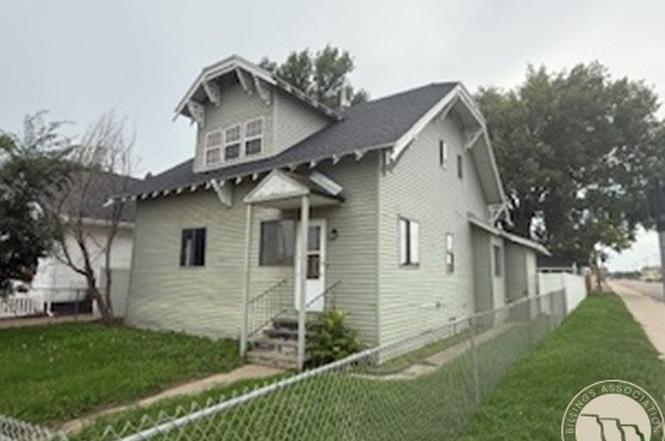
124 Lincoln Ave Ave NW · Sidney, MT
Flood risk 1/10 · Minimal
- FEMA flood zone
- X (unshaded)
- Chance of flooding over 30 yrs
- 0.0%
- Est. flood insurance / yr
- $473 – $860
Fire risk 3/10 · Minor
- Est. fire insurance / yr
- $918 – $1,706
Heat risk 3/10 · Minor
- Hot days now (above 98°F)
- 7 days/yr
- Hot days in 30 yrs
- 13 days/yr
Wind risk 1/10 · Minimal
- Chance of severe wind over 30 yrs
- —
Air-quality risk 3/10 · Minor
- Unhealthy air days now
- 2 days/yr
- Unhealthy air days in 30 yrs
- 2 days/yr
Risk factors via First Street. Map © Google.
Why this score? — see what drove the D+ grade
The composite is a weighted blend of 9 inputs, each scored 0–100. Each bar is that input's sub-score; the figure is the points it added to the 100-point composite (weight × sub-score).
- ARV discount +15.0/15.0
- Cash flow +12.2/30.0
- Livability +3.7/5.0
- DSCR +3.6/10.0
- Schools +3.6/10.0
- 1% rule +3.4/10.0
- Rent growth +2.5/5.0
- Condition / age +2.5/5.0
- Appreciation +0.0/10.0
$139,000
🖨 Deal sheet 📄 Offer letter ✓ Due diligence
Key facts
- Enclosed back porch
- Spacious kitchen
- Flexible bonus room
Tags
Property features AI
Exterior
- Parking: No on-site parking listed
- Utilities: Public water; Public sewer
- Home design: Single-family residence; Two-story
- Construction: Vinyl siding; Asphalt shingle roof; Crawl space foundation; Built area above grade: 2,356
- Exterior features: Fenced yard; Corner, level lot; Shed(s)
Interior
- Kitchen: Range; Electric range; Free-standing range; Oven; Microwave; Dishwasher; Refrigerator; Freezer
- Bedrooms: One main-level bedroom
- Bathrooms: Two full bathrooms (one on main level)
- Heating & cooling: Natural gas forced-air heating; No central cooling
- Interior features: Pantry; Fireplace (1)
- Laundry & utility: Washer; Dryer
Neighborhood map
What this means for you Summary
Snapshot
- This is a 2-bed/2.0-bath single-family listed at $139k.
Deal economics
- At list price, monthly cash flow is $-28 ($-340/yr) — negative.
- To cash-flow at today's rent, offer at most $134k (3.6% below list).
- To meet the 1% rule (rent ≥ 1% of price), the offer needs to be $117k (16.2% below list).
- Recommended offer: $117k (16.2% below list) — sets the bar for 1% rule.
Location & tenants
- Location reads 74/100 on livability (#37 in MT, #4,485 nationally) — a middle-class / working-renter tenant base. Strengths: cost of living A+, housing A+, health & safety A+; Watch: crime C-, amenities F, commute F.
- Sidney H S (town): math 35% / reading 40% proficiency, ranked #149 of 339 in MT (top 44%) — families likely to look elsewhere, expect single-tenant / working-renter base with shorter leases.
- Market conditions: 7 active listings in the ZIP.
Forward outlook
- Local home prices are declining (-3.0%/yr); year-one equity from $961 of loan paydown is wiped out by about $4k of value loss. Plan a longer hold.
- Richland County population projected at +93% by 2050 — long-run rental-demand tailwind backs the buy-and-hold thesis.
Negotiation context
- It's been on market 113 days — a 9% lower offer ($126k) is reasonable based on typical stale-listing flexibility.
- 3 sale attempts; this cycle's ask has dropped $25k (15%) from the opening price — seller is motivated, your offer sets the floor, not the list.
Risks & watch-outs
- Watch-outs: built in 1916 — expect roof / HVAC / electrical / plumbing capex.
Questions for the listing agent
- What do current leases actually rent for vs. the listed asking? Can we see a recent rent roll and the last 12 months of T-12 income?
- It's been on market 113 days. Have you received any prior offers? Is the seller open to a 16% concession, seller financing, or rate buy-down credit?
- Built in 1916 — when were the roof, HVAC, electrical panel, plumbing, and water heater last replaced?
- Why hasn't it sold? Are there any deal-killer items the seller is aware of (foundation, flood, title, zoning, code violations)?
- Is there a deadline driving the sale (1031 exchange, divorce, estate, relocation)? That informs how much negotiation room exists.
- The area grade is low — what's the realistic commute time and amenity access for the typical tenant pool here? Any planned neighborhood developments (good or bad) we should know about?
- What's the average days-on-market for RENTAL listings here right now (not sales)? A rising rental-DOM trend means longer vacancies and softer asking-rent achievability than the comps imply.
- What's the recent tenant-quality profile in this submarket — average credit score on applications, eviction rate, late-payment / NSF rate, and stable-employment percentage? A property-management company in the area should have these aggregated.
- How much new for-sale + rental construction is in the pipeline within 1–3 miles? Heavy new supply typically softens prices + rents 12–24 months out; constrained supply supports both.
Investment metrics
- 1% rule
- 0.84% ✗
- Cap rate
- 6.05%
- Cash-on-cash
- -0.87%
- DSCR
- 0.96
- GRM
- 9.9
CMA / ARV
- ARV (on-the-fly)
- $246,283
- Comps found
- 3
Show comp detail 3 sales within ~0.75 mi
| Address | Dist | Beds/Ba | Sqft | Sold | Price | $/sf | Match |
|---|---|---|---|---|---|---|---|
| 420 S Lincoln Ave S | 0.35mi | 3/2.0 (+1) | 2,456 (-3%) | 21mo | $238,000 | $97 | 56 |
| 625 8th Ave SW | 0.49mi | 3/1.0 (+1) | 2,184 (-14%) | 3mo | $178,000 | $82 | 43 |
| 406 6th St SE | 0.70mi | 2/1.5 | 2,232 (-12%) | 22mo | $269,000 | $121 | 27 |
Match score weights: distance 35% · size 25% · config 20% · recency 20%. Top-matched comps best support the ARV.
Projected returns pro-forma
-3.0% appreciation · 3.0% rent growth · sell at horizon
- IRR
- -17.7%
- Equity multiple
- 0.38×
- Total profit
- $-24,319
- Equity at exit
- $20,725
- IRR
- -9.8%
- Equity multiple
- 0.40×
- Total profit
- $-23,459
- Equity at exit
- $12,018
Cash invested: $38,920 (down + closing). Projections, not guarantees.
Landlord ↔ Tenant lean methodology
- Overall (STATE)
- 82 Strongly Landlord-Friendly
- State Montana
- 82 Strongly Landlord-Friendly · R+11
- County
- — inherits STATE
- City
- — inherits STATE
ZIP-level market 59270
- Active inventory
- 7
- Price-to-rent
- 9.9×
Monthly cashflow live
- Estimated rent
- $1,165 medium interval (Pro) →
- Mortgage (P&I)
- −$729
- Tax from tax record
- −$162 /mo · $1,942/yr
- Insurance
- −$58
- HOA
- −$0
- Vacancy / Maint / Mgmt
- −$245
- Net cashflow
- $-28
Break-even live
UW: 25.0% down · 7.5% · 30yr · 1.5% tax · 5.0% vac · 8.0% maint · 8.0% mgmt
Financing live
Cash to close
- Down payment
- $34,750
- Closing costs
- $4,170
- Reserves months
- —
- Total cash needed
- —
Loan-product check · same deal, 3 products live
Conventional
25% down · 7.5% · 30yr
- Down + closing
- —
- Monthly P&I
- —
- Monthly cashflow
- —
- DSCR
- —
- Eligible?
- —
Personal DTI + credit; lowest rate.
DSCR
20% down · 8.5% · 30yr
- Down + closing
- —
- Monthly P&I
- —
- Monthly cashflow
- —
- DSCR
- —
- Eligible?
- —
No personal income docs; deal must DSCR.
Hard money
10% down · 12.0% · 12mo
- Down + closing
- —
- Monthly P&I
- —
- Monthly cashflow
- —
- DSCR
- —
- Eligible?
- —
Short-term bridge; refi at stabilization.
Listing history 27 events
-
2026-06-18days on market $139,000 Active 113 DOM
-
2026-06-17days on market $139,000 Active 112 DOM
-
2026-06-16days on market $139,000 Active 111 DOM
-
2026-06-15days on market $139,000 Active 110 DOM
-
2026-06-14days on market $139,000 Active 108 DOM
-
2026-06-13days on market $139,000 Active 107 DOM
-
2026-06-10days on market $139,000 Active 105 DOM
-
2026-06-09days on market $139,000 Active 104 DOM
-
2026-06-08days on market $139,000 Active 103 DOM
-
2026-06-07days on market $139,000 Active 102 DOM
-
2026-06-05days on market $139,000 Active 99 DOM
-
2026-06-03days on market $139,000 Active 98 DOM
-
2026-06-03price $139,000 Active 97 DOM
-
2026-06-02days on market $149,000 Active 97 DOM
-
2026-06-01days on market $149,000 Active 96 DOM
-
2026-05-31days on market $149,000 Active 95 DOM
-
2026-05-31days on market $149,000 Active 94 DOM
-
2026-04-20price $149,000
-
2026-03-17price $154,000
-
2026-03-11status Active
-
2026-03-05historical
-
2026-02-18$164,000 Active
-
2025-06-25$179,900 Active
-
2024-10-31price $193,800
-
2024-10-17price $209,900
-
2024-09-11price $229,900
-
2007-05-22soldstatus
ⓘ Source: listings_history table (triggers on properties + properties_extension) + one-shot
backfill from property_details.listing_events for pre-trigger history.
Tax reassessment forecast MT · Resets to sale price
- Current annual tax
- $1,942 · $162/mo
- Projected year-2 tax
- $1,942 · $162/mo
- Expected delta
- $0/yr ($0/mo · 0.0%)
ⓘ Screening estimate from a state-policy table — verify with the county assessor before closing.
Climate risk First Street
- Flood 1/10 Low FEMA zone X (unshaded) · 0% chance over 30 yrs
- Wildfire 3/10 Moderate
- Heat 3/10 Moderate 7 d/yr ≥98°F today · 13 d/yr by 30 yrs out
- Wind 1/10 Low
- Air quality 3/10 Moderate 2 unhealthy d/yr today · 2 by 30 yrs out
Nearby sold comps map
Loading sold comps map…
Walkable amenities ~0.75 mi
Loading nearby amenities…
Taxation est. · year 1
- Rental income
- $13,980
- − Mortgage interest
- −$7,786
- − Property taxes
- −$1,942
- − Insurance
- −$695
- − Repairs & maintenance
- −$1,118
- − Management
- −$1,118
- − Depreciation
- −$4,044
- Taxable loss
- −$2,724
- Est. tax savings @ 24.0%
- +$654
- After-tax cash flow
- $314/yr
For passive investors: Depreciation is non-cash, so a rental often shows a tax loss while cash-flowing — sheltering income. Rental losses are passive: they offset passive income freely, and up to $25,000/yr can offset ordinary (W-2) income if you actively participate and your MAGI is under $100k (phasing out to $0 by $150k); unused losses carry forward. On sale, claimed depreciation is recaptured at up to 25%, and gains may owe capital-gains tax (a 1031 exchange can defer both). Figures are a year-1 estimate at your 24.0% rate — not tax advice; consult a CPA.
Schools (NCES district)
- District
- Sidney H S
- NCES district ID
- 3024230
- Math proficiency
- 35% ▲ 5.00%
- Reading proficiency
- 40% ▲ 5.00%
- Median HH income
- $60,761
- Composite
- 35.97/100
- National rank
- #9546
- State rank
- #149 of 339 in MT
Livability — Sidney
- Score
- 74/100
- State rank
- #37
- US rank
- #4485
Category grades
Schools grade is shown separately in the Schools card above.
Census & demographics
- Census place
- Sidney, MT
- County
- Richland County · 8,571 people
- City population
- 8,571
- Metro
- nan
- Population (ZIP)
- 8,571
- Household income
- $72,630
- Rent vs Own
- Severe rent burden
- 25.0
Population outlook (Richland County) Hauer SSP2
- Today (2025)
- 16,895 people
- By 2030
- 19,713 · +16.7%
- By 2040
- 25,884 · +53.2%
- By 2050
- 32,631 · +93.1%
- By 2075
- 50,915 · +201.4%
- By 2100
- 65,767 · +289.3%
Race, ethnicity, and origin ACS 2023
- Neighborhood character
- Predominantly White (86%)
- Race & ethnicity
- White 86% Hispanic / Latino 6% Two or more races 6% Pacific Islander 1%
- Hispanic origin (detail)
- Mexican 5%
- Common ancestry
- Portuguese 19% Slovak 3% Iranian 2%
- Foreign-born
- 3% · Canada
- Languages at home
- 97% English-only · Spanish 2% Other Asian/Pacific 1%
Political lean MEDSL · Richland
- 2024 margin
- Solid R (+68.0) · D 14.7% · R 82.6% · Other 2.7%
- 2008→2024 swing
- -24.1pp toward R · 2008: -43.9pp · 2024: -68.0pp
- All cycles
- 2024: R+68.0 2020: R+67.7 2016: R+66.8 2012: R+54.0 2008: R+43.9
Not yet ingested
- Civics
- —
Market trends
- HPI YoY
- ▼ -149.09%
- Current HPI
- 118.0931
- Rent YoY
- —
- Metro
- nan
- State GDP YoY
- ▲ 3.41%
- F500 in state
- 2
Industry mix (Fortune 500 HQ in MT)
| Industry | F500 HQs | Revenue |
|---|---|---|
| Technology / Analytics | 1 | $2B |
|
||
Price history
-35.2% since first listed10 events — show timeline
- 2026-04-20 Price Changed $149,000 BMTMLS
- 2026-03-17 Price Changed $154,000 BMTMLS
- 2026-03-11 Relisted — BMTMLS
- 2026-03-05 Delisted — BMTMLS
- 2026-02-18 Listed $164,000 BMTMLS
- 2025-06-25 Listed $179,900 BMTMLS
- 2024-10-31 Price Changed $193,800 BMTMLS
- 2024-10-17 Price Changed $209,900 BMTMLS
- 2024-09-11 Price Changed $229,900 BMTMLS
- 2007-05-22 Sold (Public Records) — Public Records
Property tax history
+10.0%/yrLatest (2025): $1,942 · -35.8% YoY. Source: county tax records.
Cash-flow waterfall
monthlySold comps — $/sqft
last 12 mo · ≤1 miLoading sold comps…