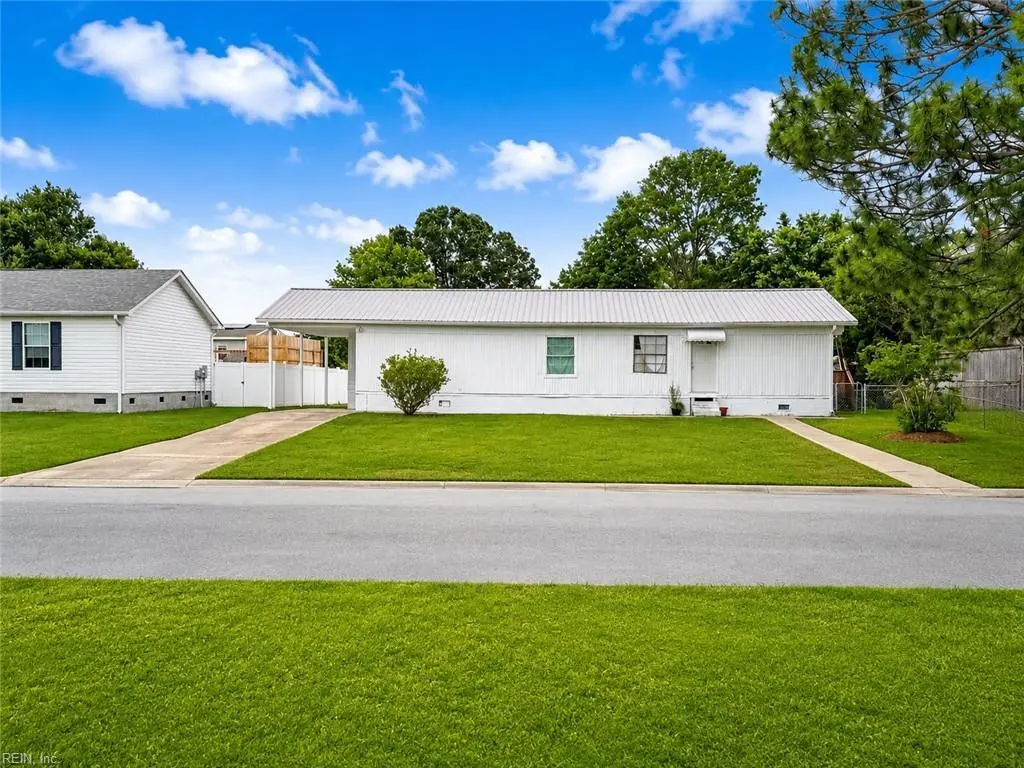
2924 Finch Ave · Virginia Beach, VA
Flood risk 3/10 · Minor
- FEMA flood zone
- X (unshaded)
- Chance of flooding over 30 yrs
- 0.1%
- Est. flood insurance / yr
- $507 – $1,088
Fire risk 2/10 · Minimal
- Est. fire insurance / yr
- $666 – $1,236
Heat risk 9/10 · Severe
- Hot days now (above 105°F)
- 7 days/yr
- Hot days in 30 yrs
- 17 days/yr
Wind risk 8/10 · Major
- Chance of severe wind over 30 yrs
- 99.0%
Air-quality risk 3/10 · Minor
- Unhealthy air days now
- 2 days/yr
- Unhealthy air days in 30 yrs
- 4 days/yr
Risk factors via First Street. Map © Google.
Why this score? — see what drove the B grade
The composite is a weighted blend of 9 inputs, each scored 0–100. Each bar is that input's sub-score; the figure is the points it added to the 100-point composite (weight × sub-score).
- Cash flow +26.1/30.0
- ARV discount +15.0/15.0
- DSCR +8.8/10.0
- 1% rule +6.5/10.0
- Schools +6.4/10.0
- Rent growth +4.9/5.0
- Livability +4.2/5.0
- Condition / age +2.5/5.0
- Appreciation +0.0/10.0
$199,999
🖨 Deal sheet 📄 Offer letter ✓ Due diligence
Listing remarks
Opportunity awaits in Cardinal Estates! This 4-bedroom, 2-bath home offers a spacious layout with an open living area and a large fenced backyard ready for your vision. Whether you are looking for your next renovation project, investment property, or chance to build sweat equity, this property has strong upside potential and the bones for a solid “diamond in the rough. ” Property sold strictly as-is, where-is. Buyer to perform all due diligence regarding condition, permits, and improvements.
Key facts
- Open living area
- 7,840 sq ft lot
- Built 1975
Tags
Property features AI
Finance
- HOA & community: No HOA fees
Exterior
- Parking: Carport; Driveway parking; Street parking
- Utilities: City/County water; City/County sewer; Electric water heater
- Home design: Detached property; Manufactured / Mobile / Modular style; 1 story; Single living level; Crawl foundation
- Construction: Metal and vinyl roof
- Exterior features: Aluminum and vinyl siding; Back fenced
Interior
- Kitchen: Kitchen
- Bedrooms: Master bedroom; Additional bedroom; Bedroom and full bathroom on 1st floor
- Bathrooms: 2 full bathrooms
- Heating & cooling: Central air conditioning; Forced hot air heating
- Interior features: Fixer upper; City view
- Laundry & utility: Washer hookup; Dryer hookup; Utility room
Neighborhood map
What this means for you Summary
Snapshot
- This is a 4-bed/2.0-bath single-family listed at $200k.
Deal economics
- At list price, monthly cash flow is $507 ($6k/yr) — positive.
- The deal already cash-flows at list — no discount required.
- Meets the 1% rule at list price ($2k rent vs $200k).
- Recommended offer: $194k (3.0% below list) — sets the bar for market timing.
- Cap rate 9.3% vs local median 3.5% in Virginia Beach — top-decile yield for the area; either an underpriced asset or a hidden risk that comps aren't pricing in. Stress-test before assuming the spread holds.
Location & tenants
- Location reads 83/100 on livability (#38 in VA, #880 nationally) — a professional / high-income tenant draw. Strengths: amenities A+, employment A+, housing A+; Watch: cost of living C-, commute F.
- Va Beach City Public School District (urban): math 69% / reading 78% proficiency, ranked #10 of 131 in VA (top 8%) — strong family-tenant draw, lease renewals of 3-5y typical.
- Zoned schools: Christopher Farms Elementary (math 70% / reading 78%, grade A, #248 of 1,108 statewide, top 23%, 632 students, 33% FRL); Landstown High (math 67% / reading 86%, grade A-, #99 of 319 statewide, top 31%, 2,226 students, 38% FRL).
- Market conditions: Rents rising fast (+9.7%/yr); 99 active listings in the ZIP; 17 comparable units currently listed for rent nearby; rentals at typical pace (median 21d on market — plan ~3-4 weeks tenant-placement turnaround); solid renter incomes; 666 units permitted in Virginia Beach city in 2024 (347 in 5+ unit buildings).
Forward outlook
- Local home prices are declining (-3.0%/yr); year-one equity from $1k of loan paydown is wiped out by about $6k of value loss. Plan a longer hold.
- Virginia Beach County population projected at +6% by 2050 — modest demand growth; plan on rents tracking national, not racing it.
- At projected returns (-3.0% appreciation + 8.0% rent growth), your $56k cash investment doubles in ~7 years — after that, you're playing with house money.
Negotiation context
- It's been on market 35 days — a 3% lower offer ($194k) is reasonable based on typical stale-listing flexibility.
Risks & watch-outs
- Climate carrying-cost: severe wind risk, 99% chance of damaging wind over 30y; extreme-heat days projected 7→17/yr by 2055 (HVAC capex compounding) — expect insurance premiums to compound above CPI over the hold.
Questions for the listing agent
- It's been on market 35 days. Have you received any prior offers? Is the seller open to a 3% concession, seller financing, or rate buy-down credit?
- Built in 1975 — when were the roof, HVAC, electrical panel, plumbing, and water heater last replaced?
- Is there a deadline driving the sale (1031 exchange, divorce, estate, relocation)? That informs how much negotiation room exists.
- Schools are A-rated — typically a magnet for longer-tenancy family renters. What's the average tenant stay here, and is there a school-zone premium baked into asking?
- What's the average days-on-market for RENTAL listings here right now (not sales)? A rising rental-DOM trend means longer vacancies and softer asking-rent achievability than the comps imply.
- What's the recent tenant-quality profile in this submarket — average credit score on applications, eviction rate, late-payment / NSF rate, and stable-employment percentage? A property-management company in the area should have these aggregated.
- How much new for-sale + rental construction is in the pipeline within 1–3 miles? Heavy new supply typically softens prices + rents 12–24 months out; constrained supply supports both.
Investment metrics
- 1% rule
- 1.15% ✓
- Cap rate
- 9.34%
- Cash-on-cash
- 10.87%
- DSCR
- 1.48
- GRM
- 7.2
CMA / ARV
- ARV (on-the-fly)
- $360,594
- Comps found
- 8
Show comp detail 8 sales within ~0.75 mi
| Address | Dist | Beds/Ba | Sqft | Sold | Price | $/sf | Match |
|---|---|---|---|---|---|---|---|
| 1224 Blue Jay Dr | 0.28mi | 4/2.0 | 1,500 (-3%) | 11mo | $335,000 | $223 | 73 |
| 1205 Mondrian Loop | 0.31mi | 4/2.5 | 1,750 (+14%) | 1mo | $410,000 | $234 | 60 |
| 1288 New Land Dr | 0.58mi | 4/1.5 | 1,600 (+4%) | 6mo | $315,000 | $197 | 60 |
| 2971 Delaware Xing | 0.47mi | 4/2.0 | 1,441 (-6%) | 12mo | $325,000 | $226 | 57 |
| 1136 Van Loen Dr | 0.36mi | 4/2.5 | 1,717 (+11%) | 12mo | $405,000 | $236 | 52 |
| 1271 New Land Dr | 0.48mi | 3/2.0 (-1) | 1,441 (-6%) | 12mo | $332,000 | $230 | 52 |
| 3253 Creekside Dr | 0.69mi | 3/2.0 (-1) | 1,440 (-7%) | 15mo | $345,000 | $240 | 40 |
| 2932 Fetsch Pl | 0.66mi | 3/2.0 (-1) | 1,317 (-14%) | 3mo | $336,000 | $255 | 38 |
Match score weights: distance 35% · size 25% · config 20% · recency 20%. Top-matched comps best support the ARV.
Projected returns pro-forma
-3.0% appreciation · 8.0% rent growth · sell at horizon
- IRR
- 5.3%
- Equity multiple
- 1.21×
- Total profit
- $12,031
- Equity at exit
- $29,821
- IRR
- 18.7%
- Equity multiple
- 2.92×
- Total profit
- $107,339
- Equity at exit
- $17,292
Cash invested: $56,000 (down + closing). Projections, not guarantees.
Landlord ↔ Tenant lean methodology
- Overall (STATE)
- 55 Moderately Landlord-Leaning
- State Virginia
- 55 Moderately Landlord-Leaning · D+2
- County
- — inherits STATE
- City
- — inherits STATE
ZIP-level market 23453
- Home prices YoY
- -13.4%
- Rents YoY
- 9.7%
- Active inventory
- 99
- Price-to-rent
- 7.2×
Monthly cashflow live
- Estimated rent
- $2,300 high interval (Pro) →
- Mortgage (P&I)
- −$1,049
- Tax from tax record
- −$178 /mo · $2,131/yr
- Insurance
- −$83
- HOA
- −$0
- Vacancy / Maint / Mgmt
- −$483
- Net cashflow
- $507
Break-even live
UW: 25.0% down · 7.5% · 30yr · 1.5% tax · 5.0% vac · 8.0% maint · 8.0% mgmt
Financing live
Cash to close
- Down payment
- $50,000
- Closing costs
- $6,000
- Reserves months
- —
- Total cash needed
- —
Loan-product check · same deal, 3 products live
Conventional
25% down · 7.5% · 30yr
- Down + closing
- —
- Monthly P&I
- —
- Monthly cashflow
- —
- DSCR
- —
- Eligible?
- —
Personal DTI + credit; lowest rate.
DSCR
20% down · 8.5% · 30yr
- Down + closing
- —
- Monthly P&I
- —
- Monthly cashflow
- —
- DSCR
- —
- Eligible?
- —
No personal income docs; deal must DSCR.
Hard money
10% down · 12.0% · 12mo
- Down + closing
- —
- Monthly P&I
- —
- Monthly cashflow
- —
- DSCR
- —
- Eligible?
- —
Short-term bridge; refi at stabilization.
Rent comps 17 comps
| Address | Beds | Baths | Sqft | Rent | $/sqft | DOM | Units | Dist |
|---|---|---|---|---|---|---|---|---|
| 3432 Pasture Ln Virginia Beach, VA | 4.0 | 2.5 | 2140 | $2,700 | $1.26 | 23d | 1 | 0.54mi |
| 1240 White Birch Ln Virginia Beach, VA | 3.0 | 1.5 | 1254 | $1,950 | $1.56 | 17d | 1 | 0.56mi |
| 1232 White Birch Ln Virginia Beach, VA | 3.0 | 2.0 | 1254 | $2,095 | $1.67 | 23d | 1 | 0.56mi |
| 3304 Weeping Willow Ln Virginia Beach, VA | 3.0 | 1.5 | 1254 | $1,750 | $1.40 | 23d | 1 | 0.67mi |
| 932 Gossman Dr Virginia Beach, VA | 3.0 | 1.5 | 1430 | $2,300 | $1.61 | 21d | 1 | 0.89mi |
| 2925 Theodorus Ct Virginia Beach, VA | 3.0 | 1.5 | 1120 | $2,000 | $1.79 | 4d | 1 | 1.01mi |
| 2908 Peppercorn Ct Virginia Beach, VA | 4.0 | 1.5 | 1381 | $2,295 | $1.66 | 23d | 1 | 1.04mi |
| 3517 Plum Cres Virginia Beach, VA | 3.0 | 2.0 | 1450 | $2,200 | $1.52 | 12d | 1 | 1.05mi |
| 1434 Peony Arch Virginia Beach, VA | 3.0 | 2.0 | 1407 | $2,600 | $1.85 | 23d | 1 | 1.10mi |
| 1856 Abbotsbury Way Virginia Beach, VA | 3.0 | 2.5 | 1609 | $2,350 | $1.46 | 17d | 1 | 1.16mi |
| 3521 Sierra Arch Virginia Beach, VA | 3.0 | 1.5 | 1420 | $1,650 | $1.16 | 23d | 1 | 1.27mi |
| 3504 Shawn Ct Virginia Beach, VA | 4.0 | 2.5 | 1669 | $2,650 | $1.59 | 23d | 1 | 1.30mi |
| 3480 Landstown Ct Virginia Beach, VA | 3.0 | 2.0 | 1359 | $2,495 | $1.84 | 17d | 1 | 1.39mi |
| 1404 Wendfield Dr Virginia Beach, VA | 3.0 | 1.5 | 1344 | $2,000 | $1.49 | 3d | 1 | 1.39mi |
| 1404 Wendfield Dr #102 Virginia Beach, VA | 3.0 | 1.5 | 1344 | $2,000 | $1.49 | 4d | 1 | 1.39mi |
| 1404 Wendfield Dr #102 Virginia Beach, VA | 3.0 | 1.5 | 1344 | $2,000 | $1.49 | 23d | 1 | 1.39mi |
| 1401 Wendfield Dr #103 Virginia Beach, VA | 3.0 | 1.5 | 1344 | $1,850 | $1.38 | 20d | 1 | 1.45mi |
Listing history 14 events
-
2026-06-18days on market $199,999 Active 35 DOM
-
2026-06-18price $199,999 Active 34 DOM
-
2026-06-17days on market $219,900 Active 34 DOM
-
2026-06-16days on market $219,900 Active 33 DOM
-
2026-06-15days on market $219,900 Active 32 DOM
-
2026-06-13days on market $219,900 Active 30 DOM
-
2026-06-09days on market $219,900 Active 26 DOM
-
2026-06-08days on market $219,900 Active 25 DOM
-
2026-06-07days on market $219,900 Active 24 DOM
-
2026-06-03days on market $219,900 Active 20 DOM
-
2026-06-02days on market $219,900 Active 19 DOM
-
2026-06-01days on market $219,900 Active 18 DOM
-
2026-05-31days on market $219,900 Active 17 DOM
-
2026-05-14$219,900 Active
ⓘ Source: listings_history table (triggers on properties + properties_extension) + one-shot
backfill from property_details.listing_events for pre-trigger history.
Tax reassessment forecast VA · Resets to sale price
- Current annual tax
- $2,131 · $178/mo
- Projected year-2 tax
- $2,131 · $178/mo
- Expected delta
- $0/yr ($0/mo · 0.0%)
ⓘ Screening estimate from a state-policy table — verify with the county assessor before closing.
Climate risk First Street
- Flood 3/10 Moderate FEMA zone X (unshaded) · 10% chance over 30 yrs
- Wildfire 2/10 Low
- Heat 9/10 Extreme 7 d/yr ≥105°F today · 17 d/yr by 30 yrs out
- Wind 8/10 Severe 99% chance of damaging wind over 30 yrs
- Air quality 3/10 Moderate 2 unhealthy d/yr today · 4 by 30 yrs out
Nearby sold comps map
Loading sold comps map…
Walkable amenities ~0.75 mi
Loading nearby amenities…
Taxation est. · year 1
- Rental income
- $27,597
- − Mortgage interest
- −$11,203
- − Property taxes
- −$2,131
- − Insurance
- −$1,000
- − Repairs & maintenance
- −$2,208
- − Management
- −$2,208
- − Depreciation
- −$5,818
- Taxable income
- $3,029
- Est. tax owed @ 24.0%
- −$727
- After-tax cash flow
- $5,358/yr
For passive investors: Depreciation is non-cash, so a rental often shows a tax loss while cash-flowing — sheltering income. Rental losses are passive: they offset passive income freely, and up to $25,000/yr can offset ordinary (W-2) income if you actively participate and your MAGI is under $100k (phasing out to $0 by $150k); unused losses carry forward. On sale, claimed depreciation is recaptured at up to 25%, and gains may owe capital-gains tax (a 1031 exchange can defer both). Figures are a year-1 estimate at your 24.0% rate — not tax advice; consult a CPA.
Schools (NCES district)
- District
- Va Beach City Public School District
- NCES district ID
- 5103840
- Math proficiency
- 69% ▼ -19.00%
- Reading proficiency
- 78% ▼ -7.00%
- Median HH income
- $66,452
- Composite
- 63.81/100
- National rank
- #594
- State rank
- #10 of 131 in VA
Livability — Virginia Beach
- Score
- 83/100
- State rank
- #38
- US rank
- #880
Category grades
Schools grade is shown separately in the Schools card above.
Census & demographics
- Census place
- Virginia Beach, VA
- County
- Virginia Beach City · 448,227 people
- City population
- 448,227
- Metro
- Virginia Beach-Norfolk-Newport News, VA-NC
- Population (ZIP)
- 34,482
- Household income
- $93,838
- Rent vs Own
- Severe rent burden
- 799.0
Population outlook (Virginia Beach County) Hauer SSP2
- Today (2025)
- 480,401 people
- By 2030
- 491,221 · +2.3%
- By 2040
- 504,882 · +5.1%
- By 2050
- 508,847 · +5.9%
- By 2075
- 504,831 · +5.1%
- By 2100
- 465,867 · -3.0%
Race, ethnicity, and origin ACS 2023
- Neighborhood character
- Highly diverse neighborhood (Simpson 0.72)
- Race & ethnicity
- White 46% Black 22% Two or more races 14% Asian 12% Hispanic / Latino 10%
- Hispanic origin (detail)
- Mexican 2% Puerto Rican 3%
- Common ancestry
- Slovak 2% Romanian 2% Italian 1%
- Foreign-born
- 11% · Canada, China, Vietnam
- Languages at home
- 84% English-only · Tagalog/Filipino 6% Spanish 5% Other Indo-European 1%
Political lean MEDSL · Virginia Beach
- 2024 margin
- Toss-up / Even · D 50.7% · R 48.0% · Other 1.3%
- 2008→2024 swing
- +3.4pp toward D · 2008: -0.7pp · 2024: 2.6pp
- All cycles
- 2024: D+2.6 2020: D+5.4 2016: R+4.5 2012: R+2.5 2008: R+0.7
Not yet ingested
- Civics
- —
Market trends
- HPI YoY
- ▼ -52.96%
- Current HPI
- 341.8757
- Rent YoY
- ▲ 9.69%
- Metro
- Virginia Beach-Norfolk-Newport News, VA-NC
- State GDP YoY
- ▲ 2.40%
- F500 in state
- 50
Industry mix (Fortune 500 HQ in VA)
| Industry | F500 HQs | Revenue |
|---|---|---|
| Aerospace / Defense | 4 | $236B |
|
||
| Technology / Defense | 3 | $32B |
|
||
| Financial Services | 2 | $176B |
|
||
| Utilities | 2 | $27B |
|
||
| Insurance | 2 | $25B |
|
||
| Technology | 2 | $15B |
|
||
Price history
1 event — show timeline
- 2026-05-14 Listed $219,900 REINMLS
Property tax history
+7.7%/yrLatest (2025): $2,131 · +11.0% YoY. Source: county tax records.
Cash-flow waterfall
monthlySold comps — $/sqft
last 12 mo · ≤1 miLoading sold comps…