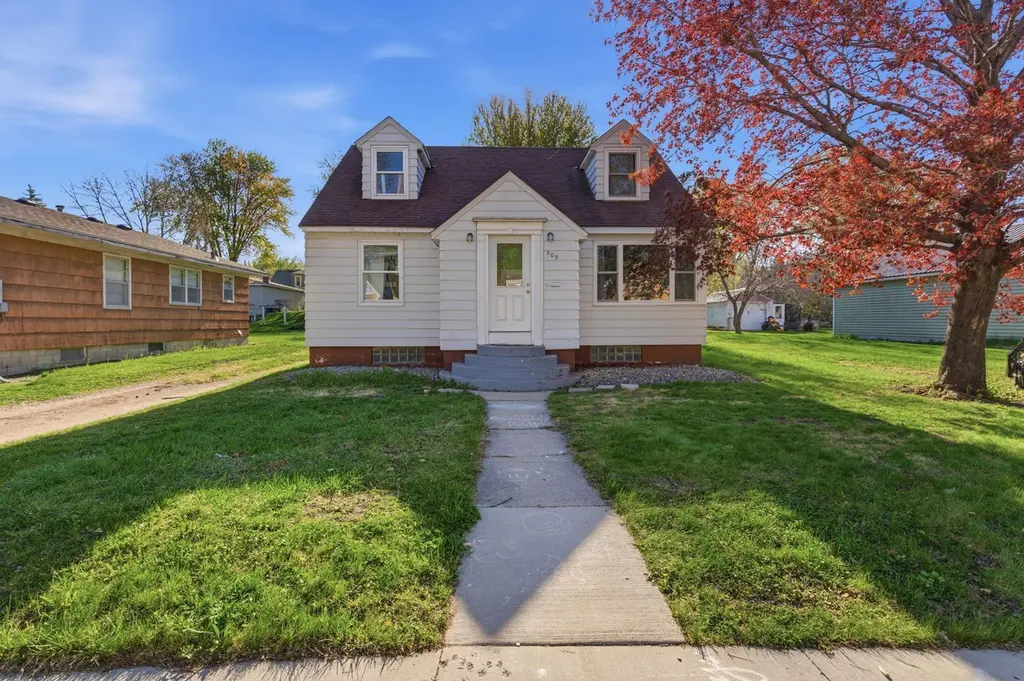
509 Charlotte St SE · Willmar, MN
Flood risk 1/10 · Minimal
- FEMA flood zone
- X (unshaded)
- Chance of flooding over 30 yrs
- 0.0%
- Est. flood insurance / yr
- $473 – $860
Fire risk 2/10 · Minimal
- Est. fire insurance / yr
- $888 – $1,650
Heat risk 2/10 · Minimal
- Hot days now (above 98°F)
- 7 days/yr
- Hot days in 30 yrs
- 14 days/yr
Wind risk 2/10 · Minimal
- Chance of severe wind over 30 yrs
- —
Air-quality risk 2/10 · Minimal
- Unhealthy air days now
- 2 days/yr
- Unhealthy air days in 30 yrs
- 2 days/yr
Risk factors via First Street. Map © Google.
Why this score? — see what drove the D grade
The composite is a weighted blend of 9 inputs, each scored 0–100. Each bar is that input's sub-score; the figure is the points it added to the 100-point composite (weight × sub-score).
- Cash flow +15.3/30.0
- ARV discount +6.4/15.0
- DSCR +4.7/10.0
- 1% rule +4.4/10.0
- Livability +3.7/5.0
- Schools +3.1/10.0
- Rent growth +2.5/5.0
- Condition / age +2.5/5.0
- Appreciation +0.0/10.0
$150,000
🖨 Deal sheet 📄 Offer letter ✓ Due diligence
Listing remarks MLS
Great property for the price. This home has newer windows, roof and steel siding. 3 bedrooms, 2 bath home. This home has great potential.
Key facts
- Steel siding
- Newer roof
- Large yard
Tags
Property features AI
Finance
- Other: Above-grade finished area approximately 1,256; Below-grade area approximately 860; Main level finished area approximately 896; Foundation area listed as 780
Exterior
- Parking: Attached garage with 1 stall (approx. 14x22)
- Utilities: City water connected; City sewer connected; Natural gas
- Home design: Residential property; One and one-half levels; Main entry facing city street
- Construction: Block foundation (approx. 26x30 foundation dimensions); Block basement with daylight/lookout windows, full height and sump pump; Asphalt roof; Building total area approximately 2,146 sq ft
- Exterior features: Rear porch; Lot approximately 75x150 with city street frontage
Interior
- Kitchen: Kitchen with window; Range; Microwave; Refrigerator
- Bedrooms: 4 bedrooms (two on main level; two on upper level); Bedroom sizes include 12x12, 10x11, 13x16, 12x16
- Flooring: Hardwood floors
- Bathrooms: One full bathroom on the main floor (approx. 5x6)
- Heating & cooling: Forced air heating; Window unit(s) for cooling
- Interior features: Hardwood floors; Main floor primary bedroom; All living facilities on one level; Main floor bedroom; Main floor laundry; Informal dining / living-dining room
- Laundry & utility: Washer and dryer hookups in kitchen / main level laundry; Washer; Dryer
Neighborhood map
What this means for you Summary
Snapshot
- This is a 4-bed/1.0-bath single-family listed at $150k.
Deal economics
- At list price, monthly cash flow is $55 ($655/yr) — positive.
- The deal already cash-flows at list — no discount required.
- To meet the 1% rule (rent ≥ 1% of price), the offer needs to be $140k (6.5% below list).
- Recommended offer: $140k (6.5% below list) — sets the bar for 1% rule.
- Cap rate 6.7% vs local median 3.2% in Willmar — top-decile yield for the area; either an underpriced asset or a hidden risk that comps aren't pricing in. Stress-test before assuming the spread holds.
Location & tenants
- Location reads 73/100 on livability (#233 in MN, #4,984 nationally) — a middle-class / working-renter tenant base. Strengths: cost of living A+, housing A+, health & safety A+; Watch: employment C-, schools D+, crime D+.
- Willmar Public School District (town): math 34% / reading 38% proficiency, ranked #246 of 301 in MN (top 82%) — families likely to look elsewhere, expect single-tenant / working-renter base with shorter leases.
- Market conditions: 161 active listings in the ZIP; 196 units permitted in Kandiyohi County in 2024 (118 in 5+ unit buildings).
Forward outlook
- Local home prices are declining (-3.0%/yr); year-one equity from $1k of loan paydown is wiped out by about $4k of value loss. Plan a longer hold.
Negotiation context
- It's been on market 35 days — a 3% lower offer ($146k) is reasonable based on typical stale-listing flexibility.
- 2 sale attempts since 5y ago with the ask held roughly flat each time — persistent listings suggest the price (not the market) is what's stuck; bring a comps-based counter.
- Current owner paid $103k; 45% above their basis — modest negotiation headroom, anchor on the comps not their cost.
Risks & watch-outs
- Watch-outs: built in 1950 — expect roof / HVAC / electrical / plumbing capex.
Questions for the listing agent
- It's been on market 35 days. Have you received any prior offers? Is the seller open to a 6% concession, seller financing, or rate buy-down credit?
- Built in 1950 — when were the roof, HVAC, electrical panel, plumbing, and water heater last replaced?
- Is there a deadline driving the sale (1031 exchange, divorce, estate, relocation)? That informs how much negotiation room exists.
- Schools are D-rated, which usually means shorter tenancies and higher turnover. Who's the typical renter profile here, and what's been the actual vacancy rate?
- Crime grade is D in this area — have there been break-ins, vandalism, or insurance claims at this property in the last 3 years? What carrier currently insures it and at what premium?
- The area grade is low — what's the realistic commute time and amenity access for the typical tenant pool here? Any planned neighborhood developments (good or bad) we should know about?
- What's the average days-on-market for RENTAL listings here right now (not sales)? A rising rental-DOM trend means longer vacancies and softer asking-rent achievability than the comps imply.
- What's the recent tenant-quality profile in this submarket — average credit score on applications, eviction rate, late-payment / NSF rate, and stable-employment percentage? A property-management company in the area should have these aggregated.
- How much new for-sale + rental construction is in the pipeline within 1–3 miles? Heavy new supply typically softens prices + rents 12–24 months out; constrained supply supports both.
Investment metrics
- 1% rule
- 0.94% ✗
- Cap rate
- 6.73%
- Cash-on-cash
- 1.56%
- DSCR
- 1.07
- GRM
- 8.9
CMA / ARV
- ARV (median comp)
- $146,425
- List price
- $150,000
- Delta
- 2.44%
- Verdict
- FAIR
- Comps
- 1 within 2.0 mi
Projected returns pro-forma
-3.0% appreciation · 3.0% rent growth · sell at horizon
- IRR
- -13.8%
- Equity multiple
- 0.50×
- Total profit
- $-20,799
- Equity at exit
- $22,365
- IRR
- -4.9%
- Equity multiple
- 0.68×
- Total profit
- $-13,506
- Equity at exit
- $12,969
Cash invested: $42,000 (down + closing). Projections, not guarantees.
Landlord ↔ Tenant lean methodology
- Overall (STATE)
- 46 Balanced
- State Minnesota
- 46 Balanced · D+2
- County
- — inherits STATE
- City
- — inherits STATE
ZIP-level market 56201
- Active inventory
- 161
- Price-to-rent
- 8.9×
Monthly cashflow live
- Estimated rent
- $1,403 medium interval (Pro) →
- Mortgage (P&I)
- −$787
- Tax from tax record
- −$205 /mo · $2,456/yr
- Insurance
- −$62
- HOA
- −$0
- Vacancy / Maint / Mgmt
- −$295
- Net cashflow
- $55
Break-even live
UW: 25.0% down · 7.5% · 30yr · 1.5% tax · 5.0% vac · 8.0% maint · 8.0% mgmt
Financing live
Cash to close
- Down payment
- $37,500
- Closing costs
- $4,500
- Reserves months
- —
- Total cash needed
- —
Loan-product check · same deal, 3 products live
Conventional
25% down · 7.5% · 30yr
- Down + closing
- —
- Monthly P&I
- —
- Monthly cashflow
- —
- DSCR
- —
- Eligible?
- —
Personal DTI + credit; lowest rate.
DSCR
20% down · 8.5% · 30yr
- Down + closing
- —
- Monthly P&I
- —
- Monthly cashflow
- —
- DSCR
- —
- Eligible?
- —
No personal income docs; deal must DSCR.
Hard money
10% down · 12.0% · 12mo
- Down + closing
- —
- Monthly P&I
- —
- Monthly cashflow
- —
- DSCR
- —
- Eligible?
- —
Short-term bridge; refi at stabilization.
Listing history 22 events
-
2026-06-18days on market $150,000 Active 35 DOM
-
2026-06-17days on market $150,000 Active 34 DOM
-
2026-06-16days on market $150,000 Active 33 DOM
-
2026-06-15days on market $150,000 Active 32 DOM
-
2026-06-13days on market $150,000 Active 30 DOM
-
2026-06-12days on market $150,000 Active 29 DOM
-
2026-06-09days on market $150,000 Active 26 DOM
-
2026-06-08days on market $150,000 Active 25 DOM
-
2026-06-07days on market $150,000 Active 24 DOM
-
2026-06-07days on market $150,000 Active 23 DOM
-
2026-06-04days on market $150,000 Active 20 DOM
-
2026-06-02days on market $150,000 Active 19 DOM
-
2026-06-01days on market $150,000 Active 18 DOM
-
2026-05-31days on market $150,000 Active 17 DOM
-
2026-05-31days on market $150,000 Active 16 DOM
-
2026-05-14$150,000 Active 850-char remark
-
2021-07-22soldstatus $103,100
-
2021-07-16soldstatus $103,100 Sold 137-char remark
Show marketing remark (137 chars)
Great property for the price. This home has newer windows, roof and steel siding. 3 bedrooms, 2 bath home. This home has great potential.
-
2021-06-02status Pending 137-char remark
Show marketing remark (137 chars)
Great property for the price. This home has newer windows, roof and steel siding. 3 bedrooms, 2 bath home. This home has great potential.
-
2021-05-26historical Contingent - Inspection 137-char remark
Show marketing remark (137 chars)
Great property for the price. This home has newer windows, roof and steel siding. 3 bedrooms, 2 bath home. This home has great potential.
-
2021-05-18status Pending 137-char remark
Show marketing remark (137 chars)
Great property for the price. This home has newer windows, roof and steel siding. 3 bedrooms, 2 bath home. This home has great potential.
-
2021-05-14$100,000 Active 137-char remark
Show marketing remark (137 chars)
Great property for the price. This home has newer windows, roof and steel siding. 3 bedrooms, 2 bath home. This home has great potential.
ⓘ Source: listings_history table (triggers on properties + properties_extension) + one-shot
backfill from property_details.listing_events for pre-trigger history.
Tax reassessment forecast MN · Partial reset (capped growth)
- Current annual tax
- $2,456 · $205/mo
- Projected year-2 tax
- $2,456 · $205/mo
- Expected delta
- $0/yr ($0/mo · 0.0%)
ⓘ Screening estimate from a state-policy table — verify with the county assessor before closing.
Climate risk First Street
- Flood 1/10 Low FEMA zone X (unshaded) · 0% chance over 30 yrs
- Wildfire 2/10 Low
- Heat 2/10 Low 7 d/yr ≥98°F today · 14 d/yr by 30 yrs out
- Wind 2/10 Low
- Air quality 2/10 Low 2 unhealthy d/yr today · 2 by 30 yrs out
Nearby sold comps map
Loading sold comps map…
Walkable amenities ~0.75 mi
Loading nearby amenities…
Taxation est. · year 1
- Rental income
- $16,836
- − Mortgage interest
- −$8,402
- − Property taxes
- −$2,456
- − Insurance
- −$750
- − Repairs & maintenance
- −$1,347
- − Management
- −$1,347
- − Depreciation
- −$4,364
- Taxable loss
- −$1,830
- Est. tax savings @ 24.0%
- +$439
- After-tax cash flow
- $1,094/yr
For passive investors: Depreciation is non-cash, so a rental often shows a tax loss while cash-flowing — sheltering income. Rental losses are passive: they offset passive income freely, and up to $25,000/yr can offset ordinary (W-2) income if you actively participate and your MAGI is under $100k (phasing out to $0 by $150k); unused losses carry forward. On sale, claimed depreciation is recaptured at up to 25%, and gains may owe capital-gains tax (a 1031 exchange can defer both). Figures are a year-1 estimate at your 24.0% rate — not tax advice; consult a CPA.
Schools (NCES district)
- District
- Willmar Public School District
- NCES district ID
- 2742720
- Math proficiency
- 34% ▼ -14.00%
- Reading proficiency
- 38% ▼ -8.00%
- Median HH income
- $46,727
- Composite
- 30.85/100
- National rank
- #6128
- State rank
- #246 of 301 in MN
Livability — Willmar
- Score
- 73/100
- State rank
- #233
- US rank
- #4984
Category grades
Schools grade is shown separately in the Schools card above.
Census & demographics
- Census place
- Willmar, MN
- City population
- 24,860
- Population (ZIP)
- 24,860
Population outlook (Kandiyohi County) Hauer SSP2
- Today (2025)
- 42,956 people
- By 2030
- 42,825 · -0.3%
- By 2040
- 42,343 · -1.4%
- By 2050
- 42,124 · -1.9%
- By 2075
- 43,726 · +1.8%
- By 2100
- 45,974 · +7.0%
Race, ethnicity, and origin ACS 2023
- Neighborhood character
- Majority White (64%)
- Race & ethnicity
- White 64% Hispanic / Latino 22% Black 10% Two or more races 6% Asian 2%
- Hispanic origin (detail)
- Mexican 15%
- Common ancestry
- Portuguese 15% Iranian 3% Scottish 2%
- Foreign-born
- 15% · Canada, Philippines
- Languages at home
- 78% English-only · Spanish 14% Other Asian/Pacific 2%
Political lean MEDSL · Kandiyohi
- 2024 margin
- Solid R (+31.0) · D 33.7% · R 64.7% · Other 1.7%
- 2008→2024 swing
- -25.6pp toward R · 2008: -5.5pp · 2024: -31.0pp
- All cycles
- 2024: R+31.0 2020: R+25.7 2016: R+25.5 2012: R+6.7 2008: R+5.5
Not yet ingested
- Civics
- —
Market trends
- HPI YoY
- ▼ -151.48%
- Current HPI
- 161.1663
- Rent YoY
- —
- Metro
- —
- State GDP YoY
- ▲ 2.41%
- F500 in state
- 34
Industry mix (Fortune 500 HQ in MN)
| Industry | F500 HQs | Revenue |
|---|---|---|
| Healthcare | 2 | $407B |
|
||
| Retail | 2 | $150B |
|
||
| Consumer Goods | 2 | $32B |
|
||
| Industrial Machinery | 2 | $6B |
|
||
| Agriculture | 1 | $40B |
|
||
| Healthcare / Medical Devices | 1 | $32B |
|
||
Price history
+50.0% since first listed7 events — show timeline
- 2026-05-14 Listed $150,000 NORTHSTARMLS as Distributed by MLS Grid
- 2021-07-22 Sold (Public Records) $103,100 Public Records
- 2021-07-16 Sold (MLS) $103,100 NORTHSTARMLS as Distributed by MLS Grid
- 2021-06-02 Pending — NORTHSTARMLS as Distributed by MLS Grid
- 2021-05-26 Contingent — NORTHSTARMLS as Distributed by MLS Grid
- 2021-05-18 Pending — NORTHSTARMLS as Distributed by MLS Grid
- 2021-05-14 Listed $100,000 NORTHSTARMLS as Distributed by MLS Grid
Property tax history
+11.3%/yrLatest (2025): $2,456 · +5.9% YoY. Source: county tax records.
Cash-flow waterfall
monthlySold comps — $/sqft
last 12 mo · ≤1 miLoading sold comps…