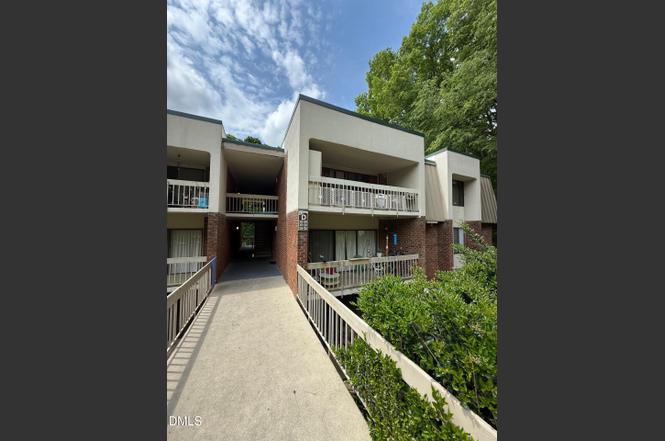
500 Umstead Dr Unit 208 · Chapel Hill, NC
Flood risk 1/10 · Minimal
- FEMA flood zone
- X (unshaded)
- Chance of flooding over 30 yrs
- 0.0%
- Est. flood insurance / yr
- $507 – $1,088
Fire risk 1/10 · Minimal
- Est. fire insurance / yr
- $906 – $1,684
Heat risk 6/10 · Moderate
- Hot days now (above 105°F)
- 7 days/yr
- Hot days in 30 yrs
- 17 days/yr
Wind risk 6/10 · Moderate
- Chance of severe wind over 30 yrs
- 27.0%
Air-quality risk 2/10 · Minimal
- Unhealthy air days now
- 1 days/yr
- Unhealthy air days in 30 yrs
- 1 days/yr
Risk factors via First Street. Map © Google.
Why this score? — see what drove the D grade
The composite is a weighted blend of 9 inputs, each scored 0–100. Each bar is that input's sub-score; the figure is the points it added to the 100-point composite (weight × sub-score).
- Cash flow +10.8/30.0
- ARV discount +7.5/15.0
- Schools +5.4/10.0
- 1% rule +4.8/10.0
- Livability +4.2/5.0
- DSCR +3.1/10.0
- Rent growth +3.1/5.0
- Condition / age +2.5/5.0
- Appreciation +0.0/10.0
$214,900
🖨 Deal sheet 📄 Offer letter ✓ Due diligence
Listing remarks
Extremely convenient three-bedroom, two full bath condo with minimal stairs! open concept living and dining areas that open to patio through large sliding glass doors. Spacious primary suite with full bath. Many updates in 2018 including kitchen cabs, appliances, counters, laminate flooring throughout the unit, and updated baths. Beds, dressers, and larger furniture conveys. Community pool just steps away. Excellent rental history and income currently but would also make a great individual use home! So much here, come and see it!
Key facts
- Open concept living
- Updated baths
- Community pool
Tags
Property features AI
Finance
- Other: Located in Orange County; Publicly maintained roads; Living area approximately 1,157
- HOA & community: Association: Bolinwood Condos HOA; Monthly HOA fee (includes grounds maintenance, pest control, sewer, water); Association amenities: pool, maintenance structure, trash, water
Exterior
- Parking: Assigned parking in a parking lot; 2 open parking spaces
- Utilities: Public water; Public sewer
- Home design: Multi-family unit; One story; Unit 208; 2+ common walls
- Construction: Brick veneer exterior; Slab foundation; Composition/Other roof; Built as part of a multi-unit building
- Exterior features: Covered rear porch; Association pool; Street lights (community)
Interior
- Kitchen: Dishwasher; Electric range; Microwave; Refrigerator
- Bedrooms: 3 bedrooms (all on the main level)
- Flooring: Laminate flooring; Vinyl flooring
- Bathrooms: 2 full bathrooms
- Heating & cooling: Heat pump heating; Heat pump cooling
- Interior features: Open floorplan; Bathtub/shower combination; High-speed internet
- Laundry & utility: Common area laundry; Outdoor laundry access
Neighborhood map
What this means for you Summary
Snapshot
- This is a 3-bed/2.0-bath condo listed at $215k.
Deal economics
- At list price, monthly cash flow is $-100 ($-1k/yr) — negative.
- To cash-flow at today's rent, offer at most $200k (6.7% below list).
- To meet the 1% rule (rent ≥ 1% of price), the offer needs to be $211k (1.9% below list).
- Recommended offer: $196k (9.0% below list) — sets the bar for market timing.
- Cap rate 5.7% vs local median 1.8% in Chapel Hill — top-decile yield for the area; either an underpriced asset or a hidden risk that comps aren't pricing in. Stress-test before assuming the spread holds.
Location & tenants
- Location reads 84/100 on livability (#5 in NC, #742 nationally) — a professional / high-income tenant draw. Strengths: amenities A+, commute A+, employment A+; Watch: cost of living F.
- Chapel Hill-Carrboro City Schools (urban): math 60% / reading 66% proficiency, ranked #24 of 178 in NC (top 14%) — acceptable for families but not a draw, mixed tenant base, ~2y average lease.
- Zoned schools: Chapel Hill High (math 79% / reading 47%, grade B-, #177 of 535 statewide, top 33%, 1,597 students, 25% FRL) — zoned schools at 25% FRL track the district average.
- Market conditions: Rents rising (+2.5%/yr); 361 active listings in the ZIP; 20 comparable units currently listed for rent nearby; rentals at typical pace (median 24d on market — plan ~3-4 weeks tenant-placement turnaround); solid renter incomes; 375 units permitted in Orange County in 2024 (34 in 5+ unit buildings).
Forward outlook
- Local home prices are declining (-3.0%/yr); year-one equity from $1k of loan paydown is wiped out by about $6k of value loss. Plan a longer hold.
- Orange County population projected at +28% by 2050 — long-run rental-demand tailwind backs the buy-and-hold thesis.
Negotiation context
- It's been on market 97 days — a 9% lower offer ($196k) is reasonable based on typical stale-listing flexibility.
Risks & watch-outs
- Climate carrying-cost: major wind risk, 27% chance of damaging wind over 30y; extreme-heat days projected 7→17/yr by 2055 (HVAC capex compounding) — expect insurance premiums to compound above CPI over the hold.
Questions for the listing agent
- What do current leases actually rent for vs. the listed asking? Can we see a recent rent roll and the last 12 months of T-12 income?
- It's been on market 97 days. Have you received any prior offers? Is the seller open to a 9% concession, seller financing, or rate buy-down credit?
- Built in 1972 — when were the roof, HVAC, electrical panel, plumbing, and water heater last replaced?
- What does the HOA fee cover, when was the last increase, and are there any pending special assessments or reserve-fund shortfalls?
- Any open or pending special assessments — roof, HVAC, plumbing, elevator, façade? What's the per-unit balance and payoff schedule, and is the seller paying it off at close or rolling it to the buyer?
- Why hasn't it sold? Are there any deal-killer items the seller is aware of (foundation, flood, title, zoning, code violations)?
- Is there a deadline driving the sale (1031 exchange, divorce, estate, relocation)? That informs how much negotiation room exists.
- Schools are A-rated — typically a magnet for longer-tenancy family renters. What's the average tenant stay here, and is there a school-zone premium baked into asking?
- The area grade is low — what's the realistic commute time and amenity access for the typical tenant pool here? Any planned neighborhood developments (good or bad) we should know about?
- What's the average days-on-market for RENTAL listings here right now (not sales)? A rising rental-DOM trend means longer vacancies and softer asking-rent achievability than the comps imply.
- What's the recent tenant-quality profile in this submarket — average credit score on applications, eviction rate, late-payment / NSF rate, and stable-employment percentage? A property-management company in the area should have these aggregated.
- How much new apartment / multifamily construction is in the pipeline within 1–3 miles? Heavy new supply (>2% of stock underway) typically softens rents 12–24 months out; light construction supports rent growth.
Investment metrics
- 1% rule
- 0.98% ✗
- Cap rate
- 5.73%
- Cash-on-cash
- -1.99%
- DSCR
- 0.91
- GRM
- 8.5
CMA / ARV
No comps found within radius.
Projected returns pro-forma
-3.0% appreciation · 2.54% rent growth · sell at horizon
- IRR
- -20.1%
- Equity multiple
- 0.30×
- Total profit
- $-41,959
- Equity at exit
- $32,042
- IRR
- -14.1%
- Equity multiple
- 0.20×
- Total profit
- $-47,857
- Equity at exit
- $18,581
Cash invested: $60,172 (down + closing). Projections, not guarantees.
Landlord ↔ Tenant lean methodology
- Overall (STATE)
- 85 Strongly Landlord-Friendly
- State North Carolina
- 85 Strongly Landlord-Friendly · R+3
- County
- — inherits STATE
- City
- — inherits STATE
ZIP-level market 27516
- Rents YoY
- 2.5%
- Active inventory
- 361
- Price-to-rent
- 8.5×
Monthly cashflow live
- Estimated rent
- $2,109 high interval (Pro) →
- Mortgage (P&I)
- −$1,127
- Tax est. 1.5%
- −$269 /mo · $3,224/yr
- Insurance
- −$90
- HOA
- −$281
- Vacancy / Maint / Mgmt
- −$443
- Net cashflow
- $-100
Break-even live
UW: 25.0% down · 7.5% · 30yr · 1.5% tax · 5.0% vac · 8.0% maint · 8.0% mgmt
Financing live
Cash to close
- Down payment
- $53,725
- Closing costs
- $6,447
- Reserves months
- —
- Total cash needed
- —
Loan-product check · same deal, 3 products live
Conventional
25% down · 7.5% · 30yr
- Down + closing
- —
- Monthly P&I
- —
- Monthly cashflow
- —
- DSCR
- —
- Eligible?
- —
Personal DTI + credit; lowest rate.
DSCR
20% down · 8.5% · 30yr
- Down + closing
- —
- Monthly P&I
- —
- Monthly cashflow
- —
- DSCR
- —
- Eligible?
- —
No personal income docs; deal must DSCR.
Hard money
10% down · 12.0% · 12mo
- Down + closing
- —
- Monthly P&I
- —
- Monthly cashflow
- —
- DSCR
- —
- Eligible?
- —
Short-term bridge; refi at stabilization.
Rent comps 20 comps
| Address | Beds | Baths | Sqft | Rent | $/sqft | DOM | Units | Dist |
|---|---|---|---|---|---|---|---|---|
| 500 Umstead Dr Chapel Hill, NC | 2.0 | 1.5–2.0 | 923 | $1,315 | $1.42 | 14d | 2 | 0.04mi |
| 306 Estes Dr Carrboro, NC | 1.0–2.0 | 1.0 | 655 | $1,185 | $1.81 | 14d | 73 | 0.34mi |
| 223 Jay St Chapel Hill, NC | 3.0 | 2.0 | 1484 | $2,349 | $1.58 | 23d | 1 | 0.34mi |
| 234 Jay St Chapel Hill, NC | 3.0 | 2.0 | 1200 | $3,800 | $3.17 | 14d | 1 | 0.37mi |
| 706 Sykes St Unit A Chapel Hill, NC | 4.0 | 2.0 | 1350 | $2,400 | $1.78 | 23d | 1 | 0.49mi |
| 714 Bradley Rd Unit A Chapel Hill, NC | 2.0 | 1.0 | 1400 | $3,000 | $2.14 | 23d | 1 | 0.53mi |
| 106 Pleasant Dr Unit A Carrboro, NC | 2.0 | 1.0 | 904 | $1,200 | $1.33 | 23d | 1 | 0.61mi |
| 1104 N Greensboro St Carrboro, NC | 3.0 | 1.0 | 930 | $1,595 | $1.72 | 23d | 1 | 0.69mi |
| 111 Barclay Rd Chapel Hill, NC | 2.0 | 1.0 | 1138 | $1,850 | $1.63 | 14d | 1 | 0.70mi |
| 1104 N Greensboro St Unit 15 Carrboro, NC | 3.0 | 2.0 | 1079 | $1,700 | $1.58 | 14d | 1 | 0.70mi |
| 505 N Greensboro St Unit A Carrboro, NC | 4.0 | 2.0 | 1232 | $2,000 | $1.62 | 23d | 1 | 0.74mi |
| 206 N Graham St Chapel Hill, NC | 3.0 | 2.0 | 1297 | $2,700 | $2.08 | 23d | 1 | 0.85mi |
| 108 Lindsay St Unit A Carrboro, NC | 2.0 | 1.0 | 750 | $1,795 | $2.39 | 23d | 1 | 0.94mi |
| 1000 Martin Luther King Jr Blvd Chapel Hill, NC | 1.0–3.0 | 1.0–3.5 | 1221 | $4,595 | $3.76 | 14d | 268 | 0.99mi |
| 605 W Main St #301 Carrboro, NC | 2.0 | 2.0 | 960 | $1,700 | $1.77 | 23d | 1 | 1.07mi |
| 118 Bim St Carrboro, NC | 2.0–4.0 | 1.0–2.0 | 1000 | $2,095 | $2.10 | 14d | 8 | 1.18mi |
| 125a Wild Iris Ln Chapel Hill, NC | 2.0 | 2.0 | 1023 | $1,800 | $1.76 | 23d | 1 | 1.27mi |
| 110 Piney Mountain Rd Chapel Hill, NC | 1.0–2.0 | 1.0–2.0 | 824 | $1,514 | $1.84 | 14d | 17 | 1.30mi |
| 220 Elizabeth St Chapel Hill, NC | 2.0 | 2.5 | 1175 | $1,698 | $1.44 | 14d | 5 | 1.35mi |
| 121 Westview Dr #38 Carrboro, NC | 2.0 | 1.0 | 844 | $1,300 | $1.54 | 23d | 1 | 1.40mi |
HOA detail condo
- Monthly dues
- $281 · $3,372/yr
- Likely covers
- pool
- Assessments
- None detected in remarks — confirm with the listing agent.
Listing history 17 events
-
2026-06-18days on market $214,900 Active 97 DOM
-
2026-06-17days on market $214,900 Active 96 DOM
-
2026-06-16days on market $214,900 Active 95 DOM
-
2026-06-15days on market $214,900 Active 94 DOM
-
2026-06-14days on market $214,900 Active 92 DOM
-
2026-06-13days on market $214,900 Active 91 DOM
-
2026-06-10days on market $214,900 Active 89 DOM
-
2026-06-09days on market $214,900 Active 88 DOM
-
2026-06-08days on market $214,900 Active 87 DOM
-
2026-06-07days on market $214,900 Active 86 DOM
-
2026-06-05days on market $214,900 Active 83 DOM
-
2026-06-03days on market $214,900 Active 82 DOM
-
2026-06-02days on market $214,900 Active 81 DOM
-
2026-06-01days on market $214,900 Active 80 DOM
-
2026-05-31days on market $214,900 Active 79 DOM
-
2026-05-30days on market $214,900 Active 78 DOM
-
2026-03-13$234,900 Active
ⓘ Source: listings_history table (triggers on properties + properties_extension) + one-shot
backfill from property_details.listing_events for pre-trigger history.
Climate risk First Street
- Flood 1/10 Low FEMA zone X (unshaded) · 0% chance over 30 yrs
- Wildfire 1/10 Low
- Heat 6/10 Major 7 d/yr ≥105°F today · 17 d/yr by 30 yrs out
- Wind 6/10 Major 27% chance of damaging wind over 30 yrs
- Air quality 2/10 Low 1 unhealthy d/yr today · 1 by 30 yrs out
Nearby sold comps map
Loading sold comps map…
Walkable amenities ~0.75 mi
Loading nearby amenities…
Taxation est. · year 1
- Rental income
- $25,308
- − Mortgage interest
- −$12,038
- − Property taxes
- −$3,224
- − Insurance
- −$1,074
- − Repairs & maintenance
- −$2,025
- − Management
- −$2,025
- − HOA
- −$3,372
- − Depreciation
- −$6,252
- Taxable loss
- −$4,700
- Est. tax savings @ 24.0%
- +$1,128
- After-tax cash flow
- $-72/yr
For passive investors: Depreciation is non-cash, so a rental often shows a tax loss while cash-flowing — sheltering income. Rental losses are passive: they offset passive income freely, and up to $25,000/yr can offset ordinary (W-2) income if you actively participate and your MAGI is under $100k (phasing out to $0 by $150k); unused losses carry forward. On sale, claimed depreciation is recaptured at up to 25%, and gains may owe capital-gains tax (a 1031 exchange can defer both). Figures are a year-1 estimate at your 24.0% rate — not tax advice; consult a CPA.
Schools (NCES district)
- District
- Chapel Hill-Carrboro City Schools
- NCES district ID
- 3700720
- Math proficiency
- 60% ▼ -4.00%
- Reading proficiency
- 66% ▼ -1.00%
- Median HH income
- $57,687
- Composite
- 54.28/100
- National rank
- #1370
- State rank
- #24 of 178 in NC
Livability — Chapel Hill
- Score
- 84/100
- State rank
- #5
- US rank
- #742
Category grades
Schools grade is shown separately in the Schools card above.
Census & demographics
- Census place
- Chapel Hill, NC
- County
- Orange County · 151,666 people
- City population
- 62,515
- Metro
- Durham-Chapel Hill, NC
- Population (ZIP)
- 47,358
- Household income
- $106,353
- Rent vs Own
- Severe rent burden
- 1783.0
Population outlook (Orange County) Hauer SSP2
- Today (2025)
- 158,781 people
- By 2030
- 168,367 · +6.0%
- By 2040
- 186,192 · +17.3%
- By 2050
- 203,801 · +28.4%
- By 2075
- 249,160 · +56.9%
- By 2100
- 285,614 · +79.9%
Race, ethnicity, and origin ACS 2023
- Neighborhood character
- Predominantly White (69%)
- Race & ethnicity
- White 69% Asian 10% Black 9% Hispanic / Latino 7% Two or more races 7%
- Hispanic origin (detail)
- Mexican 3%
- Common ancestry
- Slovak 4% Romanian 3% Italian 2%
- Foreign-born
- 12% · Canada, China, South Korea
- Languages at home
- 85% English-only · Spanish 5% Chinese 3% Other Indo-European 2%
Political lean MEDSL · Orange
- 2024 margin
- Solid D (+51.1) · D 74.9% · R 23.8% · Other 1.4%
- 2008→2024 swing
- +6.3pp toward D · 2008: 44.8pp · 2024: 51.1pp
- All cycles
- 2024: D+51.1 2020: D+51.1 2016: D+51.0 2012: D+42.2 2008: D+44.8
Not yet ingested
- Civics
- —
Market trends
- HPI YoY
- ▼ -360.82%
- Current HPI
- 222.7543
- Rent YoY
- ▲ 2.54%
- Metro
- Durham-Chapel Hill, NC
- State GDP YoY
- ▲ 3.28%
- F500 in state
- 26
Industry mix (Fortune 500 HQ in NC)
| Industry | F500 HQs | Revenue |
|---|---|---|
| Financial Services | 2 | $213B |
|
||
| Retail | 2 | $95B |
|
||
| Industrial Conglomerate | 1 | $38B |
|
||
| Metals / Steel | 1 | $35B |
|
||
| Utilities | 1 | $30B |
|
||
| Industrial Machinery | 1 | $19B |
|
||
Price history
1 event — show timeline
- 2026-03-13 Listed $234,900 TMLS
Cash-flow waterfall
monthlySold comps — $/sqft
last 12 mo · ≤1 miLoading sold comps…