 🔨 Auction
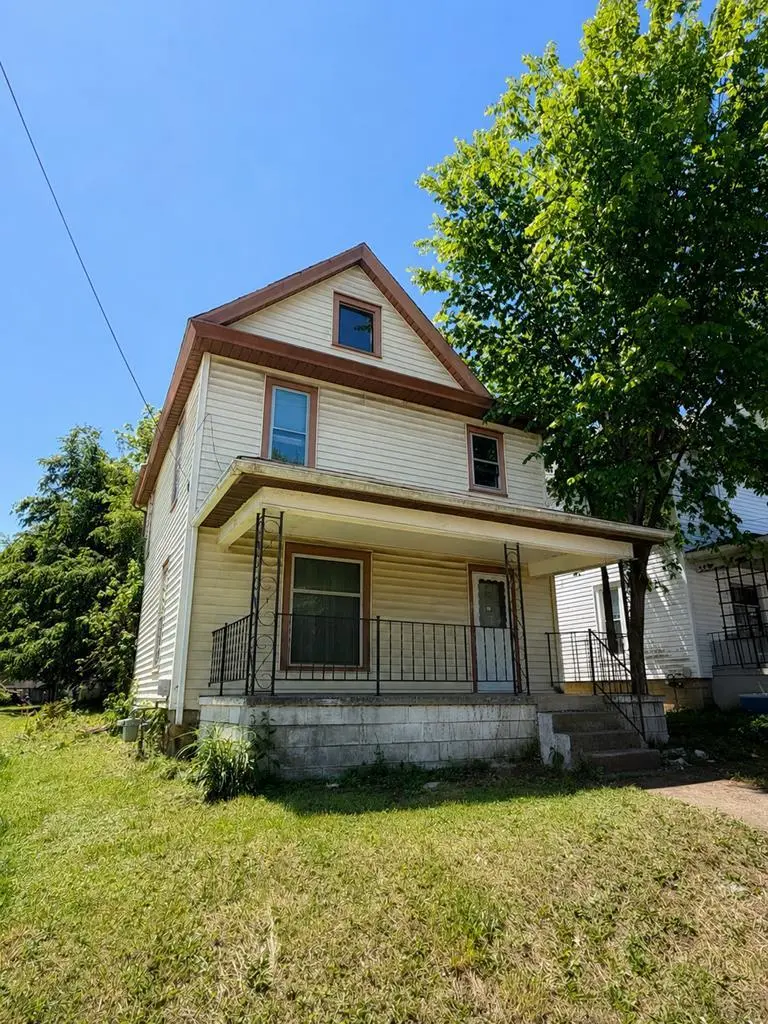
29 E 9th St · Ashland, OH
Flood risk 1/10 · Minimal
- FEMA flood zone
- X (unshaded)
- Chance of flooding over 30 yrs
- 0.0%
- Est. flood insurance / yr
- $473 – $860
Fire risk 1/10 · Minimal
- Est. fire insurance / yr
- $713 – $1,323
Heat risk 3/10 · Minor
- Hot days now (above 97°F)
- 7 days/yr
- Hot days in 30 yrs
- 16 days/yr
Wind risk 2/10 · Minimal
- Chance of severe wind over 30 yrs
- —
Air-quality risk 2/10 · Minimal
- Unhealthy air days now
- 1 days/yr
- Unhealthy air days in 30 yrs
- 2 days/yr
Risk factors via First Street. Map © Google.
Why this score? — see what drove the F grade
The composite is a weighted blend of 9 inputs, each scored 0–100. Each bar is that input's sub-score; the figure is the points it added to the 100-point composite (weight × sub-score).
- ARV discount +7.5/15.0
- Cash flow +7.4/30.0
- Schools +5.8/10.0
- Rent growth +4.3/5.0
- Livability +3.6/5.0
- Condition / age +2.5/5.0
- 1% rule +2.1/10.0
- DSCR +1.5/10.0
- Appreciation +0.0/10.0
$1
🖨 Deal sheet 📄 Offer letter ✓ Due diligence
Listing remarks
Offering at ABSOLUTE auction, ONLINE ONLY, an Investor Special. ! Welcome to this nice home built in 1901! You enter through a fair entryway, to the left is a family room, followed by a dining room and then the kitchen. Upstairs there are 3 bedrooms, 1 full bath and an attic area. The basement is off the kitchen and houses the laundry. This home has tons of potential, needs plenty of work!! A perfect rental or flip investment. Selling as-is. Don't miss your opportunity on this 1,232 sq foot home with original woodwork throughout!
Key facts
- 4,356 sq ft lot
- Built 1901
- Listed 17 days
Property features AI
Exterior
- Utilities: Public water; Public sewer; Cable available
- Home design: Single family residence; 2 stories
- Construction: Vinyl siding
- Exterior features: Shingle roof
Interior
- Bathrooms: 1 full bathroom
- Heating & cooling: Forced air heating (natural gas)
- Interior features: Electric water heater; Full basement
Neighborhood map
What this means for you Summary
Snapshot
- This is a 3-bed/1.0-bath single-family listed at $1.
Deal economics
- At list price, monthly cash flow is $-198 ($-2k/yr) — negative.
- The deal already cash-flows at list — no discount required.
- Meets the 1% rule at list price ($1k rent vs $1).
- Cap rate 4.7% vs local median 3.8% in Ashland — meaningfully above typical; check what's discounted (condition, days-on-market, listing class) to confirm the premium yield is real.
Location & tenants
- Location reads 72/100 on livability (#373 in OH) — a middle-class / working-renter tenant base. Strengths: cost of living A+, housing A+, crime B+; Watch: employment C-, amenities D-, commute F.
- Ashland City (town): math 70% / reading 69% proficiency, ranked #165 of 656 in OH (top 25%) — acceptable for families but not a draw, mixed tenant base, ~2y average lease.
- Market conditions: Rents rising fast (+7.1%/yr); 122 active listings in the ZIP; 4 comparable units currently listed for rent nearby; rentals lingering (median 44d on market — plan ~5-8 weeks vacancy on turnover, expect pricing pressure); 100% of comp listings sitting > 30 days — soft ceiling on asking rent; 61 units permitted in Ashland County in 2024 (0 in 5+ unit buildings).
Forward outlook
- Local home prices are declining (-3.0%/yr); year-one equity from $1k of loan paydown is wiped out by about $5k of value loss. Plan a longer hold.
- Ashland County population projected at -13% by 2050 — secular population decline; favor cash flow + early exit over multi-decade hold.
Negotiation context
- It's been on market 18 days — a 2% lower offer ($0) is reasonable based on typical stale-listing flexibility.
Risks & watch-outs
- Watch-outs: property tax is 231000.0% of price; built in 1901 — expect roof / HVAC / electrical / plumbing capex.
Questions for the listing agent
- What do current leases actually rent for vs. the listed asking? Can we see a recent rent roll and the last 12 months of T-12 income?
- Built in 1901 — when were the roof, HVAC, electrical panel, plumbing, and water heater last replaced?
- Property tax is high relative to price — has the assessment been appealed recently, and will the sale trigger a re-assessment?
- Is there a deadline driving the sale (1031 exchange, divorce, estate, relocation)? That informs how much negotiation room exists.
- Schools are B-rated — typically a magnet for longer-tenancy family renters. What's the average tenant stay here, and is there a school-zone premium baked into asking?
- The area grade is low — what's the realistic commute time and amenity access for the typical tenant pool here? Any planned neighborhood developments (good or bad) we should know about?
- What's the average days-on-market for RENTAL listings here right now (not sales)? A rising rental-DOM trend means longer vacancies and softer asking-rent achievability than the comps imply.
- What's the recent tenant-quality profile in this submarket — average credit score on applications, eviction rate, late-payment / NSF rate, and stable-employment percentage? A property-management company in the area should have these aggregated.
- How much new for-sale + rental construction is in the pipeline within 1–3 miles? Heavy new supply typically softens prices + rents 12–24 months out; constrained supply supports both.
Investment metrics
- 1% rule
- 0.71% ✗
- Cap rate
- 4.75%
- Cash-on-cash
- -5.52%
- DSCR
- 0.75
- GRM
- 11.7
CMA / ARV
- ARV (on-the-fly)
- $154,000
- Comps found
- 12
Show comp detail 12 sales within ~0.75 mi
| Address | Dist | Beds/Ba | Sqft | Sold | Price | $/sf | Match |
|---|---|---|---|---|---|---|---|
| 917 Union St | 0.10mi | 2/1.0 (-1) | 1,064 (-14%) | 1mo | $120,000 | $113 | 67 |
| 1000 Union St | 0.10mi | 3/1.0 | 1,056 (-14%) | 6mo | $140,000 | $133 | 66 |
| 410 Ohio St | 0.42mi | 3/1.5 | 1,288 (+4%) | 6mo | $150,000 | $116 | 66 |
| 605 Evergreen St | 0.58mi | 3/1.0 | 1,276 (+4%) | 2mo | $160,000 | $125 | 65 |
| 1407 Cottage St | 0.47mi | 3/2.0 | 1,368 (+11%) | 1mo | $50,000 | $37 | 55 |
| 1499 Troy Rd | 0.55mi | 3/1.0 | 1,092 (-11%) | 4mo | $179,000 | $164 | 52 |
| 122 Lindale Ave | 0.70mi | 3/2.0 | 1,316 (+7%) | 2mo | $125,000 | $95 | 50 |
| 422 Snader Ave | 0.68mi | 3/1.0 | 1,100 (-11%) | 1mo | $165,000 | $150 | 50 |
| 420 E Walnut St | 0.65mi | 3/2.0 | 1,322 (+7%) | 5mo | $150,000 | $113 | 49 |
| 803 Myers Ave | 0.51mi | 3/2.0 | 1,414 (+15%) | 4mo | $151,000 | $107 | 44 |
| 406 E Liberty St | 0.72mi | 3/1.0 | 1,090 (-12%) | 5mo | $155,000 | $142 | 43 |
| 840 W 10th St | 0.75mi | 3/1.0 | 1,056 (-14%) | 1mo | $144,000 | $136 | 41 |
Match score weights: distance 35% · size 25% · config 20% · recency 20%. Top-matched comps best support the ARV.
Projected returns pro-forma
-3.0% appreciation · 7.07% rent growth · sell at horizon
- IRR
- -21.3%
- Equity multiple
- 0.24×
- Total profit
- $-32,896
- Equity at exit
- $22,962
- IRR
- -7.5%
- Equity multiple
- 0.44×
- Total profit
- $-23,987
- Equity at exit
- $13,315
Cash invested: $43,120 (down + closing). Projections, not guarantees.
Landlord ↔ Tenant lean methodology
- Overall (STATE)
- 73 Landlord-Friendly
- State Ohio
- 73 Landlord-Friendly · R+6
- County
- — inherits STATE
- City
- — inherits STATE
ZIP-level market 44805
- Rents YoY
- 7.1%
- Active inventory
- 122
Monthly cashflow live
- Estimated rent
- $1,096 medium interval (Pro) →
- Mortgage (P&I)
- −$808
- Tax est. 1.5%
- −$192 /mo · $2,310/yr
- Insurance
- −$64
- HOA
- −$0
- Vacancy / Maint / Mgmt
- −$230
- Net cashflow
- $-198
Break-even live
UW: 25.0% down · 7.5% · 30yr · 1.5% tax · 5.0% vac · 8.0% maint · 8.0% mgmt
Financing live
Cash to close
- Down payment
- $38,500
- Closing costs
- $4,620
- Reserves months
- —
- Total cash needed
- —
Loan-product check · same deal, 3 products live
Conventional
25% down · 7.5% · 30yr
- Down + closing
- —
- Monthly P&I
- —
- Monthly cashflow
- —
- DSCR
- —
- Eligible?
- —
Personal DTI + credit; lowest rate.
DSCR
20% down · 8.5% · 30yr
- Down + closing
- —
- Monthly P&I
- —
- Monthly cashflow
- —
- DSCR
- —
- Eligible?
- —
No personal income docs; deal must DSCR.
Hard money
10% down · 12.0% · 12mo
- Down + closing
- —
- Monthly P&I
- —
- Monthly cashflow
- —
- DSCR
- —
- Eligible?
- —
Short-term bridge; refi at stabilization.
Rent comps 4 comps
| Address | Beds | Baths | Sqft | Rent | $/sqft | DOM | Units | Dist |
|---|---|---|---|---|---|---|---|---|
| 917 Birch St Ashland, OH | 3.0 | 1.0 | 1116 | $1,175 | $1.05 | 43d | 1 | 0.21mi |
| 318 Quarry St Unit 4 Ashland, OH | 2.0 | 1.0 | 750 | $800 | $1.07 | 43d | 1 | 0.60mi |
| 222 E Walnut St Unit 212 Ashland, OH | 2.0 | 1.0 | 970 | $900 | $0.93 | 43d | 1 | 0.62mi |
| 332 Sloan Ave Ashland, OH | 3.0 | 1.5 | 1120 | $1,300 | $1.16 | 43d | 1 | 1.34mi |
Listing history 12 events
-
2026-06-19days on market $1 Active 18 DOM
-
2026-06-18days on market $1 Active 17 DOM
-
2026-06-17days on market $1 Active 16 DOM
-
2026-06-16days on market $1 Active 15 DOM
-
2026-06-15days on market $1 Active 14 DOM
-
2026-06-14days on market $1 Active 12 DOM
-
2026-06-12days on market $1 Active 11 DOM
-
2026-06-09days on market $1 Active 8 DOM
-
2026-06-08days on market $1 Active 7 DOM
-
2026-06-07days on market $1 Active 6 DOM
-
2026-06-02remarks 535-char remark
-
2026-06-02$1 Active 1 DOM
ⓘ Source: listings_history table (triggers on properties + properties_extension) + one-shot
backfill from property_details.listing_events for pre-trigger history.
Climate risk First Street
- Flood 1/10 Low FEMA zone X (unshaded) · 0% chance over 30 yrs
- Wildfire 1/10 Low
- Heat 3/10 Moderate 7 d/yr ≥97°F today · 16 d/yr by 30 yrs out
- Wind 2/10 Low
- Air quality 2/10 Low 1 unhealthy d/yr today · 2 by 30 yrs out
Nearby sold comps map
Loading sold comps map…
Walkable amenities ~0.75 mi
Loading nearby amenities…
Taxation est. · year 1
- Rental income
- $13,154
- − Mortgage interest
- −$8,626
- − Property taxes
- −$2,310
- − Insurance
- −$770
- − Repairs & maintenance
- −$1,052
- − Management
- −$1,052
- − Depreciation
- −$4,480
- Taxable loss
- −$5,137
- Est. tax savings @ 24.0%
- +$1,233
- After-tax cash flow
- $-1,147/yr
For passive investors: Depreciation is non-cash, so a rental often shows a tax loss while cash-flowing — sheltering income. Rental losses are passive: they offset passive income freely, and up to $25,000/yr can offset ordinary (W-2) income if you actively participate and your MAGI is under $100k (phasing out to $0 by $150k); unused losses carry forward. On sale, claimed depreciation is recaptured at up to 25%, and gains may owe capital-gains tax (a 1031 exchange can defer both). Figures are a year-1 estimate at your 24.0% rate — not tax advice; consult a CPA.
Schools (NCES district)
- District
- Ashland City
- NCES district ID
- 3904350
- Math proficiency
- 70% ▼ -2.00%
- Reading proficiency
- 69% ▼ -4.00%
- Median HH income
- $43,164
- Composite
- 58.31/100
- National rank
- #1015
- State rank
- #165 of 656 in OH
Livability — Ashland
- Score
- 72/100
- State rank
- #373
- US rank
- #6095
Category grades
Schools grade is shown separately in the Schools card above.
Census & demographics
- Census place
- Ashland, OH
- County
- Ashland County · 30,805 people
- City population
- 30,805
- Metro
- Ashland, OH
- Population (ZIP)
- 30,805
- Household income
- $68,299
- Rent vs Own
- Severe rent burden
- 706.0
Population outlook (Ashland County) Hauer SSP2
- Today (2025)
- 52,732 people
- By 2030
- 51,728 · -1.9%
- By 2040
- 48,956 · -7.2%
- By 2050
- 46,070 · -12.6%
- By 2075
- 38,945 · -26.1%
- By 2100
- 30,883 · -41.4%
Race, ethnicity, and origin ACS 2023
- Neighborhood character
- Predominantly White (93%)
- Race & ethnicity
- White 93% Two or more races 3% Black 2% Hispanic / Latino 2%
- Common ancestry
- Italian 2% Romanian 2% Slovak 2%
- Foreign-born
- 1% · Canada
- Languages at home
- 95% English-only · German/W. Germanic 4% Spanish 1%
Political lean MEDSL · Ashland
- 2024 margin
- Solid R (+50.0) · D 24.5% · R 74.5%
- 2008→2024 swing
- -26.7pp toward R · 2008: -23.3pp · 2024: -50.0pp
- All cycles
- 2024: R+50.0 2020: R+48.7 2016: R+47.8 2012: R+30.0 2008: R+23.3
Not yet ingested
- Civics
- —
Market trends
- HPI YoY
- ▼ -196.79%
- Current HPI
- 201.96
- Rent YoY
- ▲ 7.07%
- Metro
- Ashland, OH
- State GDP YoY
- ▲ 1.98%
- F500 in state
- 48
Industry mix (Fortune 500 HQ in OH)
| Industry | F500 HQs | Revenue |
|---|---|---|
| Insurance | 3 | $145B |
|
||
| Industrial Machinery | 3 | $49B |
|
||
| Financial Services | 3 | $24B |
|
||
| Consumer Goods | 2 | $93B |
|
||
| Aerospace / Defense | 2 | $47B |
|
||
| Utilities | 2 | $33B |
|
||
Price history
2 events — show timeline
- 2026-06-02 Listed $1 ABOR
- 1976-11-15 Sold (Public Records) $14,500 Public Records
Property tax history
+0.9%/yrLatest (2025): $259 · +5.0% YoY. Source: county tax records.
Cash-flow waterfall
monthlySold comps — $/sqft
last 12 mo · ≤1 miLoading sold comps…