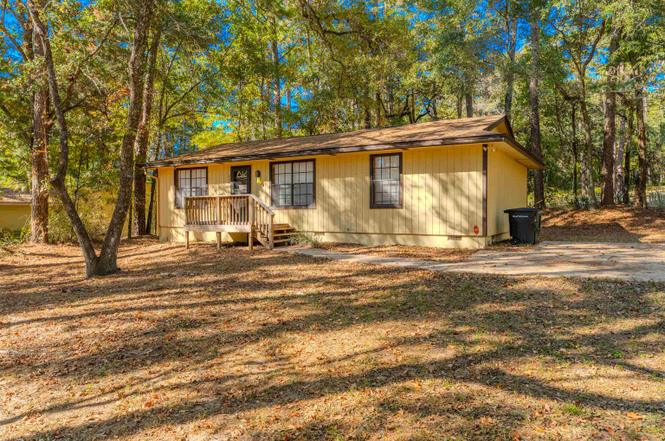
2424 Jolene Ln · Tallahassee, FL
Flood risk 1/10 · Minimal
- FEMA flood zone
- X (unshaded)
- Chance of flooding over 30 yrs
- 0.0%
- Est. flood insurance / yr
- $507 – $1,088
Fire risk 2/10 · Minimal
- Est. fire insurance / yr
- $947 – $1,759
Heat risk 8/10 · Major
- Hot days now (above 108°F)
- 7 days/yr
- Hot days in 30 yrs
- 20 days/yr
Wind risk 9/10 · Severe
- Chance of severe wind over 30 yrs
- 99.0%
Air-quality risk 5/10 · Moderate
- Unhealthy air days now
- 7 days/yr
- Unhealthy air days in 30 yrs
- 7 days/yr
Risk factors via First Street. Map © Google.
Why this score? — see what drove the D+ grade
The composite is a weighted blend of 9 inputs, each scored 0–100. Each bar is that input's sub-score; the figure is the points it added to the 100-point composite (weight × sub-score).
- ARV discount +14.9/15.0
- Cash flow +11.8/30.0
- Schools +4.3/10.0
- Livability +4.3/5.0
- 1% rule +3.6/10.0
- DSCR +3.5/10.0
- Rent growth +3.3/5.0
- Condition / age +2.5/5.0
- Appreciation +0.0/10.0
$175,000
🖨 Deal sheet 📄 Offer letter ✓ Due diligence
Listing remarks
Quaint Home ready and waiting for a new Family: This home is offered at an affordable price. The corner lot provides extra yard space and has easy access to public transportation. New owners will enjoy a NEW ROOF over their head with architectural shingles AND the comfort and peace of mind only a NEW HVAC system delivers. POPULAR FLOOR PLAN - Split layout offers a primary sleeping quarters with en suite bathroom on the left side of the home and 2 guest / children’s rooms on the right side with the Living areas centered cozily between the bedrooms. The front door opens to the Living room, that feels expansive and flows to the dining room which connects to the galley kitchen in the rear
Key facts
- Mature canopies
- Kitchen sink window
- New roof
Tags
Property features AI
Finance
- Other: Property listed for sale
- HOA & community: Association fee $150
Exterior
- Parking: Driveway; Off-street parking spaces
- Utilities: Electric heating and cooling
- Home design: Single-story; Wood siding; Crawlspace foundation
- Construction: Wood siding construction
- Exterior features: Patio; Paved road access; Lot dimensions 72 x 54 x 120 x 50
Interior
- Kitchen: Dishwasher; Oven; Range; Refrigerator; Kitchen (7 x 7)
- Bedrooms: Bedroom 2 (11 x 10); Bedroom 3 (11 x 8)
- Flooring: Carpet; Vinyl
- Bathrooms: 2 full bathrooms
- Heating & cooling: Central heating (electric); Central air conditioning; Ceiling fans
- Interior features: Split bedrooms
- Laundry & utility: Utility room (13 x 11)
Neighborhood map
What this means for you Summary
Snapshot
- This is a 3-bed/2.0-bath single-family listed at $175k.
Deal economics
- At list price, monthly cash flow is $-49 ($-588/yr) — negative.
- To cash-flow at today's rent, offer at most $166k (4.9% below list).
- To meet the 1% rule (rent ≥ 1% of price), the offer needs to be $150k (14.1% below list).
- Recommended offer: $150k (14.1% below list) — sets the bar for 1% rule.
- Cap rate 6.0% vs local median 4.2% in Tallahassee — top-decile yield for the area; either an underpriced asset or a hidden risk that comps aren't pricing in. Stress-test before assuming the spread holds.
Location & tenants
- Location reads 86/100 on livability (#19 in FL, #429 nationally) — a professional / high-income tenant draw. Strengths: amenities A+, commute A+, health & safety A+; Watch: employment D.
- Leon (urban): math 48% / reading 53% proficiency, ranked #33 of 73 in FL (top 45%) — acceptable for families but not a draw, mixed tenant base, ~2y average lease.
- Market conditions: Rents rising (+3.1%/yr); 238 active listings in the ZIP; 40 comparable units currently listed for rent nearby; rentals at typical pace (median 22d on market — plan ~3-4 weeks tenant-placement turnaround); 1,765 units permitted in Leon County in 2024 (975 in 5+ unit buildings).
Forward outlook
- Local home prices are declining (-3.0%/yr); year-one equity from $1k of loan paydown is wiped out by about $5k of value loss. Plan a longer hold.
- Leon County population projected at +23% by 2050 — long-run rental-demand tailwind backs the buy-and-hold thesis.
Negotiation context
- It's been on market 212 days — a 12% lower offer ($154k) is reasonable based on typical stale-listing flexibility.
Risks & watch-outs
- Climate carrying-cost: severe wind risk, 99% chance of damaging wind over 30y; extreme-heat days projected 7→20/yr by 2055 (HVAC capex compounding) — expect insurance premiums to compound above CPI over the hold.
Questions for the listing agent
- What do current leases actually rent for vs. the listed asking? Can we see a recent rent roll and the last 12 months of T-12 income?
- It's been on market 212 days. Have you received any prior offers? Is the seller open to a 14% concession, seller financing, or rate buy-down credit?
- What does the HOA fee cover, when was the last increase, and are there any pending special assessments or reserve-fund shortfalls?
- Why hasn't it sold? Are there any deal-killer items the seller is aware of (foundation, flood, title, zoning, code violations)?
- Is there a deadline driving the sale (1031 exchange, divorce, estate, relocation)? That informs how much negotiation room exists.
- Schools are B-rated — typically a magnet for longer-tenancy family renters. What's the average tenant stay here, and is there a school-zone premium baked into asking?
- The area grade is low — what's the realistic commute time and amenity access for the typical tenant pool here? Any planned neighborhood developments (good or bad) we should know about?
- What's the average days-on-market for RENTAL listings here right now (not sales)? A rising rental-DOM trend means longer vacancies and softer asking-rent achievability than the comps imply.
- What's the recent tenant-quality profile in this submarket — average credit score on applications, eviction rate, late-payment / NSF rate, and stable-employment percentage? A property-management company in the area should have these aggregated.
- How much new for-sale + rental construction is in the pipeline within 1–3 miles? Heavy new supply typically softens prices + rents 12–24 months out; constrained supply supports both.
Investment metrics
- 1% rule
- 0.86% ✗
- Cap rate
- 5.96%
- Cash-on-cash
- -1.20%
- DSCR
- 0.95
- GRM
- 9.7
CMA / ARV
- ARV (on-the-fly)
- $209,250
- Comps found
- 12
Show comp detail 12 sales within ~0.75 mi
| Address | Dist | Beds/Ba | Sqft | Sold | Price | $/sf | Match |
|---|---|---|---|---|---|---|---|
| 2253 Nannas Loop | 0.12mi | 3/2.0 | 1,080 (-4%) | 5mo | $210,000 | $194 | 84 |
| 2113 Bullocks Run Rd | 0.33mi | 3/2.0 | 1,182 (+5%) | 3mo | $245,000 | $207 | 74 |
| 1949 Rob Way | 0.29mi | 3/2.0 | 1,232 (+10%) | 3mo | $235,000 | $191 | 68 |
| 2318 Cumberland Dr | 0.63mi | 3/2.0 | 1,200 (+7%) | 1mo | $245,000 | $204 | 59 |
| 2018 Fannie Dr | 0.58mi | 3/1.0 | 1,189 (+6%) | 1mo | $205,000 | $172 | 59 |
| 2613 Faversham Dr | 0.66mi | 3/2.0 | 1,183 (+5%) | 5mo | $220,000 | $186 | 57 |
| 2540 W Tharpe St | 0.65mi | 3/1.0 | 1,104 (-2%) | 8mo | $130,000 | $118 | 56 |
| 2893 Duffton Loop | 0.73mi | 3/2.0 | 1,200 (+7%) | 3mo | $253,000 | $211 | 52 |
| 1828 Mayfair Rd | 0.64mi | 3/2.0 | 1,230 (+9%) | 4mo | $206,500 | $168 | 51 |
| 2747 Faringdon Dr | 0.62mi | 2/2.0 (-1) | 1,056 (-6%) | 8mo | $180,000 | $170 | 49 |
| 1914 Fannie Dr | 0.65mi | 3/1.0 | 1,200 (+7%) | 8mo | $190,000 | $158 | 48 |
| 2008 Sheridan Rd | 0.70mi | 3/2.0 | 1,288 (+14%) | 3mo | $209,900 | $163 | 41 |
Match score weights: distance 35% · size 25% · config 20% · recency 20%. Top-matched comps best support the ARV.
Projected returns pro-forma
-3.0% appreciation · 3.12% rent growth · sell at horizon
- IRR
- -18.1%
- Equity multiple
- 0.36×
- Total profit
- $-31,256
- Equity at exit
- $26,093
- IRR
- -10.1%
- Equity multiple
- 0.38×
- Total profit
- $-30,329
- Equity at exit
- $15,131
Cash invested: $49,000 (down + closing). Projections, not guarantees.
Landlord ↔ Tenant lean methodology
- Overall (STATE)
- 87 Strongly Landlord-Friendly
- State Florida
- 87 Strongly Landlord-Friendly · R+3
- County
- — inherits STATE
- City
- — inherits STATE
ZIP-level market 32303
- Rents YoY
- 3.1%
- Active inventory
- 238
- Price-to-rent
- 9.7×
Monthly cashflow live
- Estimated rent
- $1,502 high interval (Pro) →
- Mortgage (P&I)
- −$918
- Tax from tax record
- −$232 /mo · $2,787/yr
- Insurance
- −$73
- HOA
- −$13
- Vacancy / Maint / Mgmt
- −$316
- Net cashflow
- $-49
Break-even live
UW: 25.0% down · 7.5% · 30yr · 1.5% tax · 5.0% vac · 8.0% maint · 8.0% mgmt
Financing live
Cash to close
- Down payment
- $43,750
- Closing costs
- $5,250
- Reserves months
- —
- Total cash needed
- —
Loan-product check · same deal, 3 products live
Conventional
25% down · 7.5% · 30yr
- Down + closing
- —
- Monthly P&I
- —
- Monthly cashflow
- —
- DSCR
- —
- Eligible?
- —
Personal DTI + credit; lowest rate.
DSCR
20% down · 8.5% · 30yr
- Down + closing
- —
- Monthly P&I
- —
- Monthly cashflow
- —
- DSCR
- —
- Eligible?
- —
No personal income docs; deal must DSCR.
Hard money
10% down · 12.0% · 12mo
- Down + closing
- —
- Monthly P&I
- —
- Monthly cashflow
- —
- DSCR
- —
- Eligible?
- —
Short-term bridge; refi at stabilization.
Rent comps 40 comps
| Address | Beds | Baths | Sqft | Rent | $/sqft | DOM | Units | Dist |
|---|---|---|---|---|---|---|---|---|
| 2403 Hartsfield Rd #602 Tallahassee, FL | 3.0 | 3.0 | 1216 | $1,350 | $1.11 | 21d | 1 | 0.08mi |
| 2403 Hartsfield Rd #602 Tallahassee, FL | 3.0 | 3.0 | 1216 | $1,350 | $1.11 | 14d | 1 | 0.08mi |
| 2406 Hartsfield Rd Tallahassee, FL | 3.0 | 3.0 | 1216 | $1,350 | $1.11 | 21d | 1 | 0.08mi |
| 2350 Wanda Way Tallahassee, FL | 2.0–3.0 | 1.0 | 861 | $1,400 | $1.63 | 21d | 1 | 0.32mi |
| 2419 Nugget Ln Tallahassee, FL | 3.0 | 2.0 | 1212 | $1,550 | $1.28 | 14d | 1 | 0.33mi |
| 2498 Nugget Ln Tallahassee, FL | 3.0 | 2.0 | 1200 | $1,550 | $1.29 | 21d | 1 | 0.36mi |
| 2412 Atlas Rd Tallahassee, FL | 3.0 | 1.5 | 1081 | $1,200 | $1.11 | 21d | 1 | 0.36mi |
| 2401 Atlas Rd Unit B Tallahassee, FL | 2.0 | 1.0 | 900 | $1,100 | $1.22 | 21d | 1 | 0.39mi |
| 2052 Darnell Cir Unit B Tallahassee, FL | 4.0 | 3.0 | 1300 | $1,700 | $1.31 | 21d | 1 | 0.40mi |
| 2022 Trimble Rd Apt 3 Tallahassee, FL | 3.0 | 3.0 | 1192 | $700 | $0.59 | 21d | 1 | 0.52mi |
| 2327 Parrot Ln Tallahassee, FL | 3.0 | 2.0 | 1088 | $1,300 | $1.19 | 21d | 1 | 0.60mi |
| 2259 Parrot Ln Tallahassee, FL | 2.0 | 2.0 | 992 | $1,275 | $1.29 | 21d | 1 | 0.61mi |
| 2660 Old Bainbridge Rd Tallahassee, FL | 3.0 | 2.5 | 1196 | $1,550 | $1.30 | 21d | 2 | 0.73mi |
| 2626 Faversham Dr Tallahassee, FL | 3.0 | 2.0 | 1440 | $1,850 | $1.28 | 14d | 1 | 0.74mi |
| 1560 San Luis Rd Tallahassee, FL | 3.0 | 3.5 | 1500 | $774 | $0.52 | 21d | 22 | 0.78mi |
| 2222 Del Carmel Way Tallahassee, FL | 3.0 | 3.0 | 1280 | $1,650 | $1.29 | 14d | 1 | 0.84mi |
| 1818 Sylvan Ct Unit D Tallahassee, FL | 2.0 | 1.0 | 850 | $1,200 | $1.41 | 14d | 1 | 0.85mi |
| 2222 Del Carmel Way Unit 2226 Tallahassee, FL | 3.0 | 3.0 | 1280 | $1,650 | $1.29 | 21d | 1 | 0.85mi |
| 2749 Pecan Rd Tallahassee, FL | 1.0–2.0 | 1.0–2.0 | 900 | $1,300 | $1.44 | 14d | 1 | 0.86mi |
| 2281 Del Carmel Way Tallahassee, FL | 3.0 | 3.0 | 1280 | $1,599 | $1.25 | 21d | 1 | 0.88mi |
| 2772 Westbrook Ct Tallahassee, FL | 3.0 | 3.0 | 1325 | $1,600 | $1.21 | 14d | 1 | 0.92mi |
| 2677 Old Bainbridge Rd Tallahassee, FL | 1.0–3.0 | 1.5–3.5 | 1395 | $1,683 | $1.21 | 14d | 28 | 0.93mi |
| 1600 Pullen Rd Tallahassee, FL | 1.0–2.0 | 1.0–2.0 | 875 | $1,345 | $1.54 | 14d | 1 | 0.98mi |
| 2765 W Tharpe St Tallahassee, FL | 1.0–2.0 | 1.0 | 739 | $1,000 | $1.35 | 14d | 1 | 1.00mi |
| 2520 Graves Rd #103 Tallahassee, FL | 3.0 | 3.0 | 1216 | $1,350 | $1.11 | 21d | 1 | 1.05mi |
| 1571 Stone Rd Unit 5B Tallahassee, FL | 2.0 | 2.5 | 1216 | $1,795 | $1.48 | 21d | 1 | 1.09mi |
| 2616 Mission Rd Tallahassee, FL | 1.0–2.0 | 1.0 | 750 | $1,195 | $1.59 | 14d | 12 | 1.12mi |
| 2309 Old Bainbridge Rd Tallahassee, FL | 1.0–2.0 | 1.0–2.0 | 798 | $1,420 | $1.78 | 14d | 10 | 1.14mi |
| 1360 Ocala Rd Tallahassee, FL | 2.0 | 1.0 | 800 | $1,000 | $1.25 | 21d | 1 | 1.15mi |
| 2400 Fred Smith Rd #201 Tallahassee, FL | 3.0 | 3.0 | 1353 | $1,650 | $1.22 | 21d | 1 | 1.17mi |
| 2301 Old Bainbridge Rd Tallahassee, FL | 2.0–3.0 | 1.0–2.0 | 1084 | $1,600 | $1.48 | 21d | 1 | 1.20mi |
| 1557 Devoe St Unit 2 Tallahassee, FL | 2.0 | 1.0 | 750 | $1,350 | $1.80 | 21d | 1 | 1.21mi |
| 1350 Ocala Rd Unit C Tallahassee, FL | 4.0 | 3.0 | 1142 | $1,550 | $1.36 | 21d | 1 | 1.22mi |
| 1447 Stone Rd Tallahassee, FL | 1.0–3.0 | 1.0–2.0 | 890 | $1,545 | $1.74 | 21d | 1 | 1.23mi |
| 1303 Ocala Rd Tallahassee, FL | 1.0–4.0 | 1.0–2.0 | 1121 | $1,445 | $1.29 | 14d | 48 | 1.25mi |
| 2614 W Tennessee St Tallahassee, FL | 1.0–4.0 | 1.0–4.0 | 1270 | $1,556 | $1.22 | 21d | 14 | 1.28mi |
| 3875 Gaffney Loop Tallahassee, FL | 2.0 | 2.0 | 984 | $1,300 | $1.32 | 21d | 1 | 1.29mi |
| 2060 Continental Ave Tallahassee, FL | 1.0–3.0 | 1.0–2.5 | 1121 | $1,185 | $1.06 | 14d | 26 | 1.36mi |
| 2353 W Mission Rd Tallahassee, FL | 2.0–3.0 | 2.0–2.5 | 1012 | $1,450 | $1.43 | 14d | 11 | 1.37mi |
| 1955 Bloomington Ave Tallahassee, FL | 3.0 | 3.0 | 1177 | $1,475 | $1.25 | 21d | 1 | 1.46mi |
HOA detail
- Monthly dues
- $13 · $156/yr
Listing history 18 events
-
2026-06-18days on market $175,000 Active 212 DOM
-
2026-06-17days on market $175,000 Active 211 DOM
-
2026-06-16days on market $175,000 Active 210 DOM
-
2026-06-15days on market $175,000 Active 209 DOM
-
2026-06-14days on market $175,000 Active 207 DOM
-
2026-06-10days on market $175,000 Active 204 DOM
-
2026-06-09days on market $175,000 Active 203 DOM
-
2026-06-08days on market $175,000 Active 202 DOM
-
2026-06-07days on market $175,000 Active 201 DOM
-
2026-06-05days on market $175,000 Active 198 DOM
-
2026-06-03days on market $175,000 Active 197 DOM
-
2026-06-02days on market $175,000 Active 196 DOM
-
2026-06-01days on market $175,000 Active 195 DOM
-
2026-05-31days on market $175,000 Active 194 DOM
-
2026-05-30days on market $175,000 Active 193 DOM
-
2026-05-07price $175,000
-
2026-03-27price $185,000
-
2025-11-18$200,000 Active
ⓘ Source: listings_history table (triggers on properties + properties_extension) + one-shot
backfill from property_details.listing_events for pre-trigger history.
Tax reassessment forecast FL · Resets to sale price
- Current annual tax
- $2,787 · $232/mo
- Projected year-2 tax
- $2,787 · $232/mo
- Expected delta
- $0/yr ($0/mo · 0.0%)
ⓘ Screening estimate from a state-policy table — verify with the county assessor before closing.
Climate risk First Street
- Flood 1/10 Low FEMA zone X (unshaded) · 0% chance over 30 yrs
- Wildfire 2/10 Low
- Heat 8/10 Severe 7 d/yr ≥108°F today · 20 d/yr by 30 yrs out
- Wind 9/10 Extreme 99% chance of damaging wind over 30 yrs
- Air quality 5/10 Major 7 unhealthy d/yr today · 7 by 30 yrs out
Nearby sold comps map
Loading sold comps map…
Walkable amenities ~0.75 mi
Loading nearby amenities…
Taxation est. · year 1
- Rental income
- $18,029
- − Mortgage interest
- −$9,803
- − Property taxes
- −$2,787
- − Insurance
- −$875
- − Repairs & maintenance
- −$1,442
- − Management
- −$1,442
- − HOA
- −$156
- − Depreciation
- −$5,091
- Taxable loss
- −$3,567
- Est. tax savings @ 24.0%
- +$856
- After-tax cash flow
- $268/yr
For passive investors: Depreciation is non-cash, so a rental often shows a tax loss while cash-flowing — sheltering income. Rental losses are passive: they offset passive income freely, and up to $25,000/yr can offset ordinary (W-2) income if you actively participate and your MAGI is under $100k (phasing out to $0 by $150k); unused losses carry forward. On sale, claimed depreciation is recaptured at up to 25%, and gains may owe capital-gains tax (a 1031 exchange can defer both). Figures are a year-1 estimate at your 24.0% rate — not tax advice; consult a CPA.
Schools (NCES district)
- District
- Leon
- NCES district ID
- 1201110
- Math proficiency
- 48% ▼ -13.00%
- Reading proficiency
- 53% ▼ -5.00%
- Median HH income
- $46,339
- Composite
- 42.84/100
- National rank
- #3131
- State rank
- #33 of 73 in FL
Livability — Tallahassee
- Score
- 86/100
- State rank
- #19
- US rank
- #429
Category grades
Schools grade is shown separately in the Schools card above.
Census & demographics
- Census place
- Tallahassee, FL
- County
- Leon County · 294,472 people
- City population
- 294,472
- Metro
- Tallahassee, FL
- Population (ZIP)
- 49,785
- Household income
- $62,275
- Rent vs Own
- Severe rent burden
- 2919.0
Population outlook (Leon County) Hauer SSP2
- Today (2025)
- 315,507 people
- By 2030
- 330,677 · +4.8%
- By 2040
- 358,465 · +13.6%
- By 2050
- 386,804 · +22.6%
- By 2075
- 465,480 · +47.5%
- By 2100
- 519,959 · +64.8%
Race, ethnicity, and origin ACS 2023
- Neighborhood character
- Diverse neighborhood (Simpson 0.63)
- Race & ethnicity
- White 50% Black 34% Hispanic / Latino 8% Two or more races 8% Asian 3%
- Hispanic origin (detail)
- Mexican 2% Puerto Rican 1% Cuban 2%
- Common ancestry
- Slovak 2% Italian 1% Lithuanian 1%
- Foreign-born
- 8% · Canada, Vietnam, China
- Languages at home
- 89% English-only · Spanish 5% Arabic 1% French/Haitian/Cajun 1%
Political lean MEDSL · Leon
- 2024 margin
- Strong D (+21.8) · D 60.3% · R 38.5% · Other 1.2%
- 2008→2024 swing
- -2.5pp toward R · 2008: 24.3pp · 2024: 21.8pp
- All cycles
- 2024: D+21.8 2020: D+28.3 2016: D+25.1 2012: D+23.6 2008: D+24.3
Not yet ingested
- Civics
- —
Market trends
- HPI YoY
- ▼ -255.24%
- Current HPI
- 241.3131
- Rent YoY
- ▲ 3.12%
- Metro
- Tallahassee, FL
- State GDP YoY
- ▲ 3.28%
- F500 in state
- 36
Industry mix (Fortune 500 HQ in FL)
| Industry | F500 HQs | Revenue |
|---|---|---|
| Industrial Technology | 2 | $29B |
|
||
| Insurance | 2 | $17B |
|
||
| Retail | 1 | $60B |
|
||
| Technology Distribution | 1 | $58B |
|
||
| Homebuilding | 1 | $35B |
|
||
| Technology Manufacturing | 1 | $35B |
|
||
Price history
-12.5% since first listed3 events — show timeline
- 2026-05-07 Price Changed $175,000 CATRS
- 2026-03-27 Price Changed $185,000 CATRS
- 2025-11-18 Listed $200,000 CATRS
Property tax history
+6.1%/yrLatest (2025): $2,787 · +7.9% YoY. Source: county tax records.
Cash-flow waterfall
monthlySold comps — $/sqft
last 12 mo · ≤1 miLoading sold comps…