 🏷️ Likely Rental
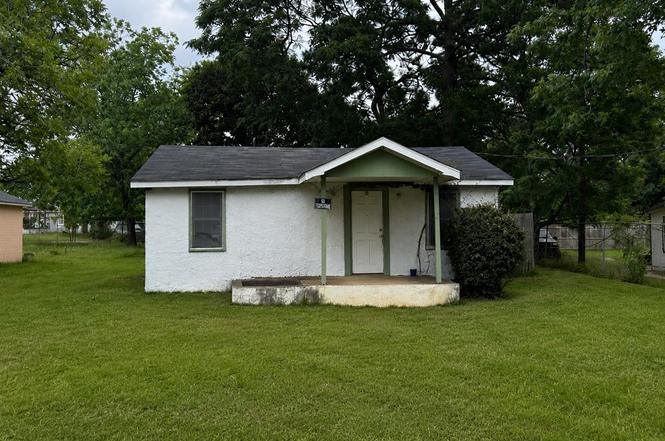
805 Armour Rd · Tifton, GA
Flood risk 1/10 · Minimal
- FEMA flood zone
- X (unshaded)
- Chance of flooding over 30 yrs
- 0.0%
- Est. flood insurance / yr
- $507 – $1,088
Fire risk 5/10 · Moderate
- Est. fire insurance / yr
- $963 – $1,789
Heat risk 8/10 · Major
- Hot days now (above 108°F)
- 7 days/yr
- Hot days in 30 yrs
- 21 days/yr
Wind risk 8/10 · Major
- Chance of severe wind over 30 yrs
- 99.0%
Air-quality risk 3/10 · Minor
- Unhealthy air days now
- 3 days/yr
- Unhealthy air days in 30 yrs
- 3 days/yr
Risk factors via First Street. Map © Google.
Why this score? — see what drove the B- grade
The composite is a weighted blend of 9 inputs, each scored 0–100. Each bar is that input's sub-score; the figure is the points it added to the 100-point composite (weight × sub-score).
- Cash flow +30.0/30.0
- 1% rule +10.0/10.0
- DSCR +10.0/10.0
- ARV discount +7.5/15.0
- Livability +3.6/5.0
- Rent growth +2.5/5.0
- Schools +2.5/10.0
- Condition / age +2.5/5.0
- Appreciation +0.0/10.0
$59,900
🖨 Deal sheet 📄 Offer letter ✓ Due diligence
Listing remarks
Solid block construction in town. Currently rented. Great investment property with long-term, paying tenant.
Key facts
- 5,663 sq ft lot
- Built 1940
- Listed 3 days
Property features AI
Finance
- Financial info: Financial details not provided
- HOA & community: HOA information not provided
Exterior
- Parking: Parking details not provided
- Security: Security features not provided
- Utilities: Public water; Public sewer
- Home design: Single-family residence; Residential property
- Construction: Block construction; Metal roof
- Exterior features: Front porch
Interior
- Kitchen: Electric range; Refrigerator
- Bedrooms: Information not provided
- Flooring: Carpet; Vinyl
- Bathrooms: 1 full bathroom
- Heating & cooling: Window unit(s) for cooling
- Interior features: Electric water heater; 4 total rooms
- Laundry & utility: Washer/dryer details not provided
Neighborhood map
What this means for you Summary
Snapshot
- This is a 2-bed/2.0-bath single-family listed at $60k.
Deal economics
- At list price, monthly cash flow is $610 ($7k/yr) — positive.
- The deal already cash-flows at list — no discount required.
- Meets the 1% rule at list price ($1k rent vs $60k).
- Cap rate 18.5% vs local median 3.2% in Tifton — top-decile yield for the area; either an underpriced asset or a hidden risk that comps aren't pricing in. Stress-test before assuming the spread holds.
Location & tenants
- Location reads 72/100 on livability (#69 in GA) — a middle-class / working-renter tenant base. Strengths: cost of living A+, health & safety A+; Watch: crime D, schools D-, commute F.
- Tift County (town): math 30% / reading 31% proficiency, ranked #96 of 174 in GA (top 55%) — families likely to look elsewhere, expect single-tenant / working-renter base with shorter leases; 62% free/reduced lunch — lower-income household profile, screen leases tightly.
- Market conditions: 138 active listings in the ZIP; 3 comparable units currently listed for rent nearby; rentals lingering (median 44d on market — plan ~5-8 weeks vacancy on turnover, expect pricing pressure); 100% of comp listings sitting > 30 days — soft ceiling on asking rent; 176 units permitted in Tift County in 2024 (60 in 5+ unit buildings).
- This rent runs 32% of the median local income ($46k/yr) — at the standard rent-burdened threshold; future hikes will face affordability resistance.
Forward outlook
- Local home prices are declining (-3.0%/yr); year-one equity from $414 of loan paydown is wiped out by about $2k of value loss. Plan a longer hold.
- Tift County population projected to shrink 3% by 2050 — rents likely to lag national; underwrite the cash flow, not the appreciation.
- At projected returns (-3.0% appreciation + 3.0% rent growth), your $17k cash investment doubles in ~3 years — after that, you're playing with house money.
Negotiation context
- Only 4 days on market — expect competitive offers; lowballing is unlikely to land.
Risks & watch-outs
- Watch-outs: built in 1940 — expect roof / HVAC / electrical / plumbing capex.
- Climate carrying-cost: severe wind risk, 99% chance of damaging wind over 30y; moderate wildfire risk; extreme-heat days projected 7→21/yr by 2055 (HVAC capex compounding) — expect insurance premiums to compound above CPI over the hold.
Questions for the listing agent
- Built in 1940 — when were the roof, HVAC, electrical panel, plumbing, and water heater last replaced?
- Is there a deadline driving the sale (1031 exchange, divorce, estate, relocation)? That informs how much negotiation room exists.
- Schools are D-rated, which usually means shorter tenancies and higher turnover. Who's the typical renter profile here, and what's been the actual vacancy rate?
- Crime grade is D in this area — have there been break-ins, vandalism, or insurance claims at this property in the last 3 years? What carrier currently insures it and at what premium?
- What's the average days-on-market for RENTAL listings here right now (not sales)? A rising rental-DOM trend means longer vacancies and softer asking-rent achievability than the comps imply.
- What's the recent tenant-quality profile in this submarket — average credit score on applications, eviction rate, late-payment / NSF rate, and stable-employment percentage? A property-management company in the area should have these aggregated.
- How much new for-sale + rental construction is in the pipeline within 1–3 miles? Heavy new supply typically softens prices + rents 12–24 months out; constrained supply supports both.
Investment metrics
- 1% rule
- 2.08% ✓
- Cap rate
- 18.51%
- Cash-on-cash
- 43.64%
- DSCR
- 2.94
- GRM
- 4.0
CMA / ARV
- ARV (on-the-fly)
- $128,016
- Comps found
- 7
Show comp detail 7 sales within ~0.75 mi
| Address | Dist | Beds/Ba | Sqft | Sold | Price | $/sf | Match |
|---|---|---|---|---|---|---|---|
| 1006 Tyson Ave Unit N/A | 0.48mi | 2/1.0 | 1,000 (-1%) | 23mo | $115,000 | $115 | 53 |
| 1006 Tyson Ave | 0.48mi | 2/1.0 | 1,000 (-1%) | 23mo | $115,000 | $115 | 53 |
| 804 E 8th St | 0.29mi | 2/1.0 | 1,140 (+13%) | 11mo | $37,000 | $32 | 52 |
| 809 Belmont | 0.39mi | 3/2.0 (+1) | 1,101 (+9%) | 14mo | $163,000 | $148 | 50 |
| 804 Davis Ave | 0.40mi | 2/1.0 | 1,124 (+12%) | 14mo | $169,900 | $151 | 46 |
| 1008 Belmont Ave | 0.53mi | 3/1.0 (+1) | 1,054 (+5%) | 20mo | $138,000 | $131 | 42 |
| 809 Lee Ave | 0.40mi | 3/1.0 (+1) | 1,104 (+10%) | 23mo | $139,900 | $127 | 37 |
Match score weights: distance 35% · size 25% · config 20% · recency 20%. Top-matched comps best support the ARV.
Projected returns pro-forma
-3.0% appreciation · 3.0% rent growth · sell at horizon
- IRR
- 40.5%
- Equity multiple
- 2.74×
- Total profit
- $29,136
- Equity at exit
- $8,931
- IRR
- 46.8%
- Equity multiple
- 5.49×
- Total profit
- $75,368
- Equity at exit
- $5,179
Cash invested: $16,772 (down + closing). Projections, not guarantees.
Landlord ↔ Tenant lean methodology
- Overall (STATE)
- 90 Strongly Landlord-Friendly
- State Georgia
- 90 Strongly Landlord-Friendly · R+3
- County
- — inherits STATE
- City
- — inherits STATE
ZIP-level market 31794
- Home prices YoY
- -32.1%
- Active inventory
- 138
- Price-to-rent
- 4.0×
Monthly cashflow live
- Estimated rent
- $1,243 medium interval (Pro) →
- Mortgage (P&I)
- −$314
- Tax from tax record
- −$33 /mo · $398/yr
- Insurance
- −$25
- HOA
- −$0
- Vacancy / Maint / Mgmt
- −$261
- Net cashflow
- $610
Break-even live
UW: 25.0% down · 7.5% · 30yr · 1.5% tax · 5.0% vac · 8.0% maint · 8.0% mgmt
Financing live
Cash to close
- Down payment
- $14,975
- Closing costs
- $1,797
- Reserves months
- —
- Total cash needed
- —
Loan-product check · same deal, 3 products live
Conventional
25% down · 7.5% · 30yr
- Down + closing
- —
- Monthly P&I
- —
- Monthly cashflow
- —
- DSCR
- —
- Eligible?
- —
Personal DTI + credit; lowest rate.
DSCR
20% down · 8.5% · 30yr
- Down + closing
- —
- Monthly P&I
- —
- Monthly cashflow
- —
- DSCR
- —
- Eligible?
- —
No personal income docs; deal must DSCR.
Hard money
10% down · 12.0% · 12mo
- Down + closing
- —
- Monthly P&I
- —
- Monthly cashflow
- —
- DSCR
- —
- Eligible?
- —
Short-term bridge; refi at stabilization.
Rent comps 3 comps
| Address | Beds | Baths | Sqft | Rent | $/sqft | DOM | Units | Dist |
|---|---|---|---|---|---|---|---|---|
| 423 Prince Ave Tifton, GA | 2.0 | 1.0 | 900 | $925 | $1.03 | 43d | 1 | 0.28mi |
| 1621 Love Ave Tifton, GA | 2.0 | 2.0 | 1210 | $1,185 | $0.98 | 43d | 1 | 1.18mi |
| 2013 Lee Ave Tifton, GA | 3.0 | 2.0 | 1337 | $3,295 | $2.46 | 43d | 1 | 1.48mi |
Listing history 5 events
-
2026-06-19days on market $59,900 Active 4 DOM
-
2026-06-18days on market $59,900 Active 3 DOM
-
2026-06-17days on market $59,900 Active 2 DOM
-
2026-06-16remarks 108-char remark
-
2026-06-16$59,900 Active 1 DOM
ⓘ Source: listings_history table (triggers on properties + properties_extension) + one-shot
backfill from property_details.listing_events for pre-trigger history.
Tax reassessment forecast GA · Resets to sale price
- Current annual tax
- $398 · $33/mo
- Projected year-2 tax
- $551 · $46/mo
- Expected delta
- +$153/yr (+$13/mo · 38.3%)
ⓘ Screening estimate from a state-policy table — verify with the county assessor before closing.
Climate risk First Street
- Flood 1/10 Low FEMA zone X (unshaded) · 0% chance over 30 yrs
- Wildfire 5/10 Major
- Heat 8/10 Severe 7 d/yr ≥108°F today · 21 d/yr by 30 yrs out
- Wind 8/10 Severe 99% chance of damaging wind over 30 yrs
- Air quality 3/10 Moderate 3 unhealthy d/yr today · 3 by 30 yrs out
Nearby sold comps map
Loading sold comps map…
Walkable amenities ~0.75 mi
Loading nearby amenities…
Taxation est. · year 1
- Rental income
- $14,920
- − Mortgage interest
- −$3,355
- − Property taxes
- −$398
- − Insurance
- −$300
- − Repairs & maintenance
- −$1,194
- − Management
- −$1,194
- − Depreciation
- −$1,743
- Taxable income
- $6,737
- Est. tax owed @ 24.0%
- −$1,617
- After-tax cash flow
- $5,703/yr
For passive investors: Depreciation is non-cash, so a rental often shows a tax loss while cash-flowing — sheltering income. Rental losses are passive: they offset passive income freely, and up to $25,000/yr can offset ordinary (W-2) income if you actively participate and your MAGI is under $100k (phasing out to $0 by $150k); unused losses carry forward. On sale, claimed depreciation is recaptured at up to 25%, and gains may owe capital-gains tax (a 1031 exchange can defer both). Figures are a year-1 estimate at your 24.0% rate — not tax advice; consult a CPA.
Schools (NCES district)
- District
- Tift County
- NCES district ID
- 1304980
- Math proficiency
- 30% ▼ -5.00%
- Reading proficiency
- 31% ▼ -5.00%
- Median HH income
- $37,497
- Composite
- 25.42/100
- National rank
- #7454
- State rank
- #96 of 174 in GA
Livability — Tifton
- Score
- 72/100
- State rank
- #69
- US rank
- #6288
Category grades
Schools grade is shown separately in the Schools card above.
Census & demographics
- Census place
- Tifton, GA
- County
- Tift County · 26,178 people
- City population
- 26,178
- Metro
- Tifton, GA
- Population (ZIP)
- 26,178
- Household income
- $46,056
- Rent vs Own
- Severe rent burden
- 759.0
Population outlook (Tift County) Hauer SSP2
- Today (2025)
- 41,250 people
- By 2030
- 41,146 · -0.3%
- By 2040
- 40,677 · -1.4%
- By 2050
- 39,930 · -3.2%
- By 2075
- 37,078 · -10.1%
- By 2100
- 32,742 · -20.6%
Race, ethnicity, and origin ACS 2023
- Neighborhood character
- Diverse neighborhood (Simpson 0.64)
- Race & ethnicity
- White 46% Black 37% Hispanic / Latino 12% Two or more races 9% Asian 1%
- Hispanic origin (detail)
- Mexican 9%
- Common ancestry
- Slovak 1% Serbian 1% Hispanic 1%
- Foreign-born
- 4% · Canada
- Languages at home
- 89% English-only · Spanish 10% Other Asian/Pacific 0%
Political lean MEDSL · Tift
- 2024 margin
- Solid R (+35.7) · D 32.0% · R 67.7%
- 2008→2024 swing
- -2.8pp toward R · 2008: -32.8pp · 2024: -35.7pp
- All cycles
- 2024: R+35.7 2020: R+33.6 2016: R+37.4 2012: R+32.6 2008: R+32.8
Not yet ingested
- Civics
- —
Market trends
- HPI YoY
- ▼ -82.93%
- Current HPI
- 175.5649
- Rent YoY
- —
- Metro
- Tifton, GA
- State GDP YoY
- ▲ 2.66%
- F500 in state
- 28
Industry mix (Fortune 500 HQ in GA)
| Industry | F500 HQs | Revenue |
|---|---|---|
| Paper / Packaging | 2 | $29B |
|
||
| Retail | 1 | $160B |
|
||
| Transportation / Logistics | 1 | $91B |
|
||
| Airlines | 1 | $62B |
|
||
| Consumer Goods | 1 | $47B |
|
||
| Utilities | 1 | $25B |
|
||
Price history
1 event — show timeline
- 2026-06-15 Listed $59,900 TBOR
Property tax history
+1.0%/yrLatest (2025): $398 · -5.9% YoY. Source: county tax records.
Cash-flow waterfall
monthlySold comps — $/sqft
last 12 mo · ≤1 miLoading sold comps…