6000 County Road 203 #48 · Durango, CO
Flood risk 3/10 · Minor
- FEMA flood zone
- X (unshaded)
- Chance of flooding over 30 yrs
- 0.2%
- Est. flood insurance / yr
- $507 – $1,088
Fire risk 6/10 · Moderate
- Est. fire insurance / yr
- $939 – $1,743
Heat risk 2/10 · Minimal
- Hot days now (above 87°F)
- 9 days/yr
- Hot days in 30 yrs
- 25 days/yr
Wind risk 1/10 · Minimal
- Chance of severe wind over 30 yrs
- —
Air-quality risk 4/10 · Minor
- Unhealthy air days now
- 5 days/yr
- Unhealthy air days in 30 yrs
- 6 days/yr
Risk factors via First Street. Map © Google.
Why this score? — see what drove the B- grade
The composite is a weighted blend of 9 inputs, each scored 0–100. Each bar is that input's sub-score; the figure is the points it added to the 100-point composite (weight × sub-score).
- Cash flow +30.0/30.0
- DSCR +10.0/10.0
- 1% rule +8.6/10.0
- ARV discount +7.4/15.0
- Schools +3.4/10.0
- Livability +3.4/5.0
- Rent growth +3.2/5.0
- Condition / age +2.5/5.0
- Appreciation +0.0/10.0
$167,000
🖨 Deal sheet 📄 Offer letter ✓ Due diligence
Listing remarks
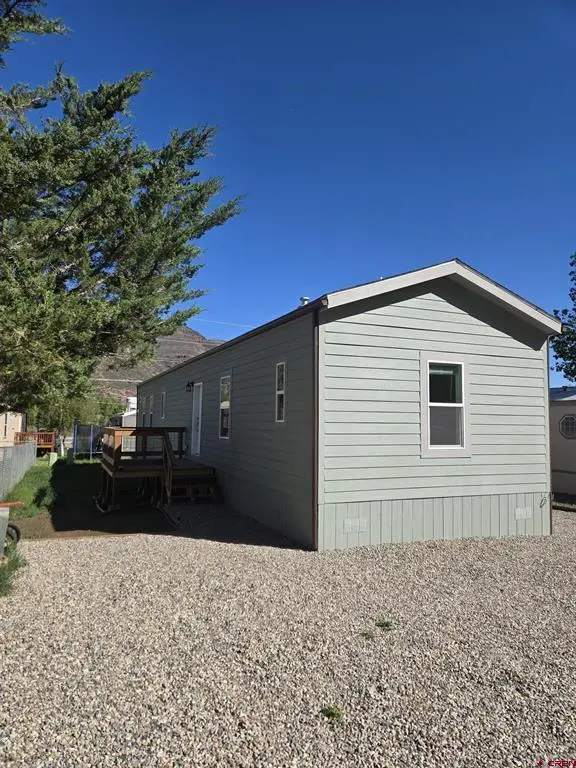
Move-in ready and waiting for it's buyer, this brand-new 3 bedroom, 2 bathroom home sits on a larger lot with county set-up, state set-up, and state electrical inspections completed. A large front porch overlooks the Red Cliffs of Hermosa and provides additional outdoor living space. Inside, the home features wood-inspired LVP flooring and warm-toned cabinetry that create a more natural feel throughout the space. All new Whirlpool appliances are installed, and the primary bedroom includes an ensuite bathroom. Road maintenance and snow removal are included in the park fees. Water is provided by Animas Water at $21/month. Additional costs include $35/month from May through September to suppor
Key facts
- Move-in ready
- Front porch
- Warm-toned cabinetry
Tags
Property features AI
Exterior
- Utilities: Electricity available; Natural gas available; Public water; Public sewer; High speed internet available; Cellular phone reception
- Home design: Single wide mobile home; 1 story; Skirted foundation; Not permanent foundation; Composition roof; Vinyl siding
- Construction: Built with vinyl siding; Composition roof; Skirted foundation; Single wide body type
- Exterior features: Deck; Chain link fencing; Near golf course; Dirt road access; Has view
Interior
- Kitchen: Dishwasher; Disposal; Microwave; Oven; Range; Refrigerator
- Flooring: Partially carpeted; Vinyl
- Bathrooms: 2 full bathrooms
- Heating & cooling: Forced air heating; Natural gas heating; Has heating
- Interior features: Ceiling fan(s); Unfurnished
- Laundry & utility: Washer hookup
Neighborhood map
What this means for you Summary
Snapshot
- This is a 3-bed/2.0-bath manufactured listed at $167k.
Deal economics
- At list price, monthly cash flow is $646 ($8k/yr) — positive.
- The deal already cash-flows at list — no discount required.
- Meets the 1% rule at list price ($2k rent vs $167k).
- Recommended offer: $162k (3.0% below list) — sets the bar for market timing.
- Cap rate 10.9% vs local median 1.1% in Durango — top-decile yield for the area; either an underpriced asset or a hidden risk that comps aren't pricing in. Stress-test before assuming the spread holds.
Location & tenants
- Location reads 68/100 on livability (#106 in CO) — a middle-class / working-renter tenant base. Strengths: amenities A-, schools B+, employment B+; Watch: commute F, cost of living F.
- Durango School District No. 9-R (town): math 27% / reading 49% proficiency, ranked #30 of 86 in CO (top 35%) — families likely to look elsewhere, expect single-tenant / working-renter base with shorter leases.
- Market conditions: Rents rising (+2.9%/yr); 580 active listings in the ZIP; solid renter incomes; 306 units permitted in La Plata County in 2024 (93 in 5+ unit buildings).
- This rent runs 33% of the median local income ($84k/yr) — at the standard rent-burdened threshold; future hikes will face affordability resistance.
Forward outlook
- Local home prices are declining (-3.0%/yr); year-one equity from $1k of loan paydown is wiped out by about $5k of value loss. Plan a longer hold.
- La Plata County population projected at +25% by 2050 — long-run rental-demand tailwind backs the buy-and-hold thesis.
- At projected returns (-3.0% appreciation + 2.9% rent growth), your $47k cash investment doubles in ~8 years — after that, you're playing with house money.
Negotiation context
- It's been on market 37 days — a 3% lower offer ($162k) is reasonable based on typical stale-listing flexibility.
- 2 sale attempts since 2y ago with the ask held roughly flat each time — persistent listings suggest the price (not the market) is what's stuck; bring a comps-based counter.
Risks & watch-outs
- Climate carrying-cost: major wildfire risk — expect insurance premiums to compound above CPI over the hold.
Questions for the listing agent
- It's been on market 37 days. Have you received any prior offers? Is the seller open to a 3% concession, seller financing, or rate buy-down credit?
- Is there a deadline driving the sale (1031 exchange, divorce, estate, relocation)? That informs how much negotiation room exists.
- Schools are B-rated — typically a magnet for longer-tenancy family renters. What's the average tenant stay here, and is there a school-zone premium baked into asking?
- What's the average days-on-market for RENTAL listings here right now (not sales)? A rising rental-DOM trend means longer vacancies and softer asking-rent achievability than the comps imply.
- What's the recent tenant-quality profile in this submarket — average credit score on applications, eviction rate, late-payment / NSF rate, and stable-employment percentage? A property-management company in the area should have these aggregated.
- How much new for-sale + rental construction is in the pipeline within 1–3 miles? Heavy new supply typically softens prices + rents 12–24 months out; constrained supply supports both.
Investment metrics
- 1% rule
- 1.36% ✓
- Cap rate
- 10.93%
- Cash-on-cash
- 16.57%
- DSCR
- 1.74
- GRM
- 6.1
CMA / ARV
- ARV (on-the-fly)
- $166,464
- Comps found
- 1
Show comp detail 1 sale within ~0.75 mi
| Address | Dist | Beds/Ba | Sqft | Sold | Price | $/sf | Match |
|---|---|---|---|---|---|---|---|
| 6000 County Road 203 #44 | 0.00mi | 3/2.0 | 1,140 (-7%) | 12mo | $155,000 | $136 | 79 |
Match score weights: distance 35% · size 25% · config 20% · recency 20%. Top-matched comps best support the ARV.
Projected returns pro-forma
-3.0% appreciation · 2.94% rent growth · sell at horizon
- IRR
- 7.6%
- Equity multiple
- 1.30×
- Total profit
- $13,959
- Equity at exit
- $24,900
- IRR
- 16.9%
- Equity multiple
- 2.38×
- Total profit
- $64,684
- Equity at exit
- $14,439
Cash invested: $46,760 (down + closing). Projections, not guarantees.
Landlord ↔ Tenant lean methodology
- Overall (STATE)
- 38 Tenant-Leaning
- State Colorado
- 38 Tenant-Leaning · D+4
- County
- — inherits STATE
- City
- — inherits STATE
ZIP-level market 81301
- Rents YoY
- 2.9%
- Active inventory
- 580
- Price-to-rent
- 6.1×
Monthly cashflow live
- Estimated rent
- $2,278 medium interval (Pro) →
- Mortgage (P&I)
- −$876
- Tax est. 1.5%
- −$209 /mo · $2,505/yr
- Insurance
- −$70
- HOA
- −$0
- Vacancy / Maint / Mgmt
- −$478
- Net cashflow
- $646
Break-even live
UW: 25.0% down · 7.5% · 30yr · 1.5% tax · 5.0% vac · 8.0% maint · 8.0% mgmt
Financing live
Cash to close
- Down payment
- $41,750
- Closing costs
- $5,010
- Reserves months
- —
- Total cash needed
- —
Loan-product check · same deal, 3 products live
Conventional
25% down · 7.5% · 30yr
- Down + closing
- —
- Monthly P&I
- —
- Monthly cashflow
- —
- DSCR
- —
- Eligible?
- —
Personal DTI + credit; lowest rate.
DSCR
20% down · 8.5% · 30yr
- Down + closing
- —
- Monthly P&I
- —
- Monthly cashflow
- —
- DSCR
- —
- Eligible?
- —
No personal income docs; deal must DSCR.
Hard money
10% down · 12.0% · 12mo
- Down + closing
- —
- Monthly P&I
- —
- Monthly cashflow
- —
- DSCR
- —
- Eligible?
- —
Short-term bridge; refi at stabilization.
Listing history 19 events
-
2026-06-19days on market $167,000 Active 37 DOM
-
2026-06-18days on market $167,000 Active 36 DOM
-
2026-06-17days on market $167,000 Active 35 DOM
-
2026-06-16days on market $167,000 Active 34 DOM
-
2026-06-15days on market $167,000 Active 33 DOM
-
2026-06-14days on market $167,000 Active 31 DOM
-
2026-06-12days on market $167,000 Active 30 DOM
-
2026-06-09days on market $167,000 Active 27 DOM
-
2026-06-08days on market $167,000 Active 26 DOM
-
2026-06-07days on market $167,000 Active 25 DOM
-
2026-06-05days on market $167,000 Active 22 DOM
-
2026-06-03days on market $167,000 Active 21 DOM
-
2026-06-02days on market $167,000 Active 20 DOM
-
2026-06-01days on market $167,000 Active 19 DOM
-
2026-05-31days on market $167,000 Active 18 DOM
-
2026-05-30days on market $167,000 Active 17 DOM
-
2026-05-13$167,000 Active
-
2024-09-26historical
-
2024-01-05$40,000 Active
ⓘ Source: listings_history table (triggers on properties + properties_extension) + one-shot
backfill from property_details.listing_events for pre-trigger history.
Climate risk First Street
- Flood 3/10 Moderate FEMA zone X (unshaded) · 20% chance over 30 yrs
- Wildfire 6/10 Major
- Heat 2/10 Low 9 d/yr ≥87°F today · 25 d/yr by 30 yrs out
- Wind 1/10 Low
- Air quality 4/10 Moderate 5 unhealthy d/yr today · 6 by 30 yrs out
Nearby sold comps map
Loading sold comps map…
Walkable amenities ~0.75 mi
Loading nearby amenities…
Taxation est. · year 1
- Rental income
- $27,338
- − Mortgage interest
- −$9,355
- − Property taxes
- −$2,505
- − Insurance
- −$835
- − Repairs & maintenance
- −$2,187
- − Management
- −$2,187
- − Depreciation
- −$4,858
- Taxable income
- $5,411
- Est. tax owed @ 24.0%
- −$1,299
- After-tax cash flow
- $6,449/yr
For passive investors: Depreciation is non-cash, so a rental often shows a tax loss while cash-flowing — sheltering income. Rental losses are passive: they offset passive income freely, and up to $25,000/yr can offset ordinary (W-2) income if you actively participate and your MAGI is under $100k (phasing out to $0 by $150k); unused losses carry forward. On sale, claimed depreciation is recaptured at up to 25%, and gains may owe capital-gains tax (a 1031 exchange can defer both). Figures are a year-1 estimate at your 24.0% rate — not tax advice; consult a CPA.
Schools (NCES district)
- District
- Durango School District No. 9-R
- NCES district ID
- 0803480
- Math proficiency
- 27% ▼ -4.00%
- Reading proficiency
- 49% ▼ -1.00%
- Median HH income
- $58,711
- Composite
- 33.58/100
- National rank
- #5420
- State rank
- #30 of 86 in CO
Livability — Durango
- Score
- 68/100
- State rank
- #106
- US rank
- #9262
Category grades
Schools grade is shown separately in the Schools card above.
Census & demographics
- County
- La Plata County · 40,010 people
- City population
- 29,774
- Metro
- Durango, CO
- Population (ZIP)
- 29,774
- Household income
- $83,943
- Rent vs Own
- Severe rent burden
- 1194.0
Population outlook (La Plata County) Hauer SSP2
- Today (2025)
- 62,781 people
- By 2030
- 66,492 · +5.9%
- By 2040
- 72,944 · +16.2%
- By 2050
- 78,543 · +25.1%
- By 2075
- 89,403 · +42.4%
- By 2100
- 94,984 · +51.3%
Race, ethnicity, and origin ACS 2023
- Neighborhood character
- Predominantly White (81%)
- Race & ethnicity
- White 81% Hispanic / Latino 8% Two or more races 7% Native American 6%
- Hispanic origin (detail)
- Mexican 4%
- Common ancestry
- Slovak 4% Italian 3% Portuguese 2%
- Foreign-born
- 2% · Canada
- Languages at home
- 92% English-only · Spanish 5% German/W. Germanic 1%
Political lean MEDSL · La Plata
- 2024 margin
- D (+18.6) · D 58.0% · R 39.3% · Other 2.8%
- 2008→2024 swing
- +2.4pp toward D · 2008: 16.3pp · 2024: 18.6pp
- All cycles
- 2024: D+18.6 2020: D+17.7 2016: D+9.2 2012: D+8.8 2008: D+16.3
Not yet ingested
- Civics
- —
Market trends
- HPI YoY
- ▼ -651.69%
- Current HPI
- 223.832
- Rent YoY
- ▲ 2.94%
- Metro
- Durango, CO
- State GDP YoY
- ▲ 1.95%
- F500 in state
- 14
Industry mix (Fortune 500 HQ in CO)
| Industry | F500 HQs | Revenue |
|---|---|---|
| Technology Distribution | 1 | $31B |
|
||
| Food / Agriculture | 1 | $18B |
|
||
| Packaging | 1 | $14B |
|
||
| Healthcare | 1 | $13B |
|
||
| Energy | 1 | $10B |
|
||
| Technology | 1 | $4B |
|
||
Price history
+317.5% since first listed3 events — show timeline
- 2026-05-13 Listed $167,000 cren
- 2024-09-26 Listing Removed — cren
- 2024-01-05 Listed $40,000 cren
Property tax history
-9.5%/yrLatest (2023): $43 · -62.5% YoY. Source: county tax records.
Cash-flow waterfall
monthlySold comps — $/sqft
last 12 mo · ≤1 miLoading sold comps…