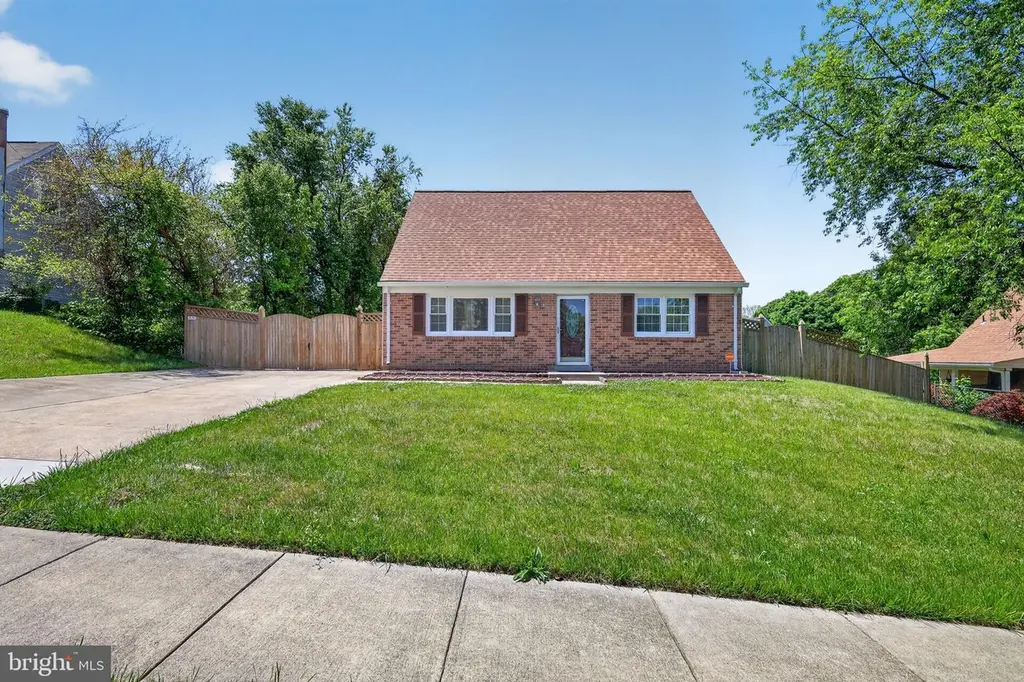
10003 Dakin Ct · Rosaryville, MD
Flood risk 1/10 · Minimal
- FEMA flood zone
- X (unshaded)
- Chance of flooding over 30 yrs
- 0.0%
- Est. flood insurance / yr
- $507 – $1,088
Fire risk 4/10 · Minor
- Est. fire insurance / yr
- $755 – $1,403
Heat risk 8/10 · Major
- Hot days now (above 103°F)
- 7 days/yr
- Hot days in 30 yrs
- 16 days/yr
Wind risk 6/10 · Moderate
- Chance of severe wind over 30 yrs
- 27.0%
Air-quality risk 2/10 · Minimal
- Unhealthy air days now
- 2 days/yr
- Unhealthy air days in 30 yrs
- 2 days/yr
Risk factors via First Street. Map © Google.
Why this score? — see what drove the B- grade
The composite is a weighted blend of 9 inputs, each scored 0–100. Each bar is that input's sub-score; the figure is the points it added to the 100-point composite (weight × sub-score).
- Cash flow +25.0/30.0
- ARV discount +13.8/15.0
- DSCR +8.2/10.0
- 1% rule +6.3/10.0
- Appreciation +4.8/10.0
- Livability +3.0/5.0
- Rent growth +2.5/5.0
- Condition / age +2.5/5.0
- Schools +1.7/10.0
$355,000
🖨 Deal sheet 📄 Offer letter ✓ Due diligence
Listing remarks MLS
Lots of room-1850sq. ft! Great Cape Cod offers 4 bedrooms & den, 2 full baths, addition with large master bedroom & family room. 2 Fireplaces! Ceramic Flooring in huge kitchen, new carpet in front rooms, large fully fenced yard w/ shed, big corner lot!Shows great
Key facts
- 0.23 acre lot
- 2 parking spots
- Built 1976
Property features AI
Finance
- HOA & community: HOA fee of $50 annually
Exterior
- Parking: Concrete driveway with space for 2 vehicles (driveway provides 2 spaces); Total of 2 garage/parking spaces
- Utilities: Public water; Public sewer
- Home design: Detached structure; Above-grade finished area 1,836
- Construction: Frame construction; Composite roof; Other foundation details; Other above- and below-grade structures
- Exterior features: Sidewalks
Interior
- Kitchen: Kitchen
- Bedrooms: Four bedrooms on the main level (includes master bedroom, Bedroom 2, Bedroom 3, Bedroom 4)
- Bathrooms: Two full bathrooms on the main level
- Heating & cooling: Central heating (forced air); Electric heating fuel; Central air conditioning (electric); Electric hot water
- Interior features: Living room; Family room; Has one fireplace
Neighborhood map
What this means for you Summary
Snapshot
- This is a 4-bed/2.0-bath single-family listed at $355k.
Deal economics
- At list price, monthly cash flow is $773 ($9k/yr) — positive.
- The deal already cash-flows at list — no discount required.
- Meets the 1% rule at list price ($4k rent vs $355k).
- Recommended offer: $344k (3.0% below list) — sets the bar for market timing.
- Cap rate 8.9% vs local median 4.2% in Rosaryville — top-decile yield for the area; either an underpriced asset or a hidden risk that comps aren't pricing in. Stress-test before assuming the spread holds.
Location & tenants
- Location reads 60/100 on livability (#357 in MD) — a middle-class / working-renter tenant base. Strengths: employment A+, housing A+; Watch: schools F, amenities F, commute F.
- Prince George'S County Public Schools (suburban): math 8% / reading 24% proficiency, ranked #21 of 24 in MD (top 88%) — low school quality limits family demand, transient renter base, plan for 1-2y turnover.
- Market conditions: 13 active listings in the ZIP; 2 comparable units currently listed for rent nearby; 1,481 units permitted in Prince George's County in 2024 (0 in 5+ unit buildings).
Forward outlook
- In year one you build about $748 of equity ($2k loan paydown + $-2k appreciation (-0.5% local appreciation)).
- Prince George's County population projected at +18% by 2050 — long-run rental-demand tailwind backs the buy-and-hold thesis.
- At projected returns (-0.5% appreciation + 3.0% rent growth), your $99k cash investment doubles in ~8 years — after that, you're playing with house money.
Negotiation context
- It's been on market 35 days — a 3% lower offer ($344k) is reasonable based on typical stale-listing flexibility.
- 4 sale attempts since 27y ago with the ask held roughly flat each time — persistent listings suggest the price (not the market) is what's stuck; bring a comps-based counter.
- Current owner paid $260k; 37% above their basis — modest negotiation headroom, anchor on the comps not their cost.
Risks & watch-outs
- Climate carrying-cost: major wind risk, 27% chance of damaging wind over 30y; extreme-heat days projected 7→16/yr by 2055 (HVAC capex compounding) — expect insurance premiums to compound above CPI over the hold.
Questions for the listing agent
- It's been on market 35 days. Have you received any prior offers? Is the seller open to a 3% concession, seller financing, or rate buy-down credit?
- Built in 1976 — when were the roof, HVAC, electrical panel, plumbing, and water heater last replaced?
- What does the HOA fee cover, when was the last increase, and are there any pending special assessments or reserve-fund shortfalls?
- Is there a deadline driving the sale (1031 exchange, divorce, estate, relocation)? That informs how much negotiation room exists.
- Schools are F-rated, which usually means shorter tenancies and higher turnover. Who's the typical renter profile here, and what's been the actual vacancy rate?
- What's the average days-on-market for RENTAL listings here right now (not sales)? A rising rental-DOM trend means longer vacancies and softer asking-rent achievability than the comps imply.
- What's the recent tenant-quality profile in this submarket — average credit score on applications, eviction rate, late-payment / NSF rate, and stable-employment percentage? A property-management company in the area should have these aggregated.
- How much new for-sale + rental construction is in the pipeline within 1–3 miles? Heavy new supply typically softens prices + rents 12–24 months out; constrained supply supports both.
Investment metrics
- 1% rule
- 1.13% ✓
- Cap rate
- 8.91%
- Cash-on-cash
- 9.34%
- DSCR
- 1.42
- GRM
- 7.4
CMA / ARV
- ARV (median comp)
- $412,938
- List price
- $355,000
- Delta
- -14.03%
- Verdict
- UNDERPRICED
- Comps
- 20 within 1.0 mi
Show comp detail 12 sales within ~0.75 mi
| Address | Dist | Beds/Ba | Sqft | Sold | Price | $/sf | Match |
|---|---|---|---|---|---|---|---|
| 10011 Dakin Ct | 0.06mi | 3/3.0 (-1) | 1,800 (-2%) | 4mo | $420,000 | $233 | 82 |
| 10320 Angora Dr | 0.05mi | 3/2.0 (-1) | 1,632 (-11%) | 1mo | $397,500 | $244 | 74 |
| 10100 Le Fevre Dr | 0.15mi | 4/2.0 | 1,632 (-11%) | 4mo | $392,500 | $241 | 71 |
| 9912 Graystone Dr | 0.41mi | 3/3.5 (-1) | 1,892 (+3%) | 5mo | $489,999 | $259 | 60 |
| 9801 Old Frank Tippett Rd | 0.60mi | 4/2.5 | 2,060 (+12%) | 4mo | $513,000 | $249 | 47 |
| 10305 Beaver Knoll Dr | 0.52mi | 3/3.0 (-1) | 1,600 (-13%) | 2mo | $400,000 | $250 | 43 |
| 10904 Rhodenda Ave | 0.65mi | 4/3.5 | 1,918 (+4%) | 16mo | $480,000 | $250 | 43 |
| 9723 Frank Tippett Rd | 0.64mi | 4/2.0 | 1,622 (-12%) | 12mo | $470,000 | $290 | 41 |
| 10748 Hollaway Dr | 0.73mi | 4/2.0 | 1,560 (-15%) | 3mo | $430,000 | $276 | 38 |
| 9804 Sea Gull Ct | 0.73mi | 3/2.5 (-1) | 1,900 (+4%) | 22mo | $522,000 | $275 | 35 |
| 9909 Graystone Dr | 0.37mi | 5/3.5 (+1) | 2,052 (+12%) | 22mo | $550,555 | $268 | 34 |
| 10706 Phillips Dr | 0.73mi | 4/3.0 | 1,560 (-15%) | 12mo | $450,000 | $288 | 27 |
Match score weights: distance 35% · size 25% · config 20% · recency 20%. Top-matched comps best support the ARV.
Projected returns pro-forma
-0.48% appreciation · 3.0% rent growth · sell at horizon
- IRR
- 6.7%
- Equity multiple
- 1.31×
- Total profit
- $30,946
- Equity at exit
- $94,634
- IRR
- 12.4%
- Equity multiple
- 2.29×
- Total profit
- $128,240
- Equity at exit
- $107,215
Cash invested: $99,400 (down + closing). Projections, not guarantees.
Landlord ↔ Tenant lean methodology
- Overall (STATE)
- 27 Tenant-Leaning
- State Maryland
- 27 Tenant-Leaning · D+14
- County
- — inherits STATE
- City
- — inherits STATE
ZIP-level market 20623
- Home prices YoY
- -0.2%
- Active inventory
- 13
- Price-to-rent
- 7.4×
Monthly cashflow live
- Estimated rent
- $4,000 medium interval (Pro) →
- Mortgage (P&I)
- −$1,862
- Tax from tax record
- −$373 /mo · $4,478/yr
- Insurance
- −$148
- HOA
- −$4
- Vacancy / Maint / Mgmt
- −$840
- Net cashflow
- $773
Break-even live
UW: 25.0% down · 7.5% · 30yr · 1.5% tax · 5.0% vac · 8.0% maint · 8.0% mgmt
Financing live
Cash to close
- Down payment
- $88,750
- Closing costs
- $10,650
- Reserves months
- —
- Total cash needed
- —
Loan-product check · same deal, 3 products live
Conventional
25% down · 7.5% · 30yr
- Down + closing
- —
- Monthly P&I
- —
- Monthly cashflow
- —
- DSCR
- —
- Eligible?
- —
Personal DTI + credit; lowest rate.
DSCR
20% down · 8.5% · 30yr
- Down + closing
- —
- Monthly P&I
- —
- Monthly cashflow
- —
- DSCR
- —
- Eligible?
- —
No personal income docs; deal must DSCR.
Hard money
10% down · 12.0% · 12mo
- Down + closing
- —
- Monthly P&I
- —
- Monthly cashflow
- —
- DSCR
- —
- Eligible?
- —
Short-term bridge; refi at stabilization.
Rent comps 2 comps
| Address | Beds | Baths | Sqft | Rent | $/sqft | DOM | Units | Dist |
|---|---|---|---|---|---|---|---|---|
| 8801 Dangerfield Ct Clinton, MD | 5.0 | 3.0 | 2101 | $4,000 | $1.90 | 5d | 1 | 1.48mi |
| 8801 Dangerfield Ct Clinton, MD | 5.0 | 2.5 | 2101 | $4,000 | $1.90 | 18d | 1 | 1.48mi |
HOA detail
- Monthly dues
- $4 · $48/yr
Listing history 26 events
-
2026-06-18days on market $355,000 Active 35 DOM
-
2026-06-17days on market $355,000 Active 34 DOM
-
2026-06-16days on market $355,000 Active 33 DOM
-
2026-06-15days on market $355,000 Active 32 DOM
-
2026-06-13days on market $355,000 Active 30 DOM
-
2026-06-10days on market $355,000 Active 26 DOM
-
2026-06-08days on market $355,000 Active 25 DOM
-
2026-06-07days on market $355,000 Active 24 DOM
-
2026-06-04days on market $355,000 Active 21 DOM
-
2026-06-03days on market $355,000 Active 20 DOM
-
2026-06-02days on market $355,000 Active 19 DOM
-
2026-06-01days on market $355,000 Active 18 DOM
-
2026-05-31days on market $355,000 Active 17 DOM
-
2026-05-14$355,000 Active 329-char remark
-
2005-05-25soldstatus $260,000
-
2005-05-25soldstatus $260,000
-
2005-04-18soldstatus $260,000 275-char remark
Show marketing remark (275 chars)
Lots of room-1850sq. ft! Great Cape Cod offers 4 bedrooms & den, 2 full baths, addition with large master bedroom & family room. 2 Fireplaces! Ceramic Flooring in huge kitchen, new carpet in front rooms, large fully fenced yard w/ shed, big corner lot!Shows great
-
2005-03-28historical 275-char remark
Show marketing remark (275 chars)
Lots of room-1850sq. ft! Great Cape Cod offers 4 bedrooms & den, 2 full baths, addition with large master bedroom & family room. 2 Fireplaces! Ceramic Flooring in huge kitchen, new carpet in front rooms, large fully fenced yard w/ shed, big corner lot!Shows great
-
2005-02-04$259,900 275-char remark
Show marketing remark (275 chars)
Lots of room-1850sq. ft! Great Cape Cod offers 4 bedrooms & den, 2 full baths, addition with large master bedroom & family room. 2 Fireplaces! Ceramic Flooring in huge kitchen, new carpet in front rooms, large fully fenced yard w/ shed, big corner lot!Shows great
-
2001-07-11soldstatus $133,000
-
2001-06-29soldstatus $133,000
-
2001-06-10historical
-
2001-05-14$129,900
-
2001-04-10historical
-
1999-05-13
-
1989-10-16soldstatus $118,000
ⓘ Source: listings_history table (triggers on properties + properties_extension) + one-shot
backfill from property_details.listing_events for pre-trigger history.
Tax reassessment forecast MD · Partial reset (capped growth)
- Current annual tax
- $4,478 · $373/mo
- Projected year-2 tax
- $4,478 · $373/mo
- Expected delta
- $0/yr ($0/mo · 0.0%)
ⓘ Screening estimate from a state-policy table — verify with the county assessor before closing.
Climate risk First Street
- Flood 1/10 Low FEMA zone X (unshaded) · 0% chance over 30 yrs
- Wildfire 4/10 Moderate
- Heat 8/10 Severe 7 d/yr ≥103°F today · 16 d/yr by 30 yrs out
- Wind 6/10 Major 27% chance of damaging wind over 30 yrs
- Air quality 2/10 Low 2 unhealthy d/yr today · 2 by 30 yrs out
Nearby sold comps map
Loading sold comps map…
Walkable amenities ~0.75 mi
Loading nearby amenities…
Taxation est. · year 1
- Rental income
- $48,000
- − Mortgage interest
- −$19,886
- − Property taxes
- −$4,478
- − Insurance
- −$1,775
- − Repairs & maintenance
- −$3,840
- − Management
- −$3,840
- − HOA
- −$48
- − Depreciation
- −$10,327
- Taxable income
- $3,807
- Est. tax owed @ 24.0%
- −$914
- After-tax cash flow
- $8,366/yr
For passive investors: Depreciation is non-cash, so a rental often shows a tax loss while cash-flowing — sheltering income. Rental losses are passive: they offset passive income freely, and up to $25,000/yr can offset ordinary (W-2) income if you actively participate and your MAGI is under $100k (phasing out to $0 by $150k); unused losses carry forward. On sale, claimed depreciation is recaptured at up to 25%, and gains may owe capital-gains tax (a 1031 exchange can defer both). Figures are a year-1 estimate at your 24.0% rate — not tax advice; consult a CPA.
Schools (NCES district)
- District
- Prince George'S County Public Schools
- NCES district ID
- 2400510
- Math proficiency
- 8% ▼ -11.00%
- Reading proficiency
- 24% ▼ -9.00%
- Median HH income
- $73,967
- Composite
- 16.82/100
- National rank
- #9151
- State rank
- #21 of 24 in MD
Livability — Rosaryville
- Score
- 60/100
- State rank
- #357
- US rank
- #19348
Category grades
Schools grade is shown separately in the Schools card above.
Census & demographics
- Census place
- Rosaryville, MD
- City population
- 2,846
- Population (ZIP)
- 2,846
Population outlook (Prince George's County) Hauer SSP2
- Today (2025)
- 1,005,426 people
- By 2030
- 1,048,416 · +4.3%
- By 2040
- 1,123,425 · +11.7%
- By 2050
- 1,183,220 · +17.7%
- By 2075
- 1,306,202 · +29.9%
- By 2100
- 1,408,179 · +40.1%
Race, ethnicity, and origin ACS 2023
- Neighborhood character
- Predominantly Black (79%)
- Race & ethnicity
- Black 79% Two or more races 12% White 7% Hispanic / Latino 3% Asian 2%
- Common ancestry
- Lithuanian 1%
- Foreign-born
- 2% · Canada
- Languages at home
- 97% English-only · Spanish 3%
Political lean MEDSL · Prince George's
- 2024 margin
- Solid D (+75.2) · D 86.3% · R 11.2% · Other 2.5%
- 2008→2024 swing
- -3.3pp toward R · 2008: 78.5pp · 2024: 75.2pp
- All cycles
- 2024: D+75.2 2020: D+80.5 2016: D+81.0 2012: D+80.9 2008: D+78.5
Not yet ingested
- Civics
- —
Market trends
- HPI YoY
- ▼ -0.48%
- Current HPI
- 265.6279
- Rent YoY
- —
- Metro
- —
- State GDP YoY
- ▲ 2.97%
- F500 in state
- 12
Industry mix (Fortune 500 HQ in MD)
| Industry | F500 HQs | Revenue |
|---|---|---|
| Aerospace / Defense | 1 | $71B |
|
||
| Utilities | 1 | $25B |
|
||
| Hotels | 1 | $24B |
|
||
| Consumer Goods | 1 | $7B |
|
||
| Real Estate | 1 | $6B |
|
||
| Chemicals | 1 | $2B |
|
||
Price history
+200.8% since first listed13 events — show timeline
- 2026-05-14 Listed $355,000 BRIGHT MLS
- 2005-05-25 Sold (Public Records) $260,000 Public Records
- 2005-05-25 Sold (Public Records) $260,000 Public Records
- 2005-04-18 Sold (MLS) $260,000 MRIS
- 2005-03-28 Delisted — MRIS
- 2005-02-04 Listed $259,900 MRIS
- 2001-07-11 Sold (Public Records) $133,000 Public Records
- 2001-06-29 Sold (MLS) $133,000 MRIS
- 2001-06-10 Delisted — MRIS
- 2001-05-14 Listed $129,900 MRIS
- 2001-04-10 Delisted — MRIS
- 1999-05-13 Listed — MRIS
- 1989-10-16 Sold (Public Records) $118,000 Public Records
Property tax history
+5.5%/yrLatest (2025): $4,478 · +3.4% YoY. Source: county tax records.
Cash-flow waterfall
monthlySold comps — $/sqft
last 12 mo · ≤1 miLoading sold comps…