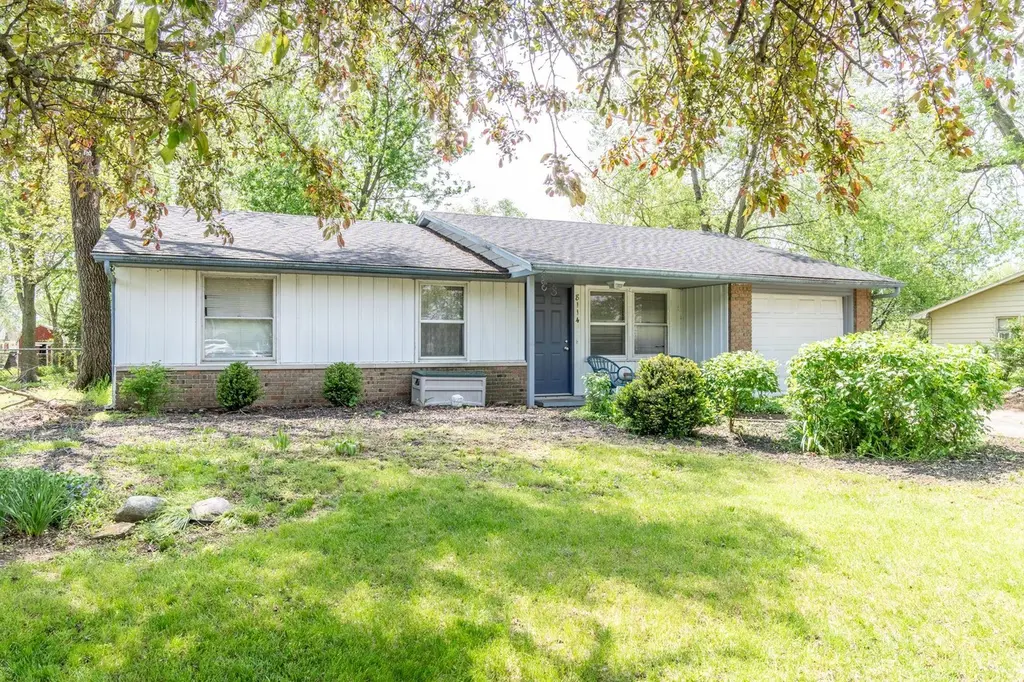
8114 Oklahoma Trl · Fort Wayne, IN
Flood risk 1/10 · Minimal
- FEMA flood zone
- X (unshaded)
- Chance of flooding over 30 yrs
- 0.0%
- Est. flood insurance / yr
- $507 – $1,088
Fire risk 1/10 · Minimal
- Est. fire insurance / yr
- $717 – $1,331
Heat risk 3/10 · Minor
- Hot days now (above 100°F)
- 7 days/yr
- Hot days in 30 yrs
- 17 days/yr
Wind risk 2/10 · Minimal
- Chance of severe wind over 30 yrs
- —
Air-quality risk 3/10 · Minor
- Unhealthy air days now
- 3 days/yr
- Unhealthy air days in 30 yrs
- 3 days/yr
Risk factors via First Street. Map © Google.
Why this score? — see what drove the C+ grade
The composite is a weighted blend of 9 inputs, each scored 0–100. Each bar is that input's sub-score; the figure is the points it added to the 100-point composite (weight × sub-score).
- Cash flow +25.5/30.0
- ARV discount +13.6/15.0
- DSCR +8.4/10.0
- 1% rule +6.1/10.0
- Livability +4.2/5.0
- Rent growth +2.5/5.0
- Condition / age +2.5/5.0
- Schools +2.2/10.0
- Appreciation +0.0/10.0
$174,900
🖨 Deal sheet 📄 Offer letter ✓ Due diligence
Listing remarks
This Park State East ranch could be perfect for anyone looking for affordable home ownership or an investment opportunity. The 3-Bedroom 1.5 Bath sits on a rare fenced & wooded over 1/3 of an acre lot. A little elbow grease & TLC paired with the already completely remodeled Kitchen, stylish ceramic & LVP replacement flooring, dimensional shingle roof, updated electrical panel, and new garage door will result in a wonderful Home. Conveniently located near great Georgetown & Chapel Ridge shopping & dining options, easy highway access, and great public & parochial school options. Schedule a tour today! Estate being sold as-is. Quick close and delay free poss
Key facts
- Ceramic flooring
- Wooded lot
- Remodeled kitchen
Tags
Property features AI
Finance
- Other: Zoned R1
- HOA & community: Homeowners association with an annual fee of $20 (about $1.67/month)
Exterior
- Parking: Attached garage (1 garage space); Concrete off-street parking
- Utilities: Public water; Public sewer
- Home design: Single-family residence; Site-built home; One story
- Construction: Brick construction; Slab foundation; Shingle roof; Built as a site-built home
- Exterior features: Fenced yard (full chain link); Level, wooded lot; Paved, public-maintained road access; Lot dimensions approximately 96 x 198
Interior
- Kitchen: Dishwasher; Microwave; Refrigerator; Electric Range
- Bedrooms: Total of 6 rooms (bedrooms included)
- Flooring: Carpet; Vinyl; Ceramic tile
- Bathrooms: 1 full bathroom; 1 half bathroom; 2 bathrooms on the main level
- Heating & cooling: Central air conditioning; Natural gas forced-air heating
- Interior features: Dishwasher; Microwave; Refrigerator; Electric Range
- Laundry & utility: Laundry on the main level
Neighborhood map
What this means for you Summary
Snapshot
- This is a 3-bed/1.5-bath single-family listed at $175k.
Deal economics
- At list price, monthly cash flow is $407 ($5k/yr) — positive.
- The deal already cash-flows at list — no discount required.
- Meets the 1% rule at list price ($2k rent vs $175k).
- Recommended offer: $170k (3.0% below list) — sets the bar for market timing.
- Cap rate 9.1% vs local median 4.8% in Fort Wayne — top-decile yield for the area; either an underpriced asset or a hidden risk that comps aren't pricing in. Stress-test before assuming the spread holds.
Location & tenants
- Location reads 84/100 on livability (#6 in IN, #676 nationally) — a professional / high-income tenant draw. Strengths: amenities A+, commute A+, cost of living A+; Watch: crime C-, employment D+.
- Fort Wayne Community Schools (urban): math 22% / reading 29% proficiency, ranked #263 of 301 in IN (top 87%) — low school quality limits family demand, transient renter base, plan for 1-2y turnover; 60% free/reduced lunch — lower-income household profile, screen leases tightly.
- Zoned schools: J Wilbur Haley Elementary School (math 19% / reading 20%, grade F, #814 of 994 statewide, top 83%, 568 students, 65% FRL); Blackhawk Middle School (math 28% / reading 38%, grade F, #180 of 330 statewide, top 56%, 797 students, 46% FRL); R Nelson Snider High School (math 27% / reading 53%, grade F, #217 of 369 statewide, top 59%, 1,899 students, 50% FRL).
- Market conditions: 101 active listings in the ZIP; 5 comparable units currently listed for rent nearby; rentals lingering (median 44d on market — plan ~5-8 weeks vacancy on turnover, expect pricing pressure); 60% of comp listings sitting > 30 days — soft ceiling on asking rent; 1,861 units permitted in Allen County in 2024 (576 in 5+ unit buildings).
- This rent runs 32% of the median local income ($73k/yr) — at the standard rent-burdened threshold; future hikes will face affordability resistance.
Forward outlook
- Local home prices are declining (-3.0%/yr); year-one equity from $1k of loan paydown is wiped out by about $5k of value loss. Plan a longer hold.
- Allen County population projected at +10% by 2050 — modest demand growth; plan on rents tracking national, not racing it.
Negotiation context
- It's been on market 32 days — a 3% lower offer ($170k) is reasonable based on typical stale-listing flexibility.
Questions for the listing agent
- It's been on market 32 days. Have you received any prior offers? Is the seller open to a 3% concession, seller financing, or rate buy-down credit?
- Built in 1967 — when were the roof, HVAC, electrical panel, plumbing, and water heater last replaced?
- What does the HOA fee cover, when was the last increase, and are there any pending special assessments or reserve-fund shortfalls?
- Is there a deadline driving the sale (1031 exchange, divorce, estate, relocation)? That informs how much negotiation room exists.
- Schools are D-rated, which usually means shorter tenancies and higher turnover. Who's the typical renter profile here, and what's been the actual vacancy rate?
- What's the average days-on-market for RENTAL listings here right now (not sales)? A rising rental-DOM trend means longer vacancies and softer asking-rent achievability than the comps imply.
- What's the recent tenant-quality profile in this submarket — average credit score on applications, eviction rate, late-payment / NSF rate, and stable-employment percentage? A property-management company in the area should have these aggregated.
- How much new for-sale + rental construction is in the pipeline within 1–3 miles? Heavy new supply typically softens prices + rents 12–24 months out; constrained supply supports both.
Investment metrics
- 1% rule
- 1.11% ✓
- Cap rate
- 9.09%
- Cash-on-cash
- 9.97%
- DSCR
- 1.44
- GRM
- 7.5
CMA / ARV
- ARV (median comp)
- $202,243
- List price
- $174,900
- Delta
- -13.52%
- Verdict
- UNDERPRICED
- Comps
- 20 within 1.0 mi
Show comp detail 12 sales within ~0.75 mi
| Address | Dist | Beds/Ba | Sqft | Sold | Price | $/sf | Match |
|---|---|---|---|---|---|---|---|
| 8230 Oklahoma Trl | 0.11mi | 3/1.0 | 1,036 (-3%) | 3mo | $202,500 | $195 | 85 |
| 3417 Montana Dr | 0.17mi | 3/1.5 | 1,128 (+5%) | 3mo | $214,900 | $191 | 81 |
| 8325 Santa Fe Trl | 0.18mi | 3/1.5 | 1,128 (+5%) | 8mo | $190,700 | $169 | 76 |
| 3521 Utah Dr | 0.07mi | 3/1.0 | 1,156 (+8%) | 10mo | $214,900 | $186 | 74 |
| 8108 Newfield Dr | 0.43mi | 3/1.0 | 1,066 (-1%) | 4mo | $197,000 | $185 | 74 |
| 8303 Newfield Dr | 0.40mi | 3/1.0 | 1,080 (+1%) | 8mo | $172,000 | $159 | 71 |
| 2626 Repton Dr | 0.53mi | 3/1.5 | 1,064 (-1%) | 12mo | $198,000 | $186 | 64 |
| 8130 Park State Dr | 0.14mi | 3/1.0 | 1,228 (+15%) | 6mo | $200,000 | $163 | 62 |
| 8513 Maple Bluff Ct | 0.44mi | 3/2.0 | 1,145 (+7%) | 6mo | $210,000 | $183 | 61 |
| 3008 Hollendale Dr | 0.53mi | 3/2.0 | 1,131 (+6%) | 9mo | $205,000 | $181 | 56 |
| 2809 Kingsland Ct | 0.46mi | 3/1.0 | 972 (-9%) | 7mo | $196,000 | $202 | 55 |
| 2824 Repton Dr | 0.45mi | 3/1.0 | 1,189 (+11%) | 8mo | $198,000 | $167 | 52 |
Match score weights: distance 35% · size 25% · config 20% · recency 20%. Top-matched comps best support the ARV.
Projected returns pro-forma
-3.0% appreciation · 3.0% rent growth · sell at horizon
- IRR
- -1.3%
- Equity multiple
- 0.95×
- Total profit
- $-2,443
- Equity at exit
- $26,078
- IRR
- 8.4%
- Equity multiple
- 1.64×
- Total profit
- $31,163
- Equity at exit
- $15,122
Cash invested: $48,972 (down + closing). Projections, not guarantees.
Landlord ↔ Tenant lean methodology
- Overall (STATE)
- 90 Strongly Landlord-Friendly
- State Indiana
- 90 Strongly Landlord-Friendly · R+11
- County
- — inherits STATE
- City
- — inherits STATE
ZIP-level market 46815
- Active inventory
- 101
- Price-to-rent
- 7.5×
Monthly cashflow live
- Estimated rent
- $1,941 high interval (Pro) →
- Mortgage (P&I)
- −$917
- Tax from tax record
- −$135 /mo · $1,615/yr
- Insurance
- −$73
- HOA
- −$2
- Vacancy / Maint / Mgmt
- −$408
- Net cashflow
- $407
Break-even live
UW: 25.0% down · 7.5% · 30yr · 1.5% tax · 5.0% vac · 8.0% maint · 8.0% mgmt
Financing live
Cash to close
- Down payment
- $43,725
- Closing costs
- $5,247
- Reserves months
- —
- Total cash needed
- —
Loan-product check · same deal, 3 products live
Conventional
25% down · 7.5% · 30yr
- Down + closing
- —
- Monthly P&I
- —
- Monthly cashflow
- —
- DSCR
- —
- Eligible?
- —
Personal DTI + credit; lowest rate.
DSCR
20% down · 8.5% · 30yr
- Down + closing
- —
- Monthly P&I
- —
- Monthly cashflow
- —
- DSCR
- —
- Eligible?
- —
No personal income docs; deal must DSCR.
Hard money
10% down · 12.0% · 12mo
- Down + closing
- —
- Monthly P&I
- —
- Monthly cashflow
- —
- DSCR
- —
- Eligible?
- —
Short-term bridge; refi at stabilization.
Rent comps 5 comps
| Address | Beds | Baths | Sqft | Rent | $/sqft | DOM | Units | Dist |
|---|---|---|---|---|---|---|---|---|
| 3212 W Bartlett Dr Fort Wayne, IN | 2.0 | 2.0 | 1289 | $2,250 | $1.75 | 43d | 1 | 0.41mi |
| 3215 W Bartlett Dr Fort Wayne, IN | 2.0 | 2.0 | 1464 | $2,380 | $1.63 | 43d | 1 | 0.44mi |
| 3213 W Bartlett Dr Fort Wayne, IN | 2.0 | 2.0 | 1445 | $2,250 | $1.56 | 43d | 1 | 0.44mi |
| 9114 Parent Rd New Haven, IN | 2.0 | 1.0 | 1000 | $1,550 | $1.55 | 13d | 10 | 0.75mi |
| 3010 Simcoe Dr Fort Wayne, IN | 1.0–3.0 | 1.0–2.5 | 940 | $1,609 | $1.71 | 13d | 10 | 1.14mi |
HOA detail
- Monthly dues
- $2 · $24/yr
- Likely covers
- electric
Listing history 2 events
-
2026-05-09price $174,900 716-char remark
-
2026-04-25$189,900 Active 716-char remark
ⓘ Source: listings_history table (triggers on properties + properties_extension) + one-shot
backfill from property_details.listing_events for pre-trigger history.
Tax reassessment forecast IN · Partial reset (capped growth)
- Current annual tax
- $1,615 · $135/mo
- Projected year-2 tax
- $1,615 · $135/mo
- Expected delta
- $0/yr ($0/mo · 0.0%)
ⓘ Screening estimate from a state-policy table — verify with the county assessor before closing.
Climate risk First Street
- Flood 1/10 Low FEMA zone X (unshaded) · 0% chance over 30 yrs
- Wildfire 1/10 Low
- Heat 3/10 Moderate 7 d/yr ≥100°F today · 17 d/yr by 30 yrs out
- Wind 2/10 Low
- Air quality 3/10 Moderate 3 unhealthy d/yr today · 3 by 30 yrs out
Nearby sold comps map
Loading sold comps map…
Walkable amenities ~0.75 mi
Loading nearby amenities…
Taxation est. · year 1
- Rental income
- $23,295
- − Mortgage interest
- −$9,797
- − Property taxes
- −$1,615
- − Insurance
- −$874
- − Repairs & maintenance
- −$1,864
- − Management
- −$1,864
- − HOA
- −$24
- − Depreciation
- −$5,088
- Taxable income
- $2,170
- Est. tax owed @ 24.0%
- −$521
- After-tax cash flow
- $4,363/yr
For passive investors: Depreciation is non-cash, so a rental often shows a tax loss while cash-flowing — sheltering income. Rental losses are passive: they offset passive income freely, and up to $25,000/yr can offset ordinary (W-2) income if you actively participate and your MAGI is under $100k (phasing out to $0 by $150k); unused losses carry forward. On sale, claimed depreciation is recaptured at up to 25%, and gains may owe capital-gains tax (a 1031 exchange can defer both). Figures are a year-1 estimate at your 24.0% rate — not tax advice; consult a CPA.
Schools (NCES district)
- District
- Fort Wayne Community Schools
- NCES district ID
- 1803630
- Math proficiency
- 22% ▼ -11.00%
- Reading proficiency
- 29% ▼ -7.00%
- Median HH income
- $41,951
- Composite
- 21.68/100
- National rank
- #8275
- State rank
- #263 of 301 in IN
Livability — Fort Wayne
- Score
- 84/100
- State rank
- #6
- US rank
- #676
Category grades
Schools grade is shown separately in the Schools card above.
Census & demographics
- Census place
- Fort Wayne, IN
- County
- Allen County · 326,813 people
- City population
- 326,813
- Metro
- Fort Wayne, IN
- Population (ZIP)
- 27,238
- Household income
- $73,239
- Rent vs Own
- Severe rent burden
- 604.0
Population outlook (Allen County) Hauer SSP2
- Today (2025)
- 394,020 people
- By 2030
- 405,128 · +2.8%
- By 2040
- 423,476 · +7.5%
- By 2050
- 435,137 · +10.4%
- By 2075
- 450,293 · +14.3%
- By 2100
- 424,101 · +7.6%
Race, ethnicity, and origin ACS 2023
- Neighborhood character
- Predominantly White (78%)
- Race & ethnicity
- White 78% Black 9% Two or more races 7% Asian 5% Hispanic / Latino 4%
- Common ancestry
- Italian 2% Lithuanian 2% Romanian 2%
- Foreign-born
- 4% · Philippines, Canada
- Languages at home
- 93% English-only · Other Asian/Pacific 4% Spanish 1% Other Indo-European 1%
Political lean MEDSL · Allen
- 2024 margin
- R (+12.5) · D 42.9% · R 55.4% · Other 1.7%
- 2008→2024 swing
- -8.1pp toward R · 2008: -4.3pp · 2024: -12.5pp
- All cycles
- 2024: R+12.5 2020: R+11.2 2016: R+19.6 2012: R+16.8 2008: R+4.3
Not yet ingested
- Civics
- —
Market trends
- HPI YoY
- ▼ -219.81%
- Current HPI
- 245.2095
- Rent YoY
- —
- Metro
- Fort Wayne, IN
- State GDP YoY
- ▲ 2.90%
- F500 in state
- 18
Industry mix (Fortune 500 HQ in IN)
| Industry | F500 HQs | Revenue |
|---|---|---|
| Industrial Machinery | 2 | $37B |
|
||
| Healthcare | 1 | $177B |
|
||
| Pharmaceuticals | 1 | $45B |
|
||
| Metals / Steel | 1 | $18B |
|
||
| Agriculture | 1 | $17B |
|
||
| Packaging | 1 | $12B |
|
||
Price history
-7.9% since first listed3 events — show timeline
- 2026-05-27 Pending — IRMLS
- 2026-05-09 Price Changed $174,900 IRMLS
- 2026-04-25 Listed $189,900 IRMLS
Property tax history
+8.9%/yrLatest (2024): $1,615 · +12.5% YoY. Source: county tax records.
Cash-flow waterfall
monthlySold comps — $/sqft
last 12 mo · ≤1 miLoading sold comps…