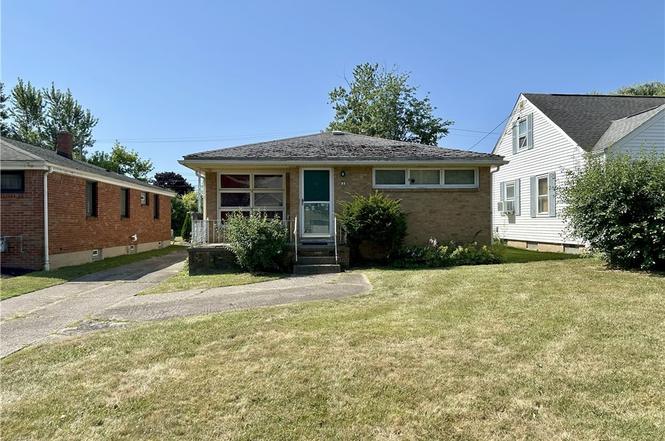
95 Argyle Ave · Eggertsville, NY
Flood risk 1/10 · Minimal
- FEMA flood zone
- X (unshaded)
- Chance of flooding over 30 yrs
- 0.0%
- Est. flood insurance / yr
- $473 – $860
Fire risk 1/10 · Minimal
- Est. fire insurance / yr
- $691 – $1,283
Heat risk 2/10 · Minimal
- Hot days now (above 92°F)
- 7 days/yr
- Hot days in 30 yrs
- 15 days/yr
Wind risk 1/10 · Minimal
- Chance of severe wind over 30 yrs
- —
Air-quality risk 3/10 · Minor
- Unhealthy air days now
- 2 days/yr
- Unhealthy air days in 30 yrs
- 3 days/yr
Risk factors via First Street. Map © Google.
Why this score? — see what drove the D+ grade
The composite is a weighted blend of 9 inputs, each scored 0–100. Each bar is that input's sub-score; the figure is the points it added to the 100-point composite (weight × sub-score).
- ARV discount +15.0/15.0
- Cash flow +9.8/30.0
- Schools +5.3/10.0
- Rent growth +4.8/5.0
- 1% rule +4.7/10.0
- Livability +4.2/5.0
- DSCR +2.8/10.0
- Condition / age +2.5/5.0
- Appreciation +0.0/10.0
$190,000
🖨 Deal sheet (PDF) 📄 Offer letter ✓ Due diligence
Listing remarks
This ranch-style home in Amherst has 3 bedrooms and 2 bathrooms, offering both a living room and a family room for ample gathering space. The partially finished basement includes a full additional bathroom and supplementary living area. Enjoy the covered porch and the partially fenced back yard. Kitchen has updated appliances that are included. Concrete driveway and 1.5 car garage. Located in Amherst School District.
Key facts
- Covered porch
- Updated appliances
- 6,671 sq ft lot
Tags
Neighborhood map
What this means for you Summary
Snapshot
- This is a 3-bed/2.0-bath single-family listed at $190k.
Deal economics
- At list price, monthly cash flow is $-121 ($-1k/yr) — negative.
- To cash-flow at today's rent, offer at most $169k (11.2% below list).
- To meet the 1% rule (rent ≥ 1% of price), the offer needs to be $184k (3.4% below list).
- Recommended offer: $169k (11.2% below list) — sets the bar for cash-flow.
- Cap rate 5.5% vs local median 4.5% in Eggertsville — meaningfully above typical; check what's discounted (condition, days-on-market, listing class) to confirm the premium yield is real.
Location & tenants
- Location reads 85/100 on livability (#34 in NY, #534 nationally) — a professional / high-income tenant draw. Strengths: commute A+, housing A+, health & safety A+; Watch: crime C-, amenities C-.
- Amherst Central School District (suburban): math 53% / reading 68% proficiency, ranked #209 of 590 in NY (top 35%) — acceptable for families but not a draw, mixed tenant base, ~2y average lease.
- Market conditions: Rents rising fast (+9.0%/yr); 143 active listings in the ZIP; 15 comparable units currently listed for rent nearby; rentals at typical pace (median 25d on market — plan ~3-4 weeks tenant-placement turnaround); solid renter incomes; 1,244 units permitted in Erie County in 2024 (563 in 5+ unit buildings).
Forward outlook
- Local home prices are declining (-3.0%/yr); year-one equity from $1k of loan paydown is wiped out by about $6k of value loss. Plan a longer hold.
Negotiation context
- It's been on market 50 days — a 3% lower offer ($184k) is reasonable based on typical stale-listing flexibility.
- 2 sale attempts; this cycle's ask has dropped $110k (37%) from the opening price — seller is motivated, your offer sets the floor, not the list.
- Current owner paid $150k; 27% above their basis — modest negotiation headroom, anchor on the comps not their cost.
Risks & watch-outs
- Watch-outs: property tax is 3.1% of price; built in 1956 — expect roof / HVAC / electrical / plumbing capex.
Questions for the listing agent
- What do current leases actually rent for vs. the listed asking? Can we see a recent rent roll and the last 12 months of T-12 income?
- It's been on market 50 days. Have you received any prior offers? Is the seller open to a 11% concession, seller financing, or rate buy-down credit?
- Built in 1956 — when were the roof, HVAC, electrical panel, plumbing, and water heater last replaced?
- Property tax is high relative to price — has the assessment been appealed recently, and will the sale trigger a re-assessment?
- Is there a deadline driving the sale (1031 exchange, divorce, estate, relocation)? That informs how much negotiation room exists.
- Schools are B-rated — typically a magnet for longer-tenancy family renters. What's the average tenant stay here, and is there a school-zone premium baked into asking?
- The area grade is low — what's the realistic commute time and amenity access for the typical tenant pool here? Any planned neighborhood developments (good or bad) we should know about?
- What's the average days-on-market for RENTAL listings here right now (not sales)? A rising rental-DOM trend means longer vacancies and softer asking-rent achievability than the comps imply.
- What's the recent tenant-quality profile in this submarket — average credit score on applications, eviction rate, late-payment / NSF rate, and stable-employment percentage? A property-management company in the area should have these aggregated.
- How much new for-sale + rental construction is in the pipeline within 1–3 miles? Heavy new supply typically softens prices + rents 12–24 months out; constrained supply supports both.
Investment metrics
- 1% rule
- 0.97% ✗
- Cap rate
- 5.53%
- Cash-on-cash
- -2.73%
- DSCR
- 0.88
- GRM
- 8.6
CMA / ARV
- ARV (on-the-fly)
- $278,860
- Comps found
- 12
Show comp detail 12 sales within ~0.75 mi
| Address | Dist | Beds/Ba | Sqft | Sold | Price | $/sf | Match |
|---|---|---|---|---|---|---|---|
| 17 University Ct | 0.42mi | 3/1.5 | 1,512 (+4%) | 2mo | $330,000 | $218 | 71 |
| 965 Eggert Rd | 0.17mi | 3/1.5 | 1,296 (-11%) | 4mo | $304,500 | $235 | 68 |
| 49 Canterbury Ct | 0.34mi | 3/1.5 | 1,354 (-7%) | 5mo | $312,000 | $230 | 66 |
| 1165 Eggert Rd | 0.46mi | 4/2.0 (+1) | 1,490 (+2%) | 5mo | $247,000 | $166 | 66 |
| 1818 Kensington Ave | 0.66mi | 3/1.5 | 1,434 (-2%) | 2mo | $271,000 | $189 | 62 |
| 1752 Kensington Ave | 0.62mi | 3/2.0 | 1,308 (-10%) | 1mo | $250,000 | $191 | 53 |
| 148 Rounds Ave | 0.59mi | 4/1.0 (+1) | 1,389 (-5%) | 5mo | $155,000 | $112 | 52 |
| 234 Treehaven Rd | 0.44mi | 2/1.0 (-1) | 1,296 (-11%) | 4mo | $275,000 | $212 | 48 |
| 296 Burke Dr | 0.55mi | 3/1.5 | 1,276 (-13%) | 4mo | $230,000 | $180 | 48 |
| 211 Burke Dr | 0.59mi | 3/1.0 | 1,648 (+13%) | 3mo | $275,000 | $167 | 45 |
| 506 Mount Vernon Rd | 0.73mi | 3/2.0 | 1,628 (+12%) | 3mo | $390,500 | $240 | 45 |
| 622 Lasalle Ave | 0.75mi | 4/1.0 (+1) | 1,258 (-14%) | 3mo | $115,000 | $91 | 31 |
Match score weights: distance 35% · size 25% · config 20% · recency 20%. Top-matched comps best support the ARV.
Projected returns pro-forma
-3.0% appreciation · 8.0% rent growth · sell at horizon
- IRR
- -14.2%
- Equity multiple
- 0.46×
- Total profit
- $-28,602
- Equity at exit
- $28,330
- IRR
- 2.1%
- Equity multiple
- 1.19×
- Total profit
- $10,084
- Equity at exit
- $16,428
Cash invested: $53,200 (down + closing). Projections, not guarantees.
Landlord ↔ Tenant lean methodology
- Overall (STATE)
- 15 Strongly Tenant-Friendly
- State New York
- 15 Strongly Tenant-Friendly · D+10
- County
- — inherits STATE
- City
- — inherits STATE
ZIP-level market 14226
- Rents YoY
- 9.0%
- Active inventory
- 143
- Price-to-rent
- 8.6×
Monthly cashflow live
- Estimated rent
- $1,836 high interval (Pro) →
- Mortgage (P&I)
- −$996
- Tax from tax record
- −$495 /mo · $5,945/yr
- Insurance
- −$79
- HOA
- −$0
- Vacancy / Maint / Mgmt
- −$385
- Net cashflow
- $-121
Break-even live
Sensitivity live
| Price | -10% $-13 | -5% $-67 | +0% $-121 | +5% $-175 | +10% $-228 |
|---|---|---|---|---|---|
| Rent | -10% $-266 | -5% $-193 | +0% $-121 | +5% $-48 | +10% $24 |
| Rate | -1.0pp $-25 | -0.5pp $-73 | base $-121 | +0.5pp $-170 | +1.0pp $-220 |
UW: 25.0% down · 7.5% · 30yr · 1.5% tax · 5.0% vac · 8.0% maint · 8.0% mgmt
Financing live
Cash to close
- Down payment
- $47,500
- Closing costs
- $5,700
- Reserves months
- —
- Total cash needed
- —
Loan-product check · same deal, 3 products live
Conventional
25% down · 7.5% · 30yr
- Down + closing
- —
- Monthly P&I
- —
- Monthly cashflow
- —
- DSCR
- —
- Eligible?
- —
Personal DTI + credit; lowest rate.
DSCR
20% down · 8.5% · 30yr
- Down + closing
- —
- Monthly P&I
- —
- Monthly cashflow
- —
- DSCR
- —
- Eligible?
- —
No personal income docs; deal must DSCR.
Hard money
10% down · 12.0% · 12mo
- Down + closing
- —
- Monthly P&I
- —
- Monthly cashflow
- —
- DSCR
- —
- Eligible?
- —
Short-term bridge; refi at stabilization.
Rent comps 15 comps
| Address | Beds | Baths | Sqft | Rent | $/sqft | DOM | Units | Dist |
|---|---|---|---|---|---|---|---|---|
| 91 Springville Ave Buffalo, NY | 4.0 | 2.0 | 1660 | $2,350 | $1.42 | 24d | 1 | 0.94mi |
| 189 Westminster Ave Buffalo, NY | 4.0 | 1.5 | 1065 | $1,595 | $1.50 | 11d | 1 | 0.95mi |
| 44 Aurora Dr Buffalo, NY | 3.0 | 1.0 | 1272 | $3,300 | $2.59 | 2d | 1 | 1.02mi |
| 265 Lisbon Ave Unit 2 Buffalo, NY | 3.0 | 1.0 | 1200 | $1,400 | $1.17 | 44d | 1 | 1.06mi |
| 220 Dartmouth Ave Buffalo, NY | 2.0 | 1.0 | 1000 | $1,100 | $1.10 | 24d | 1 | 1.08mi |
| 32 Bernhardt Dr #10 Buffalo, NY | 2.0 | 1.5 | 1634 | $2,200 | $1.35 | 44d | 1 | 1.10mi |
| 222 Lisbon Ave Buffalo, NY | 4.0 | 1.0 | 1300 | $1,400 | $1.08 | 24d | 1 | 1.12mi |
| 222 Lisbon Ave Unit Upper Buffalo, NY | 3.0 | 1.0 | 1400 | $1,400 | $1.00 | 44d | 1 | 1.12mi |
| 263 Minnesota Ave Unit Upper Buffalo, NY | 3.0 | 1.0 | 1242 | $1,500 | $1.21 | 15d | 1 | 1.14mi |
| 97 Davidson Ave Buffalo, NY | 3.0 | 1.0 | 925 | $1,495 | $1.62 | 2d | 1 | 1.27mi |
| 60 Englewood Ave Buffalo, NY | 4.0 | 1.0 | 1400 | $1,650 | $1.18 | 2d | 1 | 1.32mi |
| 348 Capen Blvd Buffalo, NY | 3.0 | 1.5 | 1424 | $2,200 | $1.54 | 2d | 1 | 1.35mi |
| 40 Lisbon Ave Unit Upper Buffalo, NY | 2.0 | 1.0 | 1057 | $1,500 | $1.42 | 12d | 1 | 1.42mi |
| 92 Lasalle Ave Unit 1 Buffalo, NY | 2.0 | 1.0 | 1000 | $1,150 | $1.15 | 44d | 1 | 1.45mi |
| 26 Custer St Buffalo, NY | 2.0 | 1.0 | 1000 | $1,300 | $1.30 | 44d | 1 | 1.46mi |
Listing history 12 events
-
2025-12-19soldstatus $150,000
-
2025-09-30status Pending
-
2025-09-24price $190,000
-
2025-09-21price $225,000
-
2025-09-21status Active
-
2025-09-13status Pending
-
2025-09-05price $260,000
-
2025-08-20price $270,000
-
2025-08-10price $290,000
-
2025-08-01$300,000 Active
-
2003-08-15soldstatus $91,000
-
1993-08-06soldstatus $80,000
ⓘ Source: listings_history table (triggers on properties + properties_extension) + one-shot
backfill from property_details.listing_events for pre-trigger history.
Tax reassessment forecast NY · Partial reset (capped growth)
- Current annual tax
- $5,945 · $495/mo
- Projected year-2 tax
- $5,945 · $495/mo
- Expected delta
- $0/yr ($0/mo · 0.0%)
ⓘ Screening estimate from a state-policy table — verify with the county assessor before closing.
Climate risk First Street
- Flood 1/10 Low FEMA zone X (unshaded) · 0% chance over 30 yrs
- Wildfire 1/10 Low
- Heat 2/10 Low 7 d/yr ≥92°F today · 15 d/yr by 30 yrs out
- Wind 1/10 Low
- Air quality 3/10 Moderate 2 unhealthy d/yr today · 3 by 30 yrs out
Nearby sold comps map
Loading sold comps map…
Walkable amenities ~0.75 mi
Loading nearby amenities…
Taxation est. · year 1
- Rental income
- $22,026
- − Mortgage interest
- −$10,643
- − Property taxes
- −$5,945
- − Insurance
- −$950
- − Repairs & maintenance
- −$1,762
- − Management
- −$1,762
- − Depreciation
- −$5,527
- Taxable loss
- −$4,563
- Est. tax savings @ 24.0%
- +$1,095
- After-tax cash flow
- $-356/yr
For passive investors: Depreciation is non-cash, so a rental often shows a tax loss while cash-flowing — sheltering income. Rental losses are passive: they offset passive income freely, and up to $25,000/yr can offset ordinary (W-2) income if you actively participate and your MAGI is under $100k (phasing out to $0 by $150k); unused losses carry forward. On sale, claimed depreciation is recaptured at up to 25%, and gains may owe capital-gains tax (a 1031 exchange can defer both). Figures are a year-1 estimate at your 24.0% rate — not tax advice; consult a CPA.
Schools (NCES district)
- District
- Amherst Central School District
- NCES district ID
- 3602920
- Math proficiency
- 53% ▼ -16.00%
- Reading proficiency
- 68% ▲ 4.00%
- Median HH income
- $68,551
- Composite
- 53.21/100
- National rank
- #1502
- State rank
- #209 of 590 in NY
Livability — Eggertsville
- Score
- 85/100
- State rank
- #34
- US rank
- #534
Category grades
Schools grade is shown separately in the Schools card above.
Census & demographics
- Census place
- Eggertsville, NY
- County
- Erie County · 714,559 people
- City population
- 29,482
- Metro
- Buffalo-Cheektowaga, NY
- Population (ZIP)
- 29,159
- Household income
- $84,325
- Rent vs Own
- Severe rent burden
- 856.0
Population outlook (Erie County) Hauer SSP2
- Today (2025)
- 933,037 people
- By 2030
- 935,181 · +0.2%
- By 2040
- 928,531 · -0.5%
- By 2050
- 905,725 · -2.9%
- By 2075
- 834,037 · -10.6%
- By 2100
- 708,033 · -24.1%
Race, ethnicity, and origin ACS 2023
- Neighborhood character
- Predominantly White (74%)
- Race & ethnicity
- White 74% Black 10% Asian 7% Two or more races 6% Hispanic / Latino 5%
- Common ancestry
- Romanian 7% Lithuanian 2% Slovak 1%
- Foreign-born
- 13% · Canada, China, India
- Languages at home
- 87% English-only · Other Indo-European 4% Spanish 2% Arabic 1%
Political lean MEDSL · Erie
- 2024 margin
- Lean D (+9.7) · D 54.8% · R 45.2%
- 2008→2024 swing
- -7.9pp toward R · 2008: 17.5pp · 2024: 9.7pp
- All cycles
- 2024: D+9.7 2020: D+14.7 2016: D+4.8 2012: D+15.6 2008: D+17.5
Not yet ingested
- Civics
- —
Market trends
- HPI YoY
- ▼ -270.71%
- Current HPI
- 331.1929
- Rent YoY
- ▲ 9.01%
- Metro
- Buffalo-Cheektowaga, NY
- State GDP YoY
- ▲ 2.60%
- F500 in state
- 92
Industry mix (Fortune 500 HQ in NY)
| Industry | F500 HQs | Revenue |
|---|---|---|
| Financial Services | 10 | $950B |
|
||
| Consumer Goods | 9 | $162B |
|
||
| Insurance | 4 | $225B |
|
||
| Telecommunications | 2 | $144B |
|
||
| Pharmaceuticals | 2 | $112B |
|
||
| Media / Entertainment | 2 | $69B |
|
||
Price history
+87.5% since first listed12 events — show timeline
- 2025-12-19 Sold (Public Records) $150,000 Public Records
- 2025-09-30 Pending — WNYREIS
- 2025-09-24 Price Changed $190,000 WNYREIS
- 2025-09-21 Price Changed $225,000 WNYREIS
- 2025-09-21 Relisted — WNYREIS
- 2025-09-13 Pending — WNYREIS
- 2025-09-05 Price Changed $260,000 WNYREIS
- 2025-08-20 Price Changed $270,000 WNYREIS
- 2025-08-10 Price Changed $290,000 WNYREIS
- 2025-08-01 Listed $300,000 WNYREIS
- 2003-08-15 Sold (Public Records) $91,000 Public Records
- 1993-08-06 Sold (Public Records) $80,000 Public Records
Property tax history
+4.0%/yrLatest (2025): $5,945 · +8.8% YoY. Source: county tax records.
Cash-flow waterfall
monthlySold comps — $/sqft
last 12 mo · ≤1 miLoading sold comps…