 Triplex
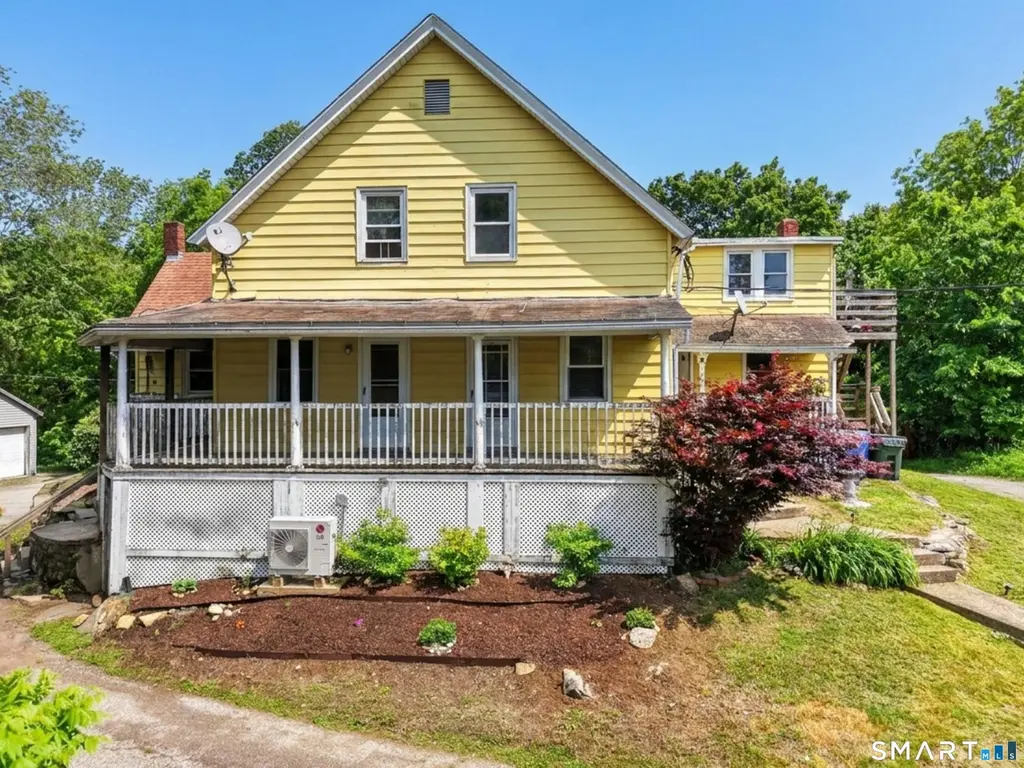
87 Hunters Ave · Norwich, CT
Flood risk 1/10 · Minimal
- FEMA flood zone
- X (unshaded)
- Chance of flooding over 30 yrs
- 0.0%
- Est. flood insurance / yr
- $473 – $860
Fire risk 2/10 · Minimal
- Est. fire insurance / yr
- $829 – $1,539
Heat risk 5/10 · Moderate
- Hot days now (above 98°F)
- 7 days/yr
- Hot days in 30 yrs
- 16 days/yr
Wind risk 6/10 · Moderate
- Chance of severe wind over 30 yrs
- 62.0%
Air-quality risk 3/10 · Minor
- Unhealthy air days now
- 2 days/yr
- Unhealthy air days in 30 yrs
- 3 days/yr
Risk factors via First Street. Map © Google.
Why this score? — see what drove the C+ grade
The composite is a weighted blend of 9 inputs, each scored 0–100. Each bar is that input's sub-score; the figure is the points it added to the 100-point composite (weight × sub-score).
- Cash flow +30.0/30.0
- DSCR +10.0/10.0
- 1% rule +8.6/10.0
- Rent growth +4.2/5.0
- Livability +4.0/5.0
- Condition / age +2.2/5.0
- Schools +2.1/10.0
- ARV discount +0.0/15.0
- Appreciation +0.0/10.0
$399,900
🖨 Deal sheet 📄 Offer letter ✓ Due diligence
Multi-family units
County records classify this as Multi-Family (2-4 Unit). Listing-text estimate: 3 units. confirmed
Listing remarks
3 Unit Multi-family property with 1 2-3BR/2BA, and 2 1BR/1BA units on 1.28 acres sitting high on a rolling hill. Property includes an 1875 sq. ft. Workshop w/ 200 amp service currently being used as a specialty wood shop with many possibilities. The sellers unit is owned by a master carpenter and comes with custom flooring, ceilings, and shoji screens. The kitchen is equiped with an Imperial gas stove, granite counters, farm sink and ceramic tile floors. The rental units have washers & dryers that will remain, Plenty of parking and a garage that could be used for parking, storage or continue to be additional work shop space. One unit is occupied by a long term tenant and is on a lease
Key facts
- 1.28 acre lot
- 8 parking spots
- Built 1900
Property features AI
Finance
- Other: Property has 3 total units and 16 total rooms
- Financial info: Assessment value listed (amount withheld from feature grouping: assessed value present)
Exterior
- Parking: Driveway (private, circular, dirt); Unassigned parking and other parking; 8 total parking spaces
- Utilities: Public water connected; Public sewer connected
- Home design: Multi-family property (3-family); Multi-family for sale
- Construction: Frame construction with aluminum siding; Masonry and stone foundation; Asphalt shingle roof; Yellow exterior color
- Exterior features: Deck; Patio; Treed, sloping lot
Interior
- Kitchen: No specific kitchen appliance list provided
- Bedrooms: 4 bedrooms total
- Bathrooms: 4 full bathrooms
- Heating & cooling: Heat pump, radiator heat, wood/coal stove, and other heat sources available; Heat fuel includes coal, electric, and gas available in the street
- Interior features: Heat pump and wall units for cooling; Full unfinished walk-out basement with dirt floor
- Laundry & utility: All units have laundry hook-ups; some units include washer/dryer; Hot water supplied by natural gas
Neighborhood map
What this means for you Summary
Snapshot
- This is a 3 × 3.0-bed/2.0-bath units multifamily listed at $400k. Condition is rated fair.
Deal economics
- At list price, monthly cash flow is $2k ($19k/yr) — positive. Per door: $514/mo.
- The deal already cash-flows at list — no discount required.
- Meets the 1% rule at list price ($5k rent vs $400k).
- Recommended offer: $394k (1.5% below list) — sets the bar for market timing.
- Cap rate 10.9% vs local median 4.0% in Norwich — top-decile yield for the area; either an underpriced asset or a hidden risk that comps aren't pricing in. Stress-test before assuming the spread holds.
Location & tenants
- Location reads 81/100 on livability (#18 in CT, #1,391 nationally) — a professional / high-income tenant draw. Strengths: housing A+, health & safety A+, commute A-; Watch: schools D+.
- Norwich School District (urban): math 19% / reading 29% proficiency, ranked #139 of 153 in CT (top 91%) — low school quality limits family demand, transient renter base, plan for 1-2y turnover; 62% free/reduced lunch — lower-income household profile, screen leases tightly.
- Market conditions: Rents rising fast (+6.6%/yr); 241 active listings in the ZIP; 487 units permitted in Southeastern Connecticut Planning Region in 2024 (244 in 5+ unit buildings).
- At $5,452/mo this rent would consume 100% of the median local household income ($66k/yr) (locally 1643% of renters already pay >50% of income on rent) — very limited rent-growth headroom before tenants either downsize or default.
Forward outlook
- Local home prices are declining (-3.0%/yr); year-one equity from $3k of loan paydown is wiped out by about $12k of value loss. Plan a longer hold.
- At projected returns (-3.0% appreciation + 6.6% rent growth), your $112k cash investment doubles in ~6 years — after that, you're playing with house money.
Negotiation context
- It's been on market 15 days — a 2% lower offer ($394k) is reasonable based on typical stale-listing flexibility.
Risks & watch-outs
- Watch-outs: built in 1900 — expect roof / HVAC / electrical / plumbing capex.
- Climate carrying-cost: major wind risk, 62% chance of damaging wind over 30y; extreme-heat days projected 7→16/yr by 2055 (HVAC capex compounding) — expect insurance premiums to compound above CPI over the hold.
Questions for the listing agent
- Can we see the unit-by-unit rent roll, current vacancy, and any below-market leases? What's the average tenancy length?
- What capital expenditures (roof, boiler, parking lot, exteriors) have been made in the last 5 years, and what's planned in the next 2?
- Have any recent inspections been done? Can we get a copy of the seller's disclosures and any deferred-maintenance estimates?
- Built in 1900 — when were the roof, HVAC, electrical panel, plumbing, and water heater last replaced?
- Is there a deadline driving the sale (1031 exchange, divorce, estate, relocation)? That informs how much negotiation room exists.
- Schools are D-rated, which usually means shorter tenancies and higher turnover. Who's the typical renter profile here, and what's been the actual vacancy rate?
- What's the average days-on-market for RENTAL listings here right now (not sales)? A rising rental-DOM trend means longer vacancies and softer asking-rent achievability than the comps imply.
- What's the recent tenant-quality profile in this submarket — average credit score on applications, eviction rate, late-payment / NSF rate, and stable-employment percentage? A property-management company in the area should have these aggregated.
- How much new apartment / multifamily construction is in the pipeline within 1–3 miles? Heavy new supply (>2% of stock underway) typically softens rents 12–24 months out; light construction supports rent growth.
Investment metrics
- 1% rule
- 1.36% ✓
- Cap rate
- 10.92%
- Cash-on-cash
- 16.54%
- DSCR
- 1.74
- GRM
- 6.1
CMA / ARV
- ARV (on-the-fly)
- $334,696
- Comps found
- 9
Show comp detail 9 sales within ~0.75 mi
| Address | Dist | Beds/Ba | Sqft | Sold | Price | $/sf | Match |
|---|---|---|---|---|---|---|---|
| 6 S 5th Ave | 0.24mi | 10/4.0 (+1) | 3,120 (-0%) | 7mo | $475,000 | $152 | 70 |
| 384 Norwich Ave | 0.35mi | 8/4.0 (-1) | 3,142 (+0%) | 9mo | $315,000 | $100 | 62 |
| 31-33 Merchants Ave | 0.29mi | 10/4.5 (+1) | 3,120 (-0%) | 20mo | $375,000 | $120 | 58 |
| 324 Norwich Ave | 0.36mi | 9/2.0 | 2,970 (-5%) | 10mo | $305,000 | $103 | 50 |
| 404 Norwich Ave | 0.37mi | 8/3.0 (-1) | 3,570 (+14%) | 1mo | $345,000 | $97 | 42 |
| 9 S 3rd Ave | 0.34mi | 8/4.0 (-1) | 2,800 (-10%) | 24mo | $299,900 | $107 | 34 |
| 352 Norwich Ave | 0.34mi | 8/3.0 (-1) | 2,856 (-9%) | 23mo | $246,000 | $86 | 34 |
| 412-414 NORWICH Ave | 0.38mi | 8/3.5 (-1) | 2,856 (-9%) | 23mo | $328,000 | $115 | 33 |
| 2 N 3rd Ave | 0.65mi | 8/4.0 (-1) | 2,840 (-9%) | 19mo | $475,000 | $167 | 25 |
Match score weights: distance 35% · size 25% · config 20% · recency 20%. Top-matched comps best support the ARV.
Projected returns pro-forma
-3.0% appreciation · 6.62% rent growth · sell at horizon
- IRR
- 11.7%
- Equity multiple
- 1.48×
- Total profit
- $54,164
- Equity at exit
- $59,626
- IRR
- 23.4%
- Equity multiple
- 3.37×
- Total profit
- $265,065
- Equity at exit
- $34,576
Cash invested: $111,972 (down + closing). Projections, not guarantees.
Landlord ↔ Tenant lean methodology
- Overall (STATE)
- 27 Tenant-Leaning
- State Connecticut
- 27 Tenant-Leaning · D+7
- County
- — inherits STATE
- City
- — inherits STATE
ZIP-level market 06360
- Home prices YoY
- -19.9%
- Rents YoY
- 6.6%
- Active inventory
- 241
- Price-to-rent
- 18.3×
Monthly cashflow live
- Estimated rent
- $5,452 medium interval (Pro) →
- Mortgage (P&I)
- −$2,097
- Tax est. 1.5%
- −$500 /mo · $5,998/yr
- Insurance
- −$167
- HOA
- −$0
- Vacancy / Maint / Mgmt
- −$1,145
- Net cashflow
- $1,543
Break-even live
3-unit breakdown (identical units grouped — click to expand)
| Units | Beds | Baths | Est. rent |
|---|---|---|---|
| 3× units | 3.0 | 2 | $5,451 |
| #1 | 3.0 | 2 | $1,817 |
| #2 | 3.0 | 2 | $1,817 |
| #3 | 3.0 | 2 | $1,817 |
| Total (3 units) | $5,452 | ||
UW: 25.0% down · 7.5% · 30yr · 1.5% tax · 5.0% vac · 8.0% maint · 8.0% mgmt
Financing live
Cash to close
- Down payment
- $99,975
- Closing costs
- $11,997
- Reserves months
- —
- Total cash needed
- —
Loan-product check · same deal, 3 products live
Conventional
25% down · 7.5% · 30yr
- Down + closing
- —
- Monthly P&I
- —
- Monthly cashflow
- —
- DSCR
- —
- Eligible?
- —
Personal DTI + credit; lowest rate.
DSCR
20% down · 8.5% · 30yr
- Down + closing
- —
- Monthly P&I
- —
- Monthly cashflow
- —
- DSCR
- —
- Eligible?
- —
No personal income docs; deal must DSCR.
Hard money
10% down · 12.0% · 12mo
- Down + closing
- —
- Monthly P&I
- —
- Monthly cashflow
- —
- DSCR
- —
- Eligible?
- —
Short-term bridge; refi at stabilization.
Listing history 13 events
-
2026-06-19days on market $399,900 Active 15 DOM
-
2026-06-18days on market $399,900 Active 14 DOM
-
2026-06-17days on market $399,900 Active 13 DOM
-
2026-06-16days on market $399,900 Active 12 DOM
-
2026-06-15days on market $399,900 Active 11 DOM
-
2026-06-14days on market $399,900 Active 9 DOM
-
2026-06-13days on market $399,900 Active 8 DOM
-
2026-06-10days on market $399,900 Active 6 DOM
-
2026-06-09days on market $399,900 Active 5 DOM
-
2026-06-08days on market $399,900 Active 4 DOM
-
2026-06-07statusdays on market $399,900 Active 3 DOM
-
2026-06-02remarks 695-char remark
-
2026-06-02$399,900 Coming Soon 1 DOM
ⓘ Source: listings_history table (triggers on properties + properties_extension) + one-shot
backfill from property_details.listing_events for pre-trigger history.
Climate risk First Street
- Flood 1/10 Low FEMA zone X (unshaded) · 0% chance over 30 yrs
- Wildfire 2/10 Low
- Heat 5/10 Major 7 d/yr ≥98°F today · 16 d/yr by 30 yrs out
- Wind 6/10 Major 62% chance of damaging wind over 30 yrs
- Air quality 3/10 Moderate 2 unhealthy d/yr today · 3 by 30 yrs out
Nearby sold comps map
Loading sold comps map…
Walkable amenities ~0.75 mi
Loading nearby amenities…
Taxation est. · year 1
- Rental income
- $65,424
- − Mortgage interest
- −$22,401
- − Property taxes
- −$5,998
- − Insurance
- −$2,000
- − Repairs & maintenance
- −$5,234
- − Management
- −$5,234
- − Depreciation
- −$11,633
- Taxable income
- $12,924
- Est. tax owed @ 24.0%
- −$3,102
- After-tax cash flow
- $15,420/yr
For passive investors: Depreciation is non-cash, so a rental often shows a tax loss while cash-flowing — sheltering income. Rental losses are passive: they offset passive income freely, and up to $25,000/yr can offset ordinary (W-2) income if you actively participate and your MAGI is under $100k (phasing out to $0 by $150k); unused losses carry forward. On sale, claimed depreciation is recaptured at up to 25%, and gains may owe capital-gains tax (a 1031 exchange can defer both). Figures are a year-1 estimate at your 24.0% rate — not tax advice; consult a CPA.
Condition & rehab AI · 13 photos
The home is in fair condition with some repairs and maintenance needed. Updating the kitchen and bathrooms, painting the exterior, and landscaping will significantly increase its value.
Repairs flagged
- Minor Kitchen countertops — The countertops appear to be in need of a fresh coat of paint or a new material.
- Minor Bathroom fixtures — The bathroom fixtures appear to be in need of a fresh coat of paint or a new material.
- Minor Exterior siding — The exterior siding appears to be in need of a fresh coat of paint or a new material.
- Minor Landscaping — The landscaping appears to be in need of some trimming and maintenance.
Value-add opportunities
- Resale Updating the kitchen countertops and backsplash — Updating the kitchen countertops and backsplash will make the kitchen more modern and appealing to potential buyers.
- Resale Updating the bathroom fixtures and paint — Updating the bathroom fixtures and paint will make the bathrooms more modern and appealing to potential buyers.
- Resale Painting the exterior siding — Painting the exterior siding will make the home more appealing to potential buyers and increase its curb appeal.
- Both Landscaping — Landscaping will improve the curb appeal and increase the home's value for both resale and rental.
Renovation cost estimate screening
| Repair item | Severity | Est. cost |
|---|---|---|
| Kitchen countertops · The countertops appear to be in need of a fresh coat of paint or a new material. | Minor | $500–3,000 |
| Bathroom fixtures · The bathroom fixtures appear to be in need of a fresh coat of paint or a new material. | Minor | $500–3,000 |
| Exterior siding · The exterior siding appears to be in need of a fresh coat of paint or a new material. | Minor | $500–3,000 |
| Landscaping · The landscaping appears to be in need of some trimming and maintenance. | Minor | $500–3,000 |
| Total estimated repair cost · 4 items | $2,000–12,000 |
Value-add ROI direction
- Resale Updating the kitchen countertops and backsplash — Updating the kitchen countertops and backsplash will make the kitchen more modern and appealing to potential buyers. ↑
- Resale Updating the bathroom fixtures and paint — Updating the bathroom fixtures and paint will make the bathrooms more modern and appealing to potential buyers. ↑
- Resale Painting the exterior siding — Painting the exterior siding will make the home more appealing to potential buyers and increase its curb appeal. ↑
- Both Landscaping — Landscaping will improve the curb appeal and increase the home's value for both resale and rental. ↑
ⓘ Cost ranges are severity-bucket heuristics (US national rule-of-thumb). Get contractor quotes + a written scope before underwriting a rehab budget.
Schools (NCES district)
- District
- Norwich School District
- NCES district ID
- 0903120
- Math proficiency
- 19% ▼ -8.00%
- Reading proficiency
- 29% ▼ -7.00%
- Median HH income
- $50,813
- Composite
- 21.27/100
- National rank
- #8395
- State rank
- #139 of 153 in CT
Livability — Norwich
- Score
- 81/100
- State rank
- #18
- US rank
- #1391
Category grades
Schools grade is shown separately in the Schools card above.
Census & demographics
- Census place
- Norwich, CT
- County
- New London County · 147,197 people
- City population
- 37,216
- Metro
- Norwich-New London, CT
- Population (ZIP)
- 37,216
- Household income
- $65,539
- Rent vs Own
- Severe rent burden
- 1643.0
Population outlook (Southeastern Connecticut County) Hauer SSP2
- By 2040
- 293,442
Race, ethnicity, and origin ACS 2023
- Neighborhood character
- Diverse neighborhood (Simpson 0.63)
- Race & ethnicity
- White 56% Hispanic / Latino 21% Two or more races 12% Black 10% Asian 7%
- Hispanic origin (detail)
- Mexican 3% Puerto Rican 9% Cuban 1% Dominican 3%
- Common ancestry
- Lithuanian 8% Romanian 5% Hispanic 4%
- Foreign-born
- 15% · Canada, China
- Languages at home
- 77% English-only · Spanish 11% French/Haitian/Cajun 4% Chinese 3%
Political lean MEDSL · Southeastern Connecticut
- 2024 margin
- D (+13.0) · D 55.6% · R 42.6% · Other 1.8%
- All cycles
- 2024: D+13.0
Not yet ingested
- Civics
- —
Market trends
- HPI YoY
- ▼ -65.27%
- Current HPI
- 261.8575
- Rent YoY
- ▲ 6.62%
- Metro
- Norwich-New London, CT
- State GDP YoY
- ▲ 1.06%
- F500 in state
- 38
Industry mix (Fortune 500 HQ in CT)
| Industry | F500 HQs | Revenue |
|---|---|---|
| Industrial Machinery | 4 | $38B |
|
||
| Insurance | 3 | $71B |
|
||
| Financial Services | 2 | $25B |
|
||
| Transportation / Logistics | 2 | $18B |
|
||
| Healthcare | 1 | $247B |
|
||
| Telecommunications | 1 | $55B |
|
||
Price history
1 event — show timeline
- 2026-06-01 Coming Soon $399,900 Smart MLS
Cash-flow waterfall
monthlySold comps — $/sqft
last 12 mo · ≤1 miLoading sold comps…