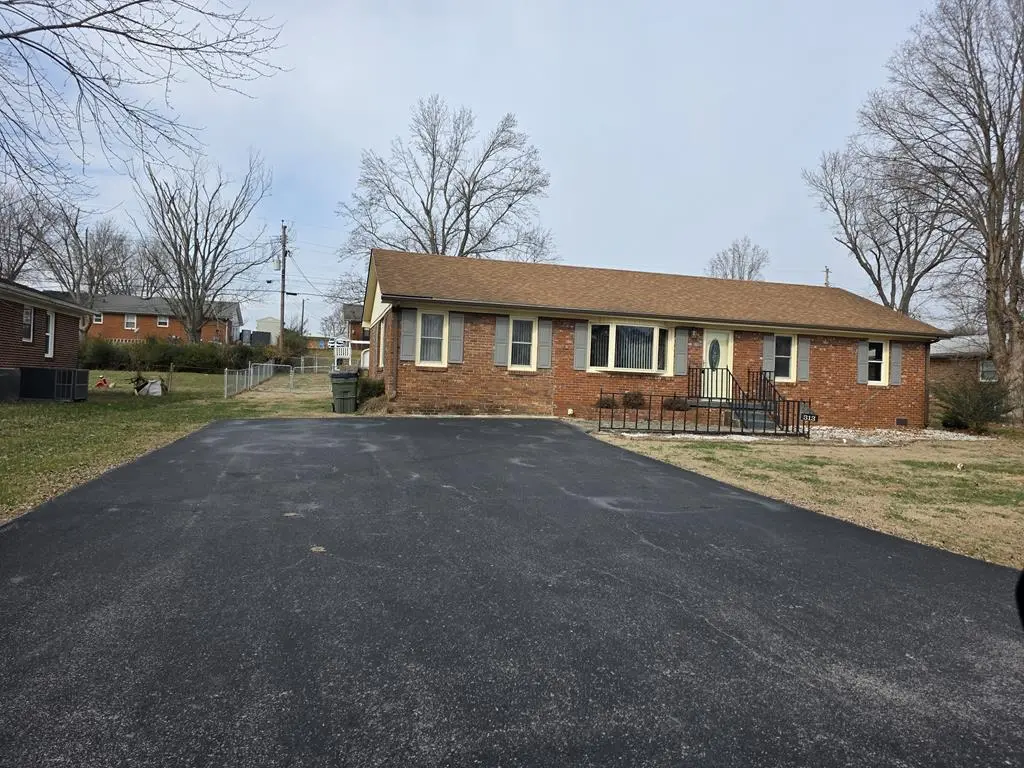
313 Wayne Dr · Hopkinsville, KY
Flood risk 1/10 · Minimal
- FEMA flood zone
- X (unshaded)
- Chance of flooding over 30 yrs
- 0.0%
- Est. flood insurance / yr
- $507 – $1,088
Fire risk 1/10 · Minimal
- Est. fire insurance / yr
- $839 – $1,559
Heat risk 5/10 · Moderate
- Hot days now (above 107°F)
- 7 days/yr
- Hot days in 30 yrs
- 20 days/yr
Wind risk 4/10 · Minor
- Chance of severe wind over 30 yrs
- 10.0%
Air-quality risk 2/10 · Minimal
- Unhealthy air days now
- 0 days/yr
- Unhealthy air days in 30 yrs
- 1 days/yr
Risk factors via First Street. Map © Google.
Why this score? — see what drove the C- grade
The composite is a weighted blend of 9 inputs, each scored 0–100. Each bar is that input's sub-score; the figure is the points it added to the 100-point composite (weight × sub-score).
- Cash flow +16.6/30.0
- ARV discount +12.7/15.0
- DSCR +5.1/10.0
- Rent growth +4.2/5.0
- 1% rule +3.2/10.0
- Livability +3.2/5.0
- Schools +2.7/10.0
- Condition / age +2.5/5.0
- Appreciation +0.0/10.0
$180,000
🖨 Deal sheet 📄 Offer letter ✓ Due diligence
Listing remarks MLS
Charming 3-Bedroom Home in an Established Neighborhood. This inviting 3-bedroom, 1.5-bath home offers classic character and comfortable living. Highlights include new wndows, hardwood floors beneath the carpet, a formal living room plus a cozy den, and a screened-in porch perfect for morning coffee or evening relaxation. Enjoy a fully fenced backyard ideal for pets or entertaining, along with a one-car detached garage. A wonderful opportunity to own a home with timeless appeal in a well-established neighborhood.
Key facts
- Cozy den
- Screened-in porch
- Formal living room
Tags
Neighborhood map
What this means for you Summary
Snapshot
- This is a 3-bed/1.5-bath single-family listed at $180k.
Deal economics
- At list price, monthly cash flow is $108 ($1k/yr) — positive.
- The deal already cash-flows at list — no discount required.
- To meet the 1% rule (rent ≥ 1% of price), the offer needs to be $148k (17.9% below list).
- Recommended offer: $148k (17.9% below list) — sets the bar for 1% rule.
- Cap rate 7.0% vs local median 4.3% in Hopkinsville — top-decile yield for the area; either an underpriced asset or a hidden risk that comps aren't pricing in. Stress-test before assuming the spread holds.
Location & tenants
- Location reads 64/100 on livability (#305 in KY) — a middle-class / working-renter tenant base. Strengths: cost of living A+, housing A, health & safety B+; Watch: schools D+, crime F, amenities F.
- Christian County (town): math 30% / reading 34% proficiency, ranked #93 of 165 in KY (top 56%) — families likely to look elsewhere, expect single-tenant / working-renter base with shorter leases; 61% free/reduced lunch — lower-income household profile, screen leases tightly.
- Market conditions: Rents rising fast (+6.6%/yr); 252 active listings in the ZIP; 8 comparable units currently listed for rent nearby; rentals at typical pace (median 22d on market — plan ~3-4 weeks tenant-placement turnaround); 193 units permitted in Christian County in 2024 (66 in 5+ unit buildings).
- This rent runs 34% of the median local income ($52k/yr) — at the standard rent-burdened threshold; future hikes will face affordability resistance.
Forward outlook
- Local home prices are declining (-3.0%/yr); year-one equity from $1k of loan paydown is wiped out by about $5k of value loss. Plan a longer hold.
- Christian County population projected at -20% by 2050 — secular population decline; favor cash flow + early exit over multi-decade hold.
Negotiation context
- It's been on market 165 days — a 12% lower offer ($158k) is reasonable based on typical stale-listing flexibility.
- 3 sale attempts with the ask held roughly flat each time — persistent listings suggest the price (not the market) is what's stuck; bring a comps-based counter.
Risks & watch-outs
- Climate carrying-cost: extreme-heat days projected 7→20/yr by 2055 (HVAC capex compounding) — expect insurance premiums to compound above CPI over the hold.
Questions for the listing agent
- It's been on market 165 days. Have you received any prior offers? Is the seller open to a 18% concession, seller financing, or rate buy-down credit?
- Built in 1964 — when were the roof, HVAC, electrical panel, plumbing, and water heater last replaced?
- Why hasn't it sold? Are there any deal-killer items the seller is aware of (foundation, flood, title, zoning, code violations)?
- Is there a deadline driving the sale (1031 exchange, divorce, estate, relocation)? That informs how much negotiation room exists.
- Schools are D-rated, which usually means shorter tenancies and higher turnover. Who's the typical renter profile here, and what's been the actual vacancy rate?
- Crime grade is F in this area — have there been break-ins, vandalism, or insurance claims at this property in the last 3 years? What carrier currently insures it and at what premium?
- What's the average days-on-market for RENTAL listings here right now (not sales)? A rising rental-DOM trend means longer vacancies and softer asking-rent achievability than the comps imply.
- What's the recent tenant-quality profile in this submarket — average credit score on applications, eviction rate, late-payment / NSF rate, and stable-employment percentage? A property-management company in the area should have these aggregated.
- How much new for-sale + rental construction is in the pipeline within 1–3 miles? Heavy new supply typically softens prices + rents 12–24 months out; constrained supply supports both.
Investment metrics
- 1% rule
- 0.82% ✗
- Cap rate
- 7.01%
- Cash-on-cash
- 2.57%
- DSCR
- 1.11
- GRM
- 10.1
CMA / ARV
- ARV (median comp)
- $203,292
- List price
- $180,000
- Delta
- -11.46%
- Verdict
- UNDERPRICED
- Comps
- 20 within 1.0 mi
Show comp detail 12 sales within ~0.75 mi
| Address | Dist | Beds/Ba | Sqft | Sold | Price | $/sf | Match |
|---|---|---|---|---|---|---|---|
| 320 Blane Dr | 0.04mi | 3/2.0 | 1,571 (-6%) | 1mo | $271,500 | $173 | 84 |
| 417 Henderson Dr | 0.35mi | 4/2.0 (+1) | 1,680 (0%) | 1mo | $211,000 | $126 | 76 |
| 2532 Thrush Dr | 0.46mi | 4/1.5 (+1) | 1,680 (0%) | 2mo | $155,000 | $92 | 72 |
| 115 Donna Dr | 0.31mi | 3/2.0 | 1,746 (+4%) | 6mo | $199,000 | $114 | 72 |
| 101 Country Club Ln | 0.47mi | 3/2.0 | 1,711 (+2%) | 5mo | $239,900 | $140 | 69 |
| 210 Wayne Dr | 0.16mi | 3/2.0 | 1,474 (-12%) | 5mo | $165,000 | $112 | 66 |
| 316 Tremont Dr | 0.63mi | 3/2.0 | 1,690 (+1%) | 3mo | $245,000 | $145 | 65 |
| 114 Donna Dr | 0.28mi | 3/2.0 | 1,839 (+10%) | 7mo | $269,900 | $147 | 64 |
| 135 Donna Dr | 0.48mi | 3/2.0 | 1,539 (-8%) | 3mo | $165,000 | $107 | 59 |
| 119 Millbrooke Dr | 0.32mi | 3/2.0 | 1,880 (+12%) | 6mo | $200,000 | $106 | 58 |
| 310 Donna Dr | 0.46mi | 3/2.0 | 1,454 (-14%) | 0mo | $248,400 | $171 | 54 |
| 398 Irish Cir | 0.69mi | 2/1.5 (-1) | 1,429 (-15%) | 6mo | $275,000 | $192 | 33 |
Match score weights: distance 35% · size 25% · config 20% · recency 20%. Top-matched comps best support the ARV.
Projected returns pro-forma
-3.0% appreciation · 6.61% rent growth · sell at horizon
- IRR
- -8.8%
- Equity multiple
- 0.67×
- Total profit
- $-16,814
- Equity at exit
- $26,839
- IRR
- 4.4%
- Equity multiple
- 1.37×
- Total profit
- $18,448
- Equity at exit
- $15,563
Cash invested: $50,400 (down + closing). Projections, not guarantees.
Landlord ↔ Tenant lean methodology
- Overall (STATE)
- 83 Strongly Landlord-Friendly
- State Kentucky
- 83 Strongly Landlord-Friendly · R+16
- County
- — inherits STATE
- City
- — inherits STATE
ZIP-level market 42240
- Home prices YoY
- -17.5%
- Rents YoY
- 6.6%
- Active inventory
- 252
- Price-to-rent
- 10.1×
Monthly cashflow live
- Estimated rent
- $1,479 high interval (Pro) →
- Mortgage (P&I)
- −$944
- Tax from tax record
- −$41 /mo · $495/yr
- Insurance
- −$75
- HOA
- −$0
- Vacancy / Maint / Mgmt
- −$311
- Net cashflow
- $108
Break-even live
UW: 25.0% down · 7.5% · 30yr · 1.5% tax · 5.0% vac · 8.0% maint · 8.0% mgmt
Financing live
Cash to close
- Down payment
- $45,000
- Closing costs
- $5,400
- Reserves months
- —
- Total cash needed
- —
Loan-product check · same deal, 3 products live
Conventional
25% down · 7.5% · 30yr
- Down + closing
- —
- Monthly P&I
- —
- Monthly cashflow
- —
- DSCR
- —
- Eligible?
- —
Personal DTI + credit; lowest rate.
DSCR
20% down · 8.5% · 30yr
- Down + closing
- —
- Monthly P&I
- —
- Monthly cashflow
- —
- DSCR
- —
- Eligible?
- —
No personal income docs; deal must DSCR.
Hard money
10% down · 12.0% · 12mo
- Down + closing
- —
- Monthly P&I
- —
- Monthly cashflow
- —
- DSCR
- —
- Eligible?
- —
Short-term bridge; refi at stabilization.
Rent comps 8 comps
| Address | Beds | Baths | Sqft | Rent | $/sqft | DOM | Units | Dist |
|---|---|---|---|---|---|---|---|---|
| 106 Sherwood Dr Hopkinsville, KY | 4.0 | 1.5 | 1600 | $1,500 | $0.94 | 14d | 1 | 0.08mi |
| 1050 Denzil Dr Hopkinsville, KY | 2.0 | 1.0–2.0 | 1105 | $1,138 | $1.03 | 14d | 21 | 0.90mi |
| 706 Fremont Pl Hopkinsville, KY | 3.0 | 2.0 | 1500 | $1,450 | $0.97 | 14d | 1 | 1.01mi |
| 202 Morningside Dr Hopkinsville, KY | 3.0 | 2.0 | 1188 | $1,400 | $1.18 | 21d | 1 | 1.14mi |
| 1523 Canton St Hopkinsville, KY | 3.0 | 2.0 | 1700 | $1,550 | $0.91 | 44d | 1 | 1.33mi |
| 3639 St Hopkinsville, KY | 3.0 | 2.0 | 1816 | $2,100 | $1.16 | 44d | 1 | 1.38mi |
| 3639 St Hopkinsville, KY | 3.0 | 2.0 | 1816 | $2,100 | $1.16 | 14d | 1 | 1.38mi |
| 316 Fairview Dr Hopkinsville, KY | 2.0 | 1.0 | 1077 | $1,095 | $1.02 | 21d | 1 | 1.46mi |
Listing history 19 events
-
2026-06-18days on market $180,000 Active 165 DOM
-
2026-06-17days on market $180,000 Active 164 DOM
-
2026-06-16days on market $180,000 Active 163 DOM
-
2026-06-15days on market $180,000 Active 162 DOM
-
2026-06-14days on market $180,000 Active 160 DOM
-
2026-06-13days on market $180,000 Active 159 DOM
-
2026-06-10days on market $180,000 Active 157 DOM
-
2026-06-09days on market $180,000 Active 156 DOM
-
2026-06-08days on market $180,000 Active 155 DOM
-
2026-06-07days on market $180,000 Active 154 DOM
-
2026-06-02days on market $180,000 Active 149 DOM
-
2026-06-01days on market $180,000 Active 148 DOM
-
2026-05-31days on market $180,000 Active 147 DOM
-
2026-05-30days on market $180,000 Active 146 DOM
-
2026-05-08price $180,000 517-char remark
Show marketing remark (517 chars)
Charming 3-Bedroom Home in an Established Neighborhood. This inviting 3-bedroom, 1.5-bath home offers classic character and comfortable living. Highlights include new wndows, hardwood floors beneath the carpet, a formal living room plus a cozy den, and a screened-in porch perfect for morning coffee or evening relaxation. Enjoy a fully fenced backyard ideal for pets or entertaining, along with a one-car detached garage. A wonderful opportunity to own a home with timeless appeal in a well-established neighborhood.
-
2026-01-04$185,000 Active 517-char remark
Show marketing remark (517 chars)
Charming 3-Bedroom Home in an Established Neighborhood. This inviting 3-bedroom, 1.5-bath home offers classic character and comfortable living. Highlights include new wndows, hardwood floors beneath the carpet, a formal living room plus a cozy den, and a screened-in porch perfect for morning coffee or evening relaxation. Enjoy a fully fenced backyard ideal for pets or entertaining, along with a one-car detached garage. A wonderful opportunity to own a home with timeless appeal in a well-established neighborhood.
-
2025-10-30historical
-
2025-08-07$190,000 Active
-
2025-06-02$190,000 Active
ⓘ Source: listings_history table (triggers on properties + properties_extension) + one-shot
backfill from property_details.listing_events for pre-trigger history.
Tax reassessment forecast KY · Resets to sale price
- Current annual tax
- $495 · $41/mo
- Projected year-2 tax
- $1,548 · $129/mo
- Expected delta
- +$1,053/yr (+$88/mo · 213.0%)
ⓘ Screening estimate from a state-policy table — verify with the county assessor before closing.
Climate risk First Street
- Flood 1/10 Low FEMA zone X (unshaded) · 0% chance over 30 yrs
- Wildfire 1/10 Low
- Heat 5/10 Major 7 d/yr ≥107°F today · 20 d/yr by 30 yrs out
- Wind 4/10 Moderate 10% chance of damaging wind over 30 yrs
- Air quality 2/10 Low 0 unhealthy d/yr today · 1 by 30 yrs out
Nearby sold comps map
Loading sold comps map…
Walkable amenities ~0.75 mi
Loading nearby amenities…
Taxation est. · year 1
- Rental income
- $17,744
- − Mortgage interest
- −$10,083
- − Property taxes
- −$495
- − Insurance
- −$900
- − Repairs & maintenance
- −$1,420
- − Management
- −$1,420
- − Depreciation
- −$5,236
- Taxable loss
- −$1,809
- Est. tax savings @ 24.0%
- +$434
- After-tax cash flow
- $1,730/yr
For passive investors: Depreciation is non-cash, so a rental often shows a tax loss while cash-flowing — sheltering income. Rental losses are passive: they offset passive income freely, and up to $25,000/yr can offset ordinary (W-2) income if you actively participate and your MAGI is under $100k (phasing out to $0 by $150k); unused losses carry forward. On sale, claimed depreciation is recaptured at up to 25%, and gains may owe capital-gains tax (a 1031 exchange can defer both). Figures are a year-1 estimate at your 24.0% rate — not tax advice; consult a CPA.
Schools (NCES district)
- District
- Christian County
- NCES district ID
- 2101150
- Math proficiency
- 30% ▼ -9.00%
- Reading proficiency
- 34% ▼ -10.00%
- Median HH income
- $38,961
- Composite
- 26.8/100
- National rank
- #7118
- State rank
- #93 of 165 in KY
Livability — Hopkinsville
- Score
- 64/100
- State rank
- #305
- US rank
- #14474
Category grades
Schools grade is shown separately in the Schools card above.
Census & demographics
- Census place
- Hopkinsville, KY
- County
- Christian County · 51,080 people
- City population
- 41,415
- Metro
- Clarksville, TN-KY
- Population (ZIP)
- 41,415
- Household income
- $51,534
- Rent vs Own
- Severe rent burden
- 1475.0
Population outlook (Christian County) Hauer SSP2
- Today (2025)
- 67,861 people
- By 2030
- 65,808 · -3.0%
- By 2040
- 60,090 · -11.5%
- By 2050
- 54,561 · -19.6%
- By 2075
- 45,859 · -32.4%
- By 2100
- 38,310 · -43.5%
Race, ethnicity, and origin ACS 2023
- Neighborhood character
- Majority White (65%)
- Race & ethnicity
- White 65% Black 23% Two or more races 7% Hispanic / Latino 4%
- Common ancestry
- Slovak 3% Italian 1% Romanian 1%
- Foreign-born
- 3% · Canada
- Languages at home
- 95% English-only · Spanish 3% German/W. Germanic 1%
Political lean MEDSL · Christian
- 2024 margin
- Solid R (+33.6) · D 32.6% · R 66.1% · Other 1.3%
- 2008→2024 swing
- -12.4pp toward R · 2008: -21.2pp · 2024: -33.6pp
- All cycles
- 2024: R+33.6 2020: R+28.4 2016: R+31.4 2012: R+23.8 2008: R+21.2
Not yet ingested
- Civics
- —
Market trends
- HPI YoY
- ▼ -49.36%
- Current HPI
- 233.3958
- Rent YoY
- ▲ 6.61%
- Metro
- Clarksville, TN-KY
- State GDP YoY
- ▲ 1.81%
- F500 in state
- 4
Industry mix (Fortune 500 HQ in KY)
| Industry | F500 HQs | Revenue |
|---|---|---|
| Healthcare | 1 | $118B |
|
||
| Food / Beverage | 1 | $7B |
|
||
Price history
-5.3% since first listed5 events — show timeline
- 2026-05-08 Price Changed $180,000 HCTCBOR
- 2026-01-04 Listed $185,000 HCTCBOR
- 2025-10-30 Listing Removed — REALTRACS as Distributed by MLS Grid
- 2025-08-07 Listed $190,000 REALTRACS as Distributed by MLS Grid
- 2025-06-02 Listed $190,000 WKRMLS
Property tax history
-3.0%/yrLatest (2025): $495 · -8.1% YoY. Source: county tax records.
Cash-flow waterfall
monthlySold comps — $/sqft
last 12 mo · ≤1 miLoading sold comps…