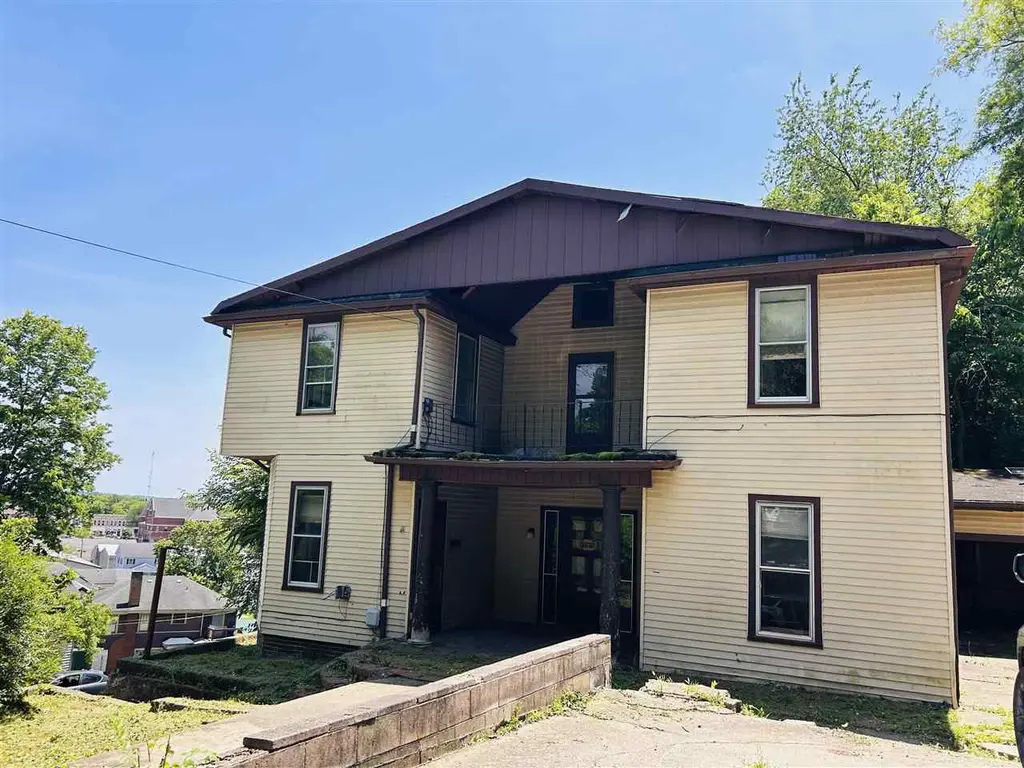
511 W 5th St · Connersville, IN
Flood risk 1/10 · Minimal
- FEMA flood zone
- X (unshaded)
- Chance of flooding over 30 yrs
- 0.0%
- Est. flood insurance / yr
- $473 – $860
Fire risk 1/10 · Minimal
- Est. fire insurance / yr
- $717 – $1,331
Heat risk 3/10 · Minor
- Hot days now (above 101°F)
- 7 days/yr
- Hot days in 30 yrs
- 19 days/yr
Wind risk 2/10 · Minimal
- Chance of severe wind over 30 yrs
- 1.0%
Air-quality risk 2/10 · Minimal
- Unhealthy air days now
- 0 days/yr
- Unhealthy air days in 30 yrs
- 1 days/yr
Risk factors via First Street. Map © Google.
Why this score? — see what drove the B grade
The composite is a weighted blend of 9 inputs, each scored 0–100. Each bar is that input's sub-score; the figure is the points it added to the 100-point composite (weight × sub-score).
- Cash flow +30.0/30.0
- 1% rule +10.0/10.0
- DSCR +10.0/10.0
- ARV discount +7.5/15.0
- Livability +3.2/5.0
- Schools +2.9/10.0
- Rent growth +2.5/5.0
- Condition / age +2.5/5.0
- Appreciation +2.3/10.0
$37,500
🖨 Deal sheet 📄 Offer letter ✓ Due diligence
Listing remarks
Investor opportunity! This historic duplex, built in 1911, offers 2,784 square feet of potential and is ready for its next owner to bring it back to life. Each unit features 2 bedrooms and 1 bathroom, providing an excellent opportunity for rental income, a renovation project, or an addition to an investment portfolio. Possibly qualifying for an Indiana Historical Preservation Grant to help with the offset the expense of restoring this home. Full of character and historic charm, this property is ready for some TLC and updates to maximize its value. A unique feature of the home is the natural stream that has continuously flowed through the basement for many years, adding to the property's dis
Key facts
- Historic duplex
- Natural stream
- 3,920 sq ft lot
Tags
Property features AI
Exterior
- Parking: Attached garage
- Utilities: Public water; Public sewer
- Home design: Duplex residential income property; 2 stories
- Construction: Wood siding
- Exterior features: Shingle roof
Interior
- Interior features: Full basement
Neighborhood map
What this means for you Summary
Snapshot
- This is a 4-bed/2.0-bath single-family listed at $38k.
Deal economics
- At list price, monthly cash flow is $889 ($11k/yr) — positive.
- The deal already cash-flows at list — no discount required.
- Meets the 1% rule at list price ($1k rent vs $38k).
- Cap rate 34.7% vs local median 4.9% in Connersville — top-decile yield for the area; either an underpriced asset or a hidden risk that comps aren't pricing in. Stress-test before assuming the spread holds.
Location & tenants
- Location reads 65/100 on livability (#313 in IN) — a middle-class / working-renter tenant base. Strengths: cost of living A+, housing A+; Watch: health & safety C-, crime D+, schools D-.
- Fayette County School Corporation (town): math 29% / reading 40% proficiency, ranked #206 of 301 in IN (top 68%) — families likely to look elsewhere, expect single-tenant / working-renter base with shorter leases.
- Market conditions: 171 active listings in the ZIP; 20 units permitted in Fayette County in 2024 (0 in 5+ unit buildings).
Forward outlook
- Local home prices are declining (-3.0%/yr); year-one equity from $259 of loan paydown is wiped out by about $1k of value loss. Plan a longer hold.
- Fayette County population projected at -26% by 2050 — secular population decline; favor cash flow + early exit over multi-decade hold.
- At projected returns (-3.0% appreciation + 3.0% rent growth), your $10k cash investment doubles in ~2 years — after that, you're playing with house money.
Negotiation context
- Only 2 days on market — expect competitive offers; lowballing is unlikely to land.
Risks & watch-outs
- Watch-outs: built in 1911 — expect roof / HVAC / electrical / plumbing capex.
Questions for the listing agent
- Built in 1911 — when were the roof, HVAC, electrical panel, plumbing, and water heater last replaced?
- Is there a deadline driving the sale (1031 exchange, divorce, estate, relocation)? That informs how much negotiation room exists.
- Schools are D-rated, which usually means shorter tenancies and higher turnover. Who's the typical renter profile here, and what's been the actual vacancy rate?
- Crime grade is D in this area — have there been break-ins, vandalism, or insurance claims at this property in the last 3 years? What carrier currently insures it and at what premium?
- What's the average days-on-market for RENTAL listings here right now (not sales)? A rising rental-DOM trend means longer vacancies and softer asking-rent achievability than the comps imply.
- What's the recent tenant-quality profile in this submarket — average credit score on applications, eviction rate, late-payment / NSF rate, and stable-employment percentage? A property-management company in the area should have these aggregated.
- How much new for-sale + rental construction is in the pipeline within 1–3 miles? Heavy new supply typically softens prices + rents 12–24 months out; constrained supply supports both.
Investment metrics
- 1% rule
- 3.97% ✓
- Cap rate
- 34.74%
- Cash-on-cash
- 101.58%
- DSCR
- 5.52
- GRM
- 2.1
CMA / ARV
- ARV (on-the-fly)
- $167,040
- Comps found
- 9
Show comp detail 9 sales within ~0.75 mi
| Address | Dist | Beds/Ba | Sqft | Sold | Price | $/sf | Match |
|---|---|---|---|---|---|---|---|
| 310 3rd St | 0.18mi | 3/2.5 (-1) | 2,864 (+3%) | 5mo | $120,000 | $42 | 76 |
| 800 Prospect St | 0.12mi | 4/2.5 | 3,170 (+14%) | 6mo | $54,900 | $17 | 64 |
| 1312 W Country Club Rd | 0.47mi | 4/3.0 | 2,537 (-9%) | 2mo | $270,000 | $106 | 57 |
| 929 Central Ave | 0.47mi | 4/1.5 | 2,492 (-10%) | 12mo | $85,000 | $34 | 48 |
| 306 12th St | 0.51mi | 4/2.0 | 3,059 (+10%) | 19mo | $182,000 | $59 | 44 |
| 3565 225 W | 0.62mi | 4/3.0 | 2,899 (+4%) | 20mo | $300,000 | $103 | 44 |
| 315 Center Dr | 0.53mi | 3/1.5 (-1) | 2,426 (-13%) | 6mo | $145,000 | $60 | 42 |
| 214 W 11th St | 0.49mi | 5/2.0 (+1) | 2,372 (-15%) | 20mo | $180,000 | $76 | 30 |
| 1314 N Grand Ave | 0.69mi | 3/2.0 (-1) | 2,428 (-13%) | 19mo | $200,000 | $82 | 26 |
Match score weights: distance 35% · size 25% · config 20% · recency 20%. Top-matched comps best support the ARV.
Projected returns pro-forma
-3.0% appreciation · 3.0% rent growth · sell at horizon
- IRR
- —
- Equity multiple
- 5.82×
- Total profit
- $50,573
- Equity at exit
- $5,591
- IRR
- —
- Equity multiple
- 12.15×
- Total profit
- $117,093
- Equity at exit
- $3,242
Cash invested: $10,500 (down + closing). Projections, not guarantees.
Landlord ↔ Tenant lean methodology
- Overall (STATE)
- 90 Strongly Landlord-Friendly
- State Indiana
- 90 Strongly Landlord-Friendly · R+11
- County
- — inherits STATE
- City
- — inherits STATE
ZIP-level market 47331
- Home prices YoY
- -2.1%
- Active inventory
- 171
- Price-to-rent
- 2.1×
Monthly cashflow live
- Estimated rent
- $1,488 medium interval (Pro) →
- Mortgage (P&I)
- −$197
- Tax from tax record
- −$74 /mo · $894/yr
- Insurance
- −$16
- HOA
- −$0
- Vacancy / Maint / Mgmt
- −$313
- Net cashflow
- $889
Break-even live
UW: 25.0% down · 7.5% · 30yr · 1.5% tax · 5.0% vac · 8.0% maint · 8.0% mgmt
Financing live
Cash to close
- Down payment
- $9,375
- Closing costs
- $1,125
- Reserves months
- —
- Total cash needed
- —
Loan-product check · same deal, 3 products live
Conventional
25% down · 7.5% · 30yr
- Down + closing
- —
- Monthly P&I
- —
- Monthly cashflow
- —
- DSCR
- —
- Eligible?
- —
Personal DTI + credit; lowest rate.
DSCR
20% down · 8.5% · 30yr
- Down + closing
- —
- Monthly P&I
- —
- Monthly cashflow
- —
- DSCR
- —
- Eligible?
- —
No personal income docs; deal must DSCR.
Hard money
10% down · 12.0% · 12mo
- Down + closing
- —
- Monthly P&I
- —
- Monthly cashflow
- —
- DSCR
- —
- Eligible?
- —
Short-term bridge; refi at stabilization.
Listing history 3 events
-
2026-05-31status $37,500 Pending 2 DOM
-
2026-05-31days on market $37,500 Active 2 DOM
-
2026-05-29$37,500 Active
ⓘ Source: listings_history table (triggers on properties + properties_extension) + one-shot
backfill from property_details.listing_events for pre-trigger history.
Tax reassessment forecast IN · Partial reset (capped growth)
- Current annual tax
- $894 · $74/mo
- Projected year-2 tax
- $894 · $74/mo
- Expected delta
- $0/yr ($0/mo · 0.0%)
ⓘ Screening estimate from a state-policy table — verify with the county assessor before closing.
Climate risk First Street
- Flood 1/10 Low FEMA zone X (unshaded) · 0% chance over 30 yrs
- Wildfire 1/10 Low
- Heat 3/10 Moderate 7 d/yr ≥101°F today · 19 d/yr by 30 yrs out
- Wind 2/10 Low 100% chance of damaging wind over 30 yrs
- Air quality 2/10 Low 0 unhealthy d/yr today · 1 by 30 yrs out
Nearby sold comps map
Loading sold comps map…
Walkable amenities ~0.75 mi
Loading nearby amenities…
Taxation est. · year 1
- Rental income
- $17,857
- − Mortgage interest
- −$2,101
- − Property taxes
- −$894
- − Insurance
- −$188
- − Repairs & maintenance
- −$1,429
- − Management
- −$1,429
- − Depreciation
- −$1,091
- Taxable income
- $10,727
- Est. tax owed @ 24.0%
- −$2,575
- After-tax cash flow
- $8,091/yr
For passive investors: Depreciation is non-cash, so a rental often shows a tax loss while cash-flowing — sheltering income. Rental losses are passive: they offset passive income freely, and up to $25,000/yr can offset ordinary (W-2) income if you actively participate and your MAGI is under $100k (phasing out to $0 by $150k); unused losses carry forward. On sale, claimed depreciation is recaptured at up to 25%, and gains may owe capital-gains tax (a 1031 exchange can defer both). Figures are a year-1 estimate at your 24.0% rate — not tax advice; consult a CPA.
Schools (NCES district)
- District
- Fayette County School Corporation
- NCES district ID
- 1803510
- Math proficiency
- 29% ▼ -11.00%
- Reading proficiency
- 40% ▼ -8.00%
- Median HH income
- $38,669
- Composite
- 28.81/100
- National rank
- #6659
- State rank
- #206 of 301 in IN
Livability — Connersville
- Score
- 65/100
- State rank
- #313
- US rank
- #12417
Category grades
Schools grade is shown separately in the Schools card above.
Census & demographics
- Census place
- Connersville, IN
- Population (ZIP)
- 22,769
Population outlook (Fayette County) Hauer SSP2
- Today (2025)
- 21,758 people
- By 2030
- 20,673 · -5.0%
- By 2040
- 18,335 · -15.7%
- By 2050
- 16,056 · -26.2%
- By 2075
- 11,030 · -49.3%
- By 2100
- 6,800 · -68.7%
Race, ethnicity, and origin ACS 2023
- Neighborhood character
- Predominantly White (94%)
- Race & ethnicity
- White 94% Two or more races 4% Hispanic / Latino 1% Black 1%
- Common ancestry
- Italian 2% Slovak 1% Lithuanian 1%
- Foreign-born
- 1% · Canada
- Languages at home
- 98% English-only · Spanish 1%
Political lean MEDSL · Fayette
- 2024 margin
- Solid R (+56.3) · D 21.2% · R 77.5% · Other 1.3%
- 2008→2024 swing
- -50.8pp toward R · 2008: -5.6pp · 2024: -56.3pp
- All cycles
- 2024: R+56.3 2020: R+54.4 2016: R+48.1 2012: R+16.9 2008: R+5.6
Not yet ingested
- Civics
- —
Market trends
- HPI YoY
- ▼ -5.33%
- Current HPI
- 252.3898
- Rent YoY
- —
- Metro
- —
- State GDP YoY
- ▲ 2.90%
- F500 in state
- 18
Industry mix (Fortune 500 HQ in IN)
| Industry | F500 HQs | Revenue |
|---|---|---|
| Industrial Machinery | 2 | $37B |
|
||
| Healthcare | 1 | $177B |
|
||
| Pharmaceuticals | 1 | $45B |
|
||
| Metals / Steel | 1 | $18B |
|
||
| Agriculture | 1 | $17B |
|
||
| Packaging | 1 | $12B |
|
||
Price history
1 event — show timeline
- 2026-05-29 Listed $37,500 RRELMS
Property tax history
+4.8%/yrLatest (2024): $894 · +29.9% YoY. Source: county tax records.
Cash-flow waterfall
monthlySold comps — $/sqft
last 12 mo · ≤1 miLoading sold comps…