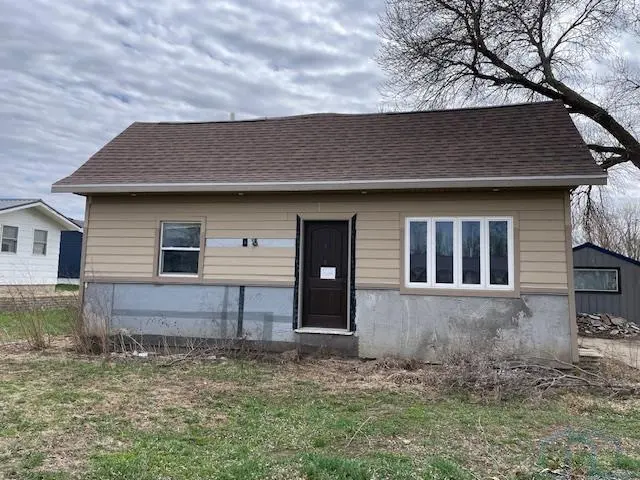
96 South St · Akron, IA
Flood risk 1/10 · Minimal
- FEMA flood zone
- X (unshaded)
- Chance of flooding over 30 yrs
- 0.0%
- Est. flood insurance / yr
- $473 – $860
Fire risk 4/10 · Minor
- Est. fire insurance / yr
- $902 – $1,676
Heat risk 3/10 · Minor
- Hot days now (above 103°F)
- 7 days/yr
- Hot days in 30 yrs
- 15 days/yr
Wind risk 2/10 · Minimal
- Chance of severe wind over 30 yrs
- —
Air-quality risk 2/10 · Minimal
- Unhealthy air days now
- 1 days/yr
- Unhealthy air days in 30 yrs
- 1 days/yr
Risk factors via First Street. Map © Google.
Why this score? — see what drove the A- grade
The composite is a weighted blend of 9 inputs, each scored 0–100. Each bar is that input's sub-score; the figure is the points it added to the 100-point composite (weight × sub-score).
- Cash flow +30.0/30.0
- 1% rule +10.0/10.0
- DSCR +10.0/10.0
- Appreciation +8.2/10.0
- ARV discount +7.5/15.0
- Schools +6.5/10.0
- Livability +3.7/5.0
- Rent growth +2.5/5.0
- Condition / age +2.5/5.0
$70,364
🖨 Deal sheet (PDF) 📄 Offer letter ✓ Due diligence
Listing remarks
4 Bedroom, 2 Bath home on nice level lot. Large shed. Needs some work but Lots of potential. Much bigger than it looks. This is a USDA property being sold AS IS WHERE IS & is subject to a 5% buyers premium or $1,500. Minimum + $995. Closing coordinator fee. Title will be conveyed by quit claim deed. All offers to be submitted to Https://MYNEXTBID.com. Visit the website for additional information.
Key facts
- 0.28 acre lot
- Built 1940
- Listed 14 days
Property features AI
Exterior
- Utilities: Public water; Public sewer
- Home design: Single-family residence; Residential property
- Construction: Shingle roof; Below-grade finished area
- Exterior features: Level lot
Interior
- Bathrooms: Two three-quarter bathrooms
- Heating & cooling: Natural gas heating with forced air; Central air conditioning
- Interior features: Finished basement
Neighborhood map
What this means for you Summary
Snapshot
- This is a 4-bed/2.0-bath single-family listed at $70k.
Deal economics
- At list price, monthly cash flow is $447 ($5k/yr) — positive.
- The deal already cash-flows at list — no discount required.
- Meets the 1% rule at list price ($1k rent vs $70k).
Location & tenants
- Location reads 73/100 on livability (#262 in IA) — a middle-class / working-renter tenant base. Strengths: crime A+, cost of living A+, housing A+; Watch: health & safety D, amenities F, commute F.
- Akron Westfield Community School District (rural): math 75% / reading 78% proficiency, ranked #50 of 289 in IA (top 17%) — strong family-tenant draw, lease renewals of 3-5y typical.
- Zoned schools: Akron Westfield Elementary School (math 77% / reading 82%, grade A, #71 of 616 statewide, top 15%, 249 students, 40% FRL); Akron Westfield Middle School (math 82% / reading 82%, grade A+, #22 of 246 statewide, top 12%, 139 students, 28% FRL); Akron Westfield Senior High School (math 67% / reading 72%, grade B, #152 of 336 statewide, top 52%, 192 students, 28% FRL).
- Market conditions: 18 active listings in the ZIP; 147 units permitted in Plymouth County in 2024 (112 in 5+ unit buildings).
Forward outlook
- In year one you build about $5k of equity ($486 loan paydown + $5k appreciation (6.4% local appreciation)).
- At projected returns (6.4% appreciation + 3.0% rent growth), your $20k cash investment doubles in ~2 years — after that, you're playing with house money.
- By year 7, paydown + projected appreciation supports a ~$33k cash-out refi (75% LTV) — recoverable capital for the next deal without selling this one.
Negotiation context
- Only 14 days on market — expect competitive offers; lowballing is unlikely to land.
- 2 sale attempts since 4y ago with the ask held roughly flat each time — persistent listings suggest the price (not the market) is what's stuck; bring a comps-based counter.
Risks & watch-outs
- Watch-outs: built in 1940 — expect roof / HVAC / electrical / plumbing capex.
Questions for the listing agent
- Built in 1940 — when were the roof, HVAC, electrical panel, plumbing, and water heater last replaced?
- Is there a deadline driving the sale (1031 exchange, divorce, estate, relocation)? That informs how much negotiation room exists.
- Schools are A-rated — typically a magnet for longer-tenancy family renters. What's the average tenant stay here, and is there a school-zone premium baked into asking?
- What's the average days-on-market for RENTAL listings here right now (not sales)? A rising rental-DOM trend means longer vacancies and softer asking-rent achievability than the comps imply.
- What's the recent tenant-quality profile in this submarket — average credit score on applications, eviction rate, late-payment / NSF rate, and stable-employment percentage? A property-management company in the area should have these aggregated.
- How much new for-sale + rental construction is in the pipeline within 1–3 miles? Heavy new supply typically softens prices + rents 12–24 months out; constrained supply supports both.
Investment metrics
- 1% rule
- 1.77% ✓
- Cap rate
- 13.92%
- Cash-on-cash
- 27.23%
- DSCR
- 2.21
- GRM
- 4.7
CMA / ARV
- ARV (on-the-fly)
- $185,020
- Comps found
- 12
Show comp detail 12 sales within ~0.75 mi
| Address | Dist | Beds/Ba | Sqft | Sold | Price | $/sf | Match |
|---|---|---|---|---|---|---|---|
| 231 Sargent St | 0.19mi | 4/1.5 | 1,620 (+2%) | 6mo | $137,500 | $85 | 81 |
| 530 Dakota St | 0.46mi | 4/1.0 | 1,705 (+7%) | 2mo | $99,700 | $58 | 62 |
| 400 Sargent St | 0.26mi | 4/2.0 | 1,720 (+8%) | 19mo | $166,000 | $97 | 59 |
| 701 S 3rd St | 0.15mi | 3/2.0 (-1) | 1,724 (+8%) | 21mo | $220,500 | $128 | 57 |
| 821 Main St | 0.59mi | 3/1.5 (-1) | 1,513 (-5%) | 3mo | $240,000 | $159 | 54 |
| 530 Jespersen Blvd | 0.53mi | 3/2.0 (-1) | 1,520 (-5%) | 11mo | $350,000 | $230 | 53 |
| 540 S 8th St | 0.50mi | 3/2.0 (-1) | 1,708 (+7%) | 8mo | $135,000 | $79 | 53 |
| 351 Hardy St | 0.22mi | 3/2.0 (-1) | 1,410 (-12%) | 17mo | $135,000 | $96 | 51 |
| 841 Reed St | 0.68mi | 3/2.0 (-1) | 1,555 (-2%) | 12mo | $180,000 | $116 | 49 |
| 2040 Clover Dr | 0.61mi | 3/1.0 (-1) | 1,731 (+8%) | 5mo | $190,000 | $110 | 44 |
| 2030 Clover Dr | 0.61mi | 4/2.0 | 1,808 (+13%) | 14mo | $210,000 | $116 | 38 |
| 301 N 8th St | 0.71mi | 3/2.5 (-1) | 1,752 (+10%) | 23mo | $260,000 | $148 | 24 |
Match score weights: distance 35% · size 25% · config 20% · recency 20%. Top-matched comps best support the ARV.
Projected returns pro-forma
6.41% appreciation · 3.0% rent growth · sell at horizon
- IRR
- 39.1%
- Equity multiple
- 3.57×
- Total profit
- $50,549
- Equity at exit
- $46,047
- IRR
- 36.1%
- Equity multiple
- 7.40×
- Total profit
- $126,082
- Equity at exit
- $85,115
Cash invested: $19,702 (down + closing). Projections, not guarantees.
Landlord ↔ Tenant lean methodology
- Overall (STATE)
- 83 Strongly Landlord-Friendly
- State Iowa
- 83 Strongly Landlord-Friendly · R+6
- County
- — inherits STATE
- City
- — inherits STATE
ZIP-level market 51001
- Home prices YoY
- 2.2%
- Active inventory
- 18
- Price-to-rent
- 4.7×
Monthly cashflow live
- Estimated rent
- $1,249 medium interval (Pro) →
- Mortgage (P&I)
- −$369
- Tax from tax record
- −$141 /mo · $1,694/yr
- Insurance
- −$29
- HOA
- −$0
- Vacancy / Maint / Mgmt
- −$262
- Net cashflow
- $447
Break-even live
Sensitivity live
| Price | -10% $487 | -5% $467 | +0% $447 | +5% $427 | +10% $407 |
|---|---|---|---|---|---|
| Rent | -10% $348 | -5% $398 | +0% $447 | +5% $496 | +10% $546 |
| Rate | -1.0pp $483 | -0.5pp $465 | base $447 | +0.5pp $429 | +1.0pp $410 |
UW: 25.0% down · 7.5% · 30yr · 1.5% tax · 5.0% vac · 8.0% maint · 8.0% mgmt
Financing live
Cash to close
- Down payment
- $17,591
- Closing costs
- $2,111
- Reserves months
- —
- Total cash needed
- —
Loan-product check · same deal, 3 products live
Conventional
25% down · 7.5% · 30yr
- Down + closing
- —
- Monthly P&I
- —
- Monthly cashflow
- —
- DSCR
- —
- Eligible?
- —
Personal DTI + credit; lowest rate.
DSCR
20% down · 8.5% · 30yr
- Down + closing
- —
- Monthly P&I
- —
- Monthly cashflow
- —
- DSCR
- —
- Eligible?
- —
No personal income docs; deal must DSCR.
Hard money
10% down · 12.0% · 12mo
- Down + closing
- —
- Monthly P&I
- —
- Monthly cashflow
- —
- DSCR
- —
- Eligible?
- —
Short-term bridge; refi at stabilization.
Listing history 4 events
-
2026-05-11status Pending
-
2026-04-27$70,364 Active
-
2022-06-06$79,500
-
2008-04-16soldstatus $66,000
ⓘ Source: listings_history table (triggers on properties + properties_extension) + one-shot
backfill from property_details.listing_events for pre-trigger history.
Tax reassessment forecast IA · Partial reset (capped growth)
- Current annual tax
- $1,694 · $141/mo
- Projected year-2 tax
- $1,694 · $141/mo
- Expected delta
- $0/yr ($0/mo · 0.0%)
ⓘ Screening estimate from a state-policy table — verify with the county assessor before closing.
Climate risk First Street
- Flood 1/10 Low FEMA zone X (unshaded) · 0% chance over 30 yrs
- Wildfire 4/10 Moderate
- Heat 3/10 Moderate 7 d/yr ≥103°F today · 15 d/yr by 30 yrs out
- Wind 2/10 Low
- Air quality 2/10 Low 1 unhealthy d/yr today · 1 by 30 yrs out
Nearby sold comps map
Loading sold comps map…
Walkable amenities ~0.75 mi
Loading nearby amenities…
Taxation est. · year 1
- Rental income
- $14,986
- − Mortgage interest
- −$3,941
- − Property taxes
- −$1,694
- − Insurance
- −$352
- − Repairs & maintenance
- −$1,199
- − Management
- −$1,199
- − Depreciation
- −$2,047
- Taxable income
- $4,554
- Est. tax owed @ 24.0%
- −$1,093
- After-tax cash flow
- $4,272/yr
For passive investors: Depreciation is non-cash, so a rental often shows a tax loss while cash-flowing — sheltering income. Rental losses are passive: they offset passive income freely, and up to $25,000/yr can offset ordinary (W-2) income if you actively participate and your MAGI is under $100k (phasing out to $0 by $150k); unused losses carry forward. On sale, claimed depreciation is recaptured at up to 25%, and gains may owe capital-gains tax (a 1031 exchange can defer both). Figures are a year-1 estimate at your 24.0% rate — not tax advice; consult a CPA.
Schools (NCES district)
- District
- Akron Westfield Community School District
- NCES district ID
- 1903220
- Math proficiency
- 75% ▼ -8.00%
- Reading proficiency
- 78% ▼ -3.00%
- Median HH income
- $56,291
- Composite
- 65.35/100
- National rank
- #485
- State rank
- #50 of 289 in IA
Livability — Akron
- Score
- 73/100
- State rank
- #262
- US rank
- #5038
Category grades
Schools grade is shown separately in the Schools card above.
Census & demographics
- Census place
- Akron, IA
- Population (ZIP)
- 2,292
Population outlook (Plymouth County) Hauer SSP2
- Today (2025)
- 25,214 people
- By 2030
- 25,257 · +0.2%
- By 2040
- 25,304 · +0.4%
- By 2050
- 25,421 · +0.8%
- By 2075
- 26,820 · +6.4%
- By 2100
- 27,604 · +9.5%
Race, ethnicity, and origin ACS 2023
- Neighborhood character
- Predominantly White (91%)
- Race & ethnicity
- White 91% Hispanic / Latino 5% Native American 3% Two or more races 3%
- Common ancestry
- Iranian 8% Portuguese 3% Lithuanian 2%
- Foreign-born
- 2% · Canada
- Languages at home
- 97% English-only · Spanish 2%
Political lean MEDSL · Plymouth
- 2024 margin
- Solid R (+54.2) · D 22.3% · R 76.5% · Other 1.2%
- 2008→2024 swing
- -29.2pp toward R · 2008: -25.1pp · 2024: -54.2pp
- All cycles
- 2024: R+54.2 2020: R+49.3 2016: R+51.9 2012: R+34.3 2008: R+25.1
Not yet ingested
- Civics
- —
Market trends
- HPI YoY
- ▲ 6.41%
- Current HPI
- 296.3686
- Rent YoY
- —
- Metro
- —
- State GDP YoY
- ▲ 2.48%
- F500 in state
- 4
Industry mix (Fortune 500 HQ in IA)
| Industry | F500 HQs | Revenue |
|---|---|---|
| Financial Services | 1 | $16B |
|
||
| Retail / Convenience | 1 | $15B |
|
||
Price history
+6.6% since first listed4 events — show timeline
- 2026-05-11 Pending — NWIA
- 2026-04-27 Listed $70,364 NWIA
- 2022-06-06 Listed $79,500 NWIA
- 2008-04-16 Sold (Public Records) $66,000 Public Records
Property tax history
+5.6%/yrLatest (2025): $1,694 · +16.5% YoY. Source: county tax records.
Cash-flow waterfall
monthlySold comps — $/sqft
last 12 mo · ≤1 miLoading sold comps…