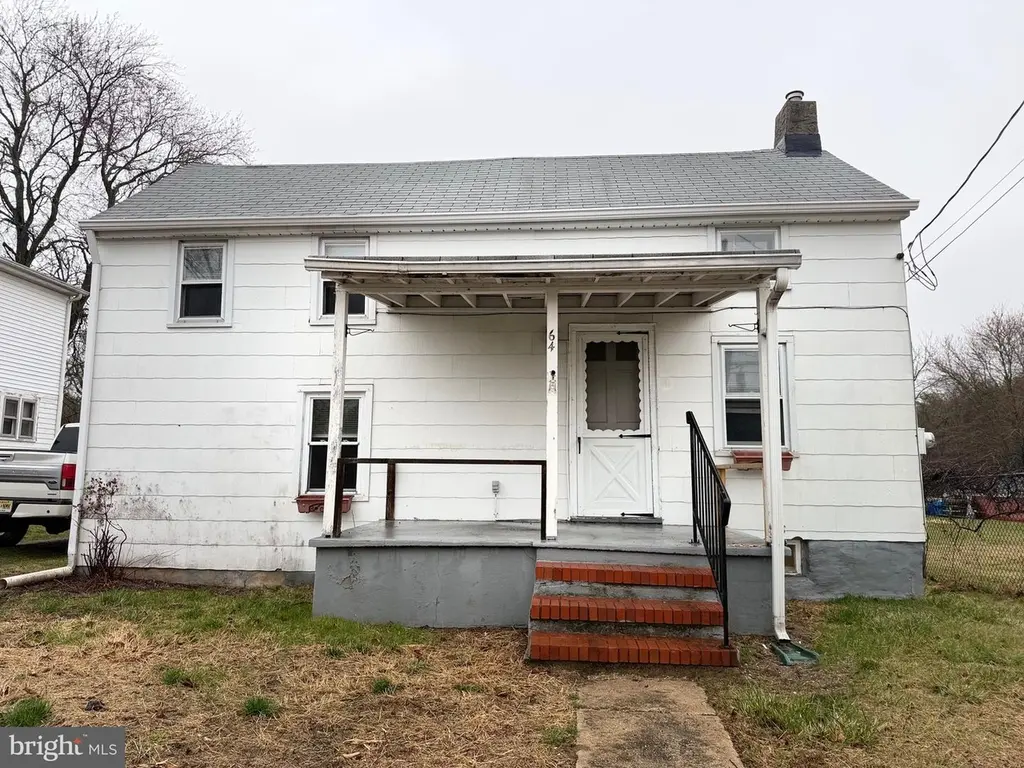
64 Maple Ave · Cedarville, NJ
Flood risk 1/10 · Minimal
- FEMA flood zone
- X (unshaded)
- Chance of flooding over 30 yrs
- 0.0%
- Est. flood insurance / yr
- $507 – $1,088
Fire risk 5/10 · Moderate
- Est. fire insurance / yr
- $526 – $976
Heat risk 7/10 · Major
- Hot days now (above 102°F)
- 7 days/yr
- Hot days in 30 yrs
- 16 days/yr
Wind risk 8/10 · Major
- Chance of severe wind over 30 yrs
- 80.0%
Air-quality risk 2/10 · Minimal
- Unhealthy air days now
- 1 days/yr
- Unhealthy air days in 30 yrs
- 3 days/yr
Risk factors via First Street. Map © Google.
Why this score? — see what drove the C grade
The composite is a weighted blend of 9 inputs, each scored 0–100. Each bar is that input's sub-score; the figure is the points it added to the 100-point composite (weight × sub-score).
- Cash flow +24.2/30.0
- DSCR +7.8/10.0
- ARV discount +7.5/15.0
- 1% rule +7.0/10.0
- Livability +3.1/5.0
- Rent growth +2.5/5.0
- Condition / age +2.5/5.0
- Schools +2.4/10.0
- Appreciation +0.2/10.0
$124,900
🖨 Deal sheet 📄 Offer letter ✓ Due diligence
Listing remarks MLS
2-story home in quaint village of Cedarville would make a great starter home. Needs some cosmetic updating. Has 1-car detached garage, partially fenced yard and deep lot. Close to fishing and boating on the Delaware Bay.
Key facts
- 0.24 acre lot
- 2 parking spots
- Built 1900
Property features AI
Finance
- Other: Pets allowed (cats and dogs OK)
- Financial info: Ownership: Fee simple; Lease not considered
Exterior
- Parking: Driveway parking (2 spaces); Total of 2 garage/parking spaces
- Utilities: Private water; Private sewer; Natural gas heating and hot water
- Home design: Detached structure; Main entrance faces south; Entry level: 1
- Construction: Frame construction; Stone foundation with crawl space; Asphalt roof; Building winterized
- Exterior features: Chain link fencing; Shed on property; Other structures above grade and below grade; Not in a federal flood zone; Paved road access (city/county road responsibility)
Interior
- Bedrooms: 2 bedrooms on the main level
- Bathrooms: 1 full bathroom on the main level
- Heating & cooling: Forced air heating; Natural gas hot water
- Interior features: Partial basement; Living area source: Assessor
Neighborhood map
What this means for you Summary
Snapshot
- This is a 2-bed/1.0-bath single-family listed at $125k.
Deal economics
- At list price, monthly cash flow is $249 ($3k/yr) — positive.
- The deal already cash-flows at list — no discount required.
- Meets the 1% rule at list price ($1k rent vs $125k).
- Recommended offer: $114k (9.0% below list) — sets the bar for market timing.
Location & tenants
- Location reads 62/100 on livability (#443 in NJ) — a middle-class / working-renter tenant base. Strengths: housing A+, employment A-; Watch: crime C-, schools D-, amenities F.
- Lawrence Township School District (rural): math 14% / reading 37% proficiency, ranked #373 of 472 in NJ (top 79%) — low school quality limits family demand, transient renter base, plan for 1-2y turnover.
- Market conditions: 14 active listings in the ZIP; 216 units permitted in Cumberland County in 2024 (73 in 5+ unit buildings).
Forward outlook
- Local home prices are declining (-3.0%/yr); year-one equity from $864 of loan paydown is wiped out by about $4k of value loss. Plan a longer hold.
- Cumberland County population projected to shrink 7% by 2050 — rents likely to lag national; underwrite the cash flow, not the appreciation.
Negotiation context
- It's been on market 94 days — a 9% lower offer ($114k) is reasonable based on typical stale-listing flexibility.
- 3 sale attempts since 16y ago; this cycle's ask has dropped $10k (7%) from the opening price — seller is motivated, your offer sets the floor, not the list.
- Current owner paid $78k; list at $125k implies a 61% gain — meaningful room to come down on a strong offer.
Risks & watch-outs
- Watch-outs: built in 1900 — expect roof / HVAC / electrical / plumbing capex.
- Climate carrying-cost: severe wind risk, 80% chance of damaging wind over 30y; moderate wildfire risk; extreme-heat days projected 7→16/yr by 2055 (HVAC capex compounding) — expect insurance premiums to compound above CPI over the hold.
Questions for the listing agent
- It's been on market 94 days. Have you received any prior offers? Is the seller open to a 9% concession, seller financing, or rate buy-down credit?
- Built in 1900 — when were the roof, HVAC, electrical panel, plumbing, and water heater last replaced?
- Why hasn't it sold? Are there any deal-killer items the seller is aware of (foundation, flood, title, zoning, code violations)?
- Is there a deadline driving the sale (1031 exchange, divorce, estate, relocation)? That informs how much negotiation room exists.
- Schools are D-rated, which usually means shorter tenancies and higher turnover. Who's the typical renter profile here, and what's been the actual vacancy rate?
- What's the average days-on-market for RENTAL listings here right now (not sales)? A rising rental-DOM trend means longer vacancies and softer asking-rent achievability than the comps imply.
- What's the recent tenant-quality profile in this submarket — average credit score on applications, eviction rate, late-payment / NSF rate, and stable-employment percentage? A property-management company in the area should have these aggregated.
- How much new for-sale + rental construction is in the pipeline within 1–3 miles? Heavy new supply typically softens prices + rents 12–24 months out; constrained supply supports both.
Investment metrics
- 1% rule
- 1.20% ✓
- Cap rate
- 8.68%
- Cash-on-cash
- 8.53%
- DSCR
- 1.38
- GRM
- 7.0
CMA / ARV
- ARV (on-the-fly)
- $261,227
- Comps found
- 2
Show comp detail 2 sales within ~0.75 mi
| Address | Dist | Beds/Ba | Sqft | Sold | Price | $/sf | Match |
|---|---|---|---|---|---|---|---|
| 59 Mulford Ave | 0.61mi | 2/1.0 | 1,105 (+1%) | 14mo | $180,000 | $163 | 58 |
| 478 Main St | 0.61mi | 3/1.0 (+1) | 1,025 (-6%) | 3mo | $245,000 | $239 | 54 |
Match score weights: distance 35% · size 25% · config 20% · recency 20%. Top-matched comps best support the ARV.
Projected returns pro-forma
-3.0% appreciation · 3.0% rent growth · sell at horizon
- IRR
- -3.3%
- Equity multiple
- 0.88×
- Total profit
- $-4,346
- Equity at exit
- $18,623
- IRR
- 6.4%
- Equity multiple
- 1.48×
- Total profit
- $16,865
- Equity at exit
- $10,799
Cash invested: $34,972 (down + closing). Projections, not guarantees.
Landlord ↔ Tenant lean methodology
- Overall (STATE)
- 21 Tenant-Leaning
- State New Jersey
- 21 Tenant-Leaning · D+6
- County
- — inherits STATE
- City
- — inherits STATE
ZIP-level market 08311
- Home prices YoY
- -4.2%
- Active inventory
- 14
- Price-to-rent
- 7.0×
Monthly cashflow live
- Estimated rent
- $1,497 medium interval (Pro) →
- Mortgage (P&I)
- −$655
- Tax from tax record
- −$227 /mo · $2,727/yr
- Insurance
- −$52
- HOA
- −$0
- Vacancy / Maint / Mgmt
- −$314
- Net cashflow
- $249
Break-even live
UW: 25.0% down · 7.5% · 30yr · 1.5% tax · 5.0% vac · 8.0% maint · 8.0% mgmt
Financing live
Cash to close
- Down payment
- $31,225
- Closing costs
- $3,747
- Reserves months
- —
- Total cash needed
- —
Loan-product check · same deal, 3 products live
Conventional
25% down · 7.5% · 30yr
- Down + closing
- —
- Monthly P&I
- —
- Monthly cashflow
- —
- DSCR
- —
- Eligible?
- —
Personal DTI + credit; lowest rate.
DSCR
20% down · 8.5% · 30yr
- Down + closing
- —
- Monthly P&I
- —
- Monthly cashflow
- —
- DSCR
- —
- Eligible?
- —
No personal income docs; deal must DSCR.
Hard money
10% down · 12.0% · 12mo
- Down + closing
- —
- Monthly P&I
- —
- Monthly cashflow
- —
- DSCR
- —
- Eligible?
- —
Short-term bridge; refi at stabilization.
Listing history 25 events
-
2026-06-19days on market $124,900 Active 94 DOM
-
2026-06-18days on market $124,900 Active 93 DOM
-
2026-06-17days on market $124,900 Active 92 DOM
-
2026-06-16days on market $124,900 Active 91 DOM
-
2026-06-15days on market $124,900 Active 90 DOM
-
2026-06-14days on market $124,900 Active 88 DOM
-
2026-06-13days on market $124,900 Active 87 DOM
-
2026-06-10days on market $124,900 Active 85 DOM
-
2026-06-09days on market $124,900 Active 84 DOM
-
2026-06-08days on market $124,900 Active 83 DOM
-
2026-06-07days on market $124,900 Active 82 DOM
-
2026-06-03days on market $124,900 Active 78 DOM
-
2026-06-02days on market $124,900 Active 77 DOM
-
2026-06-01days on market $124,900 Active 76 DOM
-
2026-05-31days on market $124,900 Active 75 DOM
-
2026-05-30days on market $124,900 Active 74 DOM
-
2026-05-05price $124,900
-
2026-03-17$134,900 Active
-
2011-02-14soldstatus $77,500
-
2011-02-04soldstatus $77,500 220-char remark
Show marketing remark (174 chars)
Older 2-story home in Cedarville would make a great starter home. Has 1-car detached garage, partially fenced yard and deep lot. Close to fishing and boating on Delaware Bay.
-
2011-02-04soldstatus $77,500 174-char remark
Show marketing remark (174 chars)
Older 2-story home in Cedarville would make a great starter home. Has 1-car detached garage, partially fenced yard and deep lot. Close to fishing and boating on Delaware Bay.
-
2010-12-14historical 220-char remark
Show marketing remark (174 chars)
Older 2-story home in Cedarville would make a great starter home. Has 1-car detached garage, partially fenced yard and deep lot. Close to fishing and boating on Delaware Bay.
-
2010-12-14historical 174-char remark
Show marketing remark (174 chars)
Older 2-story home in Cedarville would make a great starter home. Has 1-car detached garage, partially fenced yard and deep lot. Close to fishing and boating on Delaware Bay.
-
2010-03-23$74,900 220-char remark
Show marketing remark (174 chars)
Older 2-story home in Cedarville would make a great starter home. Has 1-car detached garage, partially fenced yard and deep lot. Close to fishing and boating on Delaware Bay.
-
2010-03-23$74,900 174-char remark
Show marketing remark (174 chars)
Older 2-story home in Cedarville would make a great starter home. Has 1-car detached garage, partially fenced yard and deep lot. Close to fishing and boating on Delaware Bay.
ⓘ Source: listings_history table (triggers on properties + properties_extension) + one-shot
backfill from property_details.listing_events for pre-trigger history.
Tax reassessment forecast NJ · Partial reset (capped growth)
- Current annual tax
- $2,727 · $227/mo
- Projected year-2 tax
- $2,918 · $243/mo
- Expected delta
- +$192/yr (+$16/mo · 7.0%)
ⓘ Screening estimate from a state-policy table — verify with the county assessor before closing.
Climate risk First Street
- Flood 1/10 Low FEMA zone X (unshaded) · 0% chance over 30 yrs
- Wildfire 5/10 Major
- Heat 7/10 Severe 7 d/yr ≥102°F today · 16 d/yr by 30 yrs out
- Wind 8/10 Severe 80% chance of damaging wind over 30 yrs
- Air quality 2/10 Low 1 unhealthy d/yr today · 3 by 30 yrs out
Nearby sold comps map
Loading sold comps map…
Walkable amenities ~0.75 mi
Loading nearby amenities…
Taxation est. · year 1
- Rental income
- $17,966
- − Mortgage interest
- −$6,996
- − Property taxes
- −$2,727
- − Insurance
- −$624
- − Repairs & maintenance
- −$1,437
- − Management
- −$1,437
- − Depreciation
- −$3,633
- Taxable income
- $1,110
- Est. tax owed @ 24.0%
- −$266
- After-tax cash flow
- $2,716/yr
For passive investors: Depreciation is non-cash, so a rental often shows a tax loss while cash-flowing — sheltering income. Rental losses are passive: they offset passive income freely, and up to $25,000/yr can offset ordinary (W-2) income if you actively participate and your MAGI is under $100k (phasing out to $0 by $150k); unused losses carry forward. On sale, claimed depreciation is recaptured at up to 25%, and gains may owe capital-gains tax (a 1031 exchange can defer both). Figures are a year-1 estimate at your 24.0% rate — not tax advice; consult a CPA.
Schools (NCES district)
- District
- Lawrence Township School District
- NCES district ID
- 3408370
- Math proficiency
- 14% ▼ -21.00%
- Reading proficiency
- 37% ▼ -16.00%
- Median HH income
- $66,807
- Composite
- 23.99/100
- National rank
- #7778
- State rank
- #373 of 472 in NJ
Livability — Cedarville
- Score
- 62/100
- State rank
- #443
- US rank
- #16441
Category grades
Schools grade is shown separately in the Schools card above.
Census & demographics
- Census place
- Cedarville, NJ
- City population
- 1,656
- Population (ZIP)
- 1,656
Population outlook (Cumberland County) Hauer SSP2
- Today (2025)
- 152,743 people
- By 2030
- 150,373 · -1.6%
- By 2040
- 146,881 · -3.8%
- By 2050
- 142,653 · -6.6%
- By 2075
- 129,468 · -15.2%
- By 2100
- 107,456 · -29.6%
Race, ethnicity, and origin ACS 2023
- Neighborhood character
- Predominantly White (69%)
- Race & ethnicity
- White 69% Hispanic / Latino 15% Two or more races 8% Black 7% Native American 4% Asian 2%
- Hispanic origin (detail)
- Mexican 4% Puerto Rican 9%
- Common ancestry
- Romanian 3% Lithuanian 2% Iranian 1%
- Foreign-born
- 7% · Canada, Jamaica, China
- Languages at home
- 90% English-only · Spanish 8% Chinese 2%
Political lean MEDSL · Cumberland
- 2024 margin
- Toss-up / Even · D 47.6% · R 51.3% · Other 1.1%
- 2008→2024 swing
- -25.4pp toward R · 2008: 21.6pp · 2024: -3.8pp
- All cycles
- 2024: R+3.8 2020: D+6.0 2016: D+5.3 2012: D+23.1 2008: D+21.6
Not yet ingested
- Civics
- —
Market trends
- HPI YoY
- ▼ -9.66%
- Current HPI
- 219.916
- Rent YoY
- —
- Metro
- —
- State GDP YoY
- ▲ 2.05%
- F500 in state
- 34
Industry mix (Fortune 500 HQ in NJ)
| Industry | F500 HQs | Revenue |
|---|---|---|
| Consumer Goods | 3 | $31B |
|
||
| Pharmaceuticals | 2 | $153B |
|
||
| Technology | 2 | $21B |
|
||
| Insurance | 2 | $20B |
|
||
| Healthcare | 2 | $19B |
|
||
| Financial Services | 1 | $70B |
|
||
Price history
+66.8% since first listed9 events — show timeline
- 2026-05-05 Price Changed $124,900 BRIGHT MLS
- 2026-03-17 Listed $134,900 BRIGHT MLS
- 2011-02-14 Sold (Public Records) $77,500 Public Records
- 2011-02-04 Sold (MLS) $77,500 SJSRMLS
- 2011-02-04 Sold (MLS) $77,500 BRIGHT MLS
- 2010-12-14 Listing Removed — SJSRMLS
- 2010-12-14 Listing Removed — BRIGHT MLS
- 2010-03-23 Listed $74,900 SJSRMLS
- 2010-03-23 Listed $74,900 BRIGHT MLS
Property tax history
+2.5%/yrLatest (2025): $2,727 · +2.5% YoY. Source: county tax records.
Cash-flow waterfall
monthlySold comps — $/sqft
last 12 mo · ≤1 miLoading sold comps…